INTRODUCTION
Minerals are a key component of dairy cow nutrition and their effects on performance, product quality, health, fertility and welfare are well documented (NRC 2001, 2005; Suttle Reference Suttle2010). Excessive feeding of minerals raises diet cost and can increase the environmental impact of dairy farming (Hristov et al. Reference Hristov, Hazen and Ellsworth2006, Reference Hristov, Hazen and Ellsworth2007) and compromise cow health, whereas underfeeding can reduce performance, fertility and health. National mineral requirement standards for dairy cows vary considerably between countries, mainly due to different criteria of adequacy, factorial models with different components, or different safety margins (Suttle Reference Suttle2010). For certain minerals, requirements for dairy cows are based on data generated from animals producing at a level considerably lower than the contemporary dairy cow, or, for minerals such as copper (Cu), are extrapolated from sheep (e.g. ARC 1980; Jarrige Reference Jarrige1989). As a consequence, some national authorities have updated requirements for individual minerals when new information has become available (e.g. calcium (Ca) and phosphorus (P); AFRC 1991; NRC 2001).
Recent studies in the USA have reported that a high proportion of dairy cows were being fed minerals at levels well in excess of requirements. For example, the mean dietary concentration of zinc (Zn) fed to lactating dairy cows in Wisconsin was proportionally 0·33 above NRC (2001) requirements, while the mean concentration of Cu was 0·73 in excess (Li et al. Reference Li, McCrory, Powell, Saam and Jackson-Smith2005). Similarly, P, potassium (K) and magnesium (Mg) fed on Idaho dairy farms were proportionally 0·36, 0·79 and 0·85 above NRC (2001) requirements, respectively (Hristov et al. Reference Hristov, Hazen and Ellsworth2006, Reference Hristov, Hazen and Ellsworth2007). Castillo et al. (Reference Castillo, St-Pierre, Silva del Rio and Weiss2013) also reported that on 39 dairy herds in California, Ca was being fed at 0·5 times and P at 0·3 times above that advised by NRC (2001), with Cu being provided at 0·9 times above the recommended level, with 0·10 of herds feeding more than three times the recommended dietary concentration (Castillo et al. Reference Castillo, St-Pierre, Silva del Rio and Weiss2013).
There is evidence in the UK that minerals are also being fed in excess of requirements. For example, 26 cases of cattle deaths per year were reported between 2005 and 2012 due to Cu poisoning (AHVLA 2014). In many instances this could be attributed to an excessive inclusion rate of Cu in the diet (e.g. Bidewell et al. Reference Bidewell, David and Livesey2000), although often the supply from supplementary sources including free-access minerals and boluses or the basal forages was not taken into account, yet could contribute a substantial amount (Anon. 2001). In contrast, some herds are under-supplying minerals, with an average of 168 cases of Cu deficiency in cattle per year reported in the UK between 2005 and 2012 (AHVLA 2014), although it is difficult to determine how many of these were from lactating dairy cows over the winter feeding period. Accurate information on mineral feeding levels on commercial dairy herds is however, poorly documented. The objectives of the present study were to determine over the winter feeding period in central and northern England the dietary concentration of ten minerals from all sources with a particular focus on Cu, and compare these to UK and other national recommended levels.
MATERIALS AND METHODS
Herd selection and characteristics
A sub-sample of 50 dairy herds ranging from Lancashire in the North and Worcestershire in the South, and from Powys in the West to Derbyshire in the East of the UK were selected from a database supplied by DairyCo, the dairy farmers levy body covering England, Scotland and Wales. The herds were visited once between November 2011 and March 2012 when the cows were housed and fed full winter rations; none of the herds were grazing at the time of the visit. The herd characteristics, feeding system and mineral supplementation were recorded on the day of the visit, along with details on supplements being used. Ten of the herds had organic accreditation and a maximum of seven were selected that were using one feed company or nutritionist at the time of the visit. Of the 50 herds visited, 40 had an all-year-round calving pattern, four autumn calving, two were spring calving, with the remainder block-calving in autumn and spring. Holstein was the major breed on 37 herds, followed by Friesian (four), cross bred (four), Ayrshire (three) and Jersey (two). Compound concentrates fed in the parlour during milking (parlour concentrates) were provided on 40 of the 50 herds, and none were using out-of-parlour concentrate feeders.
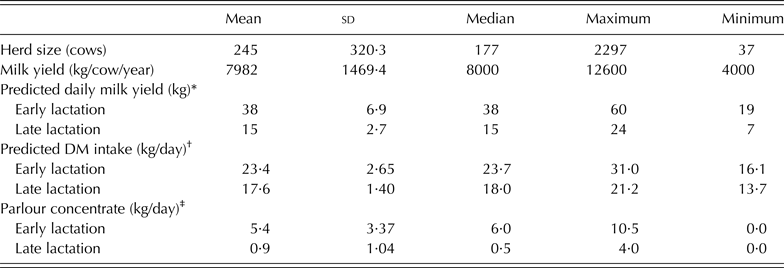
Herd size ranged from 37 to 2297 cows, with a mean of 245 and median of 177, respectively (Table 1). Herd milk yield ranged from 4000 to 12 600 kg/cow/year, with a mean and median of 7982 and 8000 kg, respectively. In addition to the parlour concentrates or forage mix, five herds (0·10) fed three additional mineral sources, 14 herds (0·28) fed two sources; 21 herds (0·42) fed one source and 10 herds (0·20) fed no additional source. Mineral lick blocks (including trace mineral fortified blocks) were the most popular source of supplement, being offered on 27 (0·54) of the herds surveyed, with rumen mineral boluses used on 18 (0·36), free access minerals on nine (0·18), drench on six (0·12), injection on three (0·06) and mineral addition to the drinking water on one (0·02).
Characteristics of dairy herds (n = 50) surveyed to determine the quantity of minerals being fed during winter in central and northern England

* Predicted from Morant & Gnanasakthy (Reference Morant and Gnanasakthy1989).
† Predicted from NRC (2001).
‡ Forty out of the 50 herds used parlour concentrates.
Sample collection and analysis
The basal ration fed to the high and low groups of milking cows were sampled within 10 min of feed out, with c. 12 grab samples taken at roughly 5 s intervals (Li et al. Reference Li, McCrory, Powell, Saam and Jackson-Smith2005). Sub-samples of clamp and big-bale silage were collected as described by Sinclair (Reference Sinclair2006). Individual samples were bulked, mixed thoroughly and a composite sample of c. 1 kg stored at –20 °C. Parlour concentrates were collected by taking at least 12 grab samples from the storage area, bulked, mixed thoroughly and a composite sample of 500 g stored at –20 °C. Samples of fresh drinking water were collected from the running water of a trough located in the cow housing; the water was left to run for 1–2 min before collecting a 100 ml sub-sample into a sterile container, and stored at –20 °C.
Feed samples were defrosted, dried to a constant weight at 105° C according to AOAC (2000) and ground through a 0·5 mm mill. A sub-sample of concentrate being fed in the milking parlour, forage, forage mix and water was extracted using a DigiPREP digestion system (Qmx Laboratories, Essex, UK) and analysed for sodium (Na), K, Ca, Mg, P, Cu, Zn, iron (Fe), manganese (Mn) and molybdenum (Mo) by ICP-MS (Thermo Fisher Scientific Inc., Hemel Hempstead, UK) as described by Cope et al. (Reference Cope, Mackenzie, Wilde and Sinclair2009). Briefly, 0·5 g of dried, milled sample was accurately weighted into a DigiTUBE and 1 ml of concentrated HCl and 6 ml of concentrated HNO3 added. The tubes were then heated over 30 min to 45 °C in a DigiPREP heating block and held for 1 min before being increased over 25 min to 65 °C, held for another 5 min, then increased over 15 min to 100 °C and refluxed for 40 min for the forages and 45 min for the concentrates. The samples were then diluted with purified water before analysis. Certified EU reference samples of hay (BCR-129) and dairy concentrate (BCR-708) were routinely extracted and analysed.
Data handling, calculations and analysis
Daily milk yield (kg) was calculated at day 56 (early) and 245 (late) of lactation using the annual milk yield and the equations of Morant & Gnanasakthy (Reference Morant and Gnanasakthy1989; Table 1). From the daily milk yield, daily DM intake was estimated according to NRC (2001), whereas water intake was calculated according to Little & Shaw (Reference Little and Shaw1978). The quantity of mineral supplied by additional sources (e.g. mineral lick block, free access minerals or injection) on the day of the visit was determined by calculating the rate of use and the companies’ stated mineral concentration. On a number of herds a rumen mineral bolus was administered to the cows at drying off or shortly after calving, or during the summer when the animals were at grass. Using the manufacturers’ stated rate of release, the bolus mineral supply was added to the daily supply only if it was predicted to be releasing minerals on day 56 or 245 of lactation.
The sum of the daily supply of minerals from the parlour concentrates, forage mix (which included the forages, additional feed ingredients and minerals), water and supplementary sources was divided by the daily DM intake to provide a mineral concentration (g or mg/kg DM). The mineral concentration (g or mg/kg DM) for the early and late lactation diets were tested for normality and analysed using the general descriptive statistics component of Genstat version 14.1 (VSN Int. Ltd., Oxford, UK), and the results compared to recommended levels as described for the UK by ARC (1980) and AFRC (1991), France by INRA (Jarrige Reference Jarrige1989), USA by NRC (2001) and Australia by CSIRO (2007).
RESULTS
Mineral supply: early and late lactation
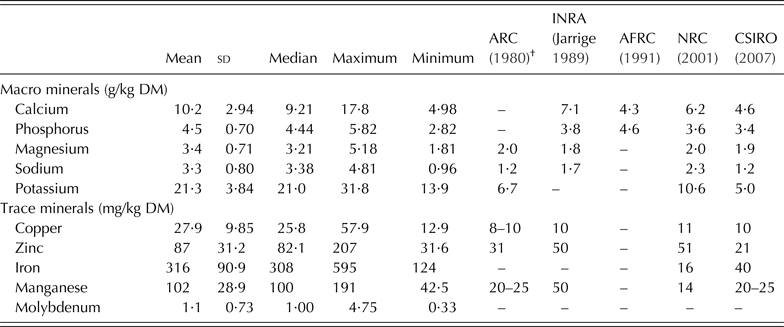
Mean and median dietary concentrations of macro-minerals in the diet of early lactation dairy cows were generally well in excess of all recommended guidelines (Table 2). The macro-mineral that was the closest to requirements was P, with a mean concentration of 4·5 g/kg DM, which was 0·1 g/kg DM lower than that proposed in the UK by AFRC (1991), but 0·7, 0·9 and 1·1 g/kg DM higher than that recommended by INRA (Jarrige Reference Jarrige1989), NRC (2001) and CSIRO (2007) respectively. The maximum dietary concentration of P was 1·2 g/kg DM above the value recommended by AFRC (1991), and 2·4 g/kg DM above CSIRO (2007). The mean dietary Ca concentration of 10·2 g/kg DM was 5·9 g/kg DM above that recommended by AFRC (1991), and 3·1 g/kg DM more than the highest allowance which was advised by INRA (Jarrige Reference Jarrige1989), whereas the maximum dietary concentration of Ca was 10·7 g/kg DM and 13·5 g/kg DM higher than that advised by INRA (Jarrige Reference Jarrige1989) or AFRC (1991), respectively. Dietary concentration of Mg was also high with a mean value of 3·36 mg/kg DM, 1·36 g/kg DM above that recommended by ARC (1980), with only one herd feeding at or below the lowest recommended level. Both Na and K were high and above the UK allowance recommended by ARC (1980), although one herd was feeding below the lowest recommended allowance for Na provided by CSIRO (2007). Mean and median trace mineral concentrations fed in early lactation were also high. For example, Cu was c. 17·9 mg/kg DM higher than that advised by ARC (1980), with one herd feeding 4·8 times above requirement. The mean dietary concentration of Zn at 87 mg/kg DM was considerably higher than the 31 mg/kg DM recommended by ARC (1981) or the highest recommended allowance of 51 mg/kg DM advised by NRC (2001), whilst Fe concentrations were also considerably higher than any of the recommended allowances. Dietary concentrations of Mo were generally low at 1·13 mg/kg DM, although one herd had a high concentration at 4·75 mg/kg DM.
Mineral concentration in the diet of early lactation dairy cows on 50 herds in central and northern England and approximate requirements*
Values represent the contribution from the diet, water and supplementary sources, and are expressed on a g or mg/kg dry matter (DM) intake basis.
* Calculated using the average performance and assuming no live weight change. The requirement for minerals can be affected by antagonists and may therefore be higher, or lower than outlined.
† Values for Ca and P have been superseded by AFRC (1991).
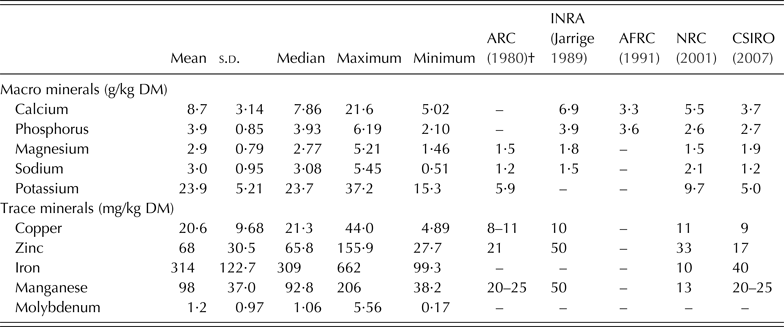
The mean concentration of minerals in the diet of late lactation dairy cows was generally lower than that of early lactation animals, but still in excess for all minerals determined (Table 3). For example, the mean dietary concentration of Ca (8·7 g/kg DM) was 5·4 g/kg DM above that recommended by AFRC (1991), and 1·8 g/kg DM above the highest level recommended by INRA (Jarrige Reference Jarrige1989), whereas the mean dietary P of 3·9 g/kg DM was the same as that recommended by INRA (Jarrige Reference Jarrige1989), but 0·3, 1·3 and 1·2 g/kg DM higher than that recommended by AFRC (1991), NRC (2001) or CSIRO (2007), respectively. Although the mean concentration of P was lower in late than early lactation diets, the highest dietary P concentration of 6·19 g/kg DM was fed to cows in late lactation. The mean and median trace mineral dietary concentration was also lower in the late lactation diets. For example, the mean and median Cu concentration was 21 mg/kg DM, approximately double that recommended by ARC (1981), whereas Zn at 68 mg/kg DM was 47, 18, 35 and 51 mg/kg DM above that recommended by ARC (1980), INRA (Jarrige Reference Jarrige1989), NRC (2001) or (CSIRO 2007), respectively.
Mineral concentrations in the diet of late lactation dairy cows on 50 herds in central and northern England and approximate requirements*
Values represent the contribution from the diet, water and supplementary sources, and are expressed on a g or mg/kg dry matter (DM) intake basis
* Calculated using the average performance and assuming no live weight change. The requirement for minerals can be affected by antagonists and may therefore be higher, or lower than outlined.
† Values for Ca and P have been superseded by AFRC (1991).
Contribution to daily mineral supply from different dietary sources
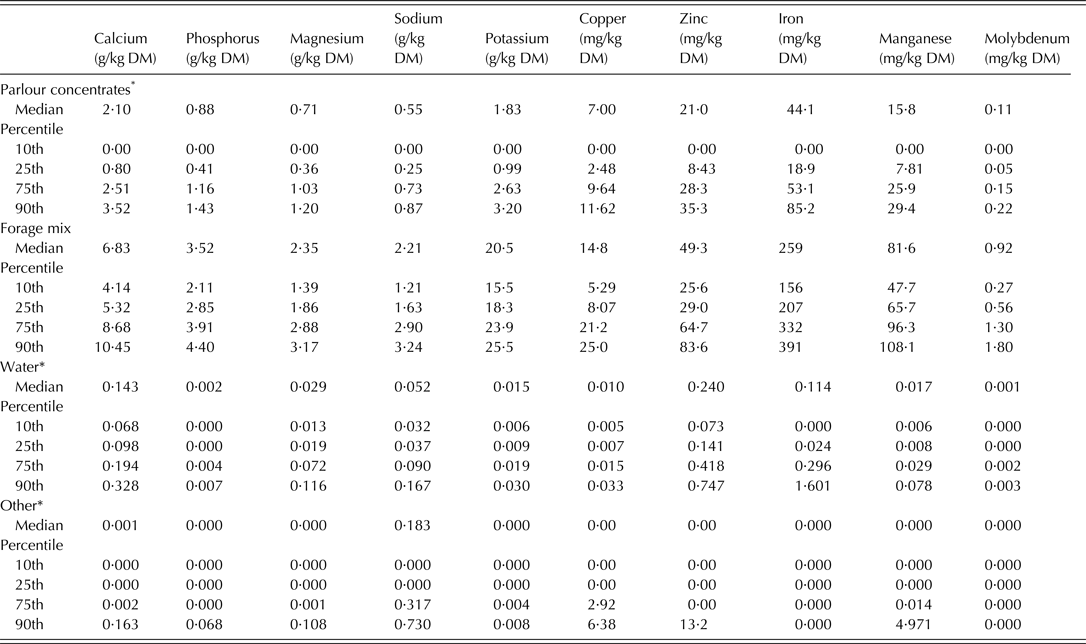
The major contribution to the daily supply of the major minerals was from the forage mix, followed by parlour concentrates (Table 4). For example, the median contribution to total dietary P concentration from the forage mix was 3·5 g/kg DM compared to parlour concentrates at 0·9 g/kg DM. For the upper 90th percentile of herds however, the parlour concentrates supplied 1·43 g P/kg DM and 3·5, 1·2 and 3·2 g/kg DM of Ca, Mg and K, respectively. Other sources of mineral had only a minor contribution to the dietary concentration of major minerals, but on the upper 90th percentile of herds supplied 6·4 mg Cu/kg DM and 13·2 mg Zn/kg DM. Water also had a minor contribution to the dietary concentration of major minerals, but for the upper 90th percentile of herds supplied 0·328 g Ca, 0·116 g Mg and 0·167 g Na/kg DM. Water was not a major supply of any of the trace minerals, except on the herd that fortified the drinking water, which supplied the equivalent of 4·6 and 8·3 mg/kg DM of Cu and Zn, respectively.
Median and percentile range of dietary mineral concentration supplied from the parlour concentrate, forage mix (including straight feeds and minerals), water and supplementary mineral sources on 50 dairy herds in central and northern England (mean of early and late lactation diets)
DM, dry matter.
* Data not normally distributed.
DISCUSSION
The herds used were considered representative of the UK dairy industry, with a mean milk yield of 7982 kg, similar to the UK average of 7553 (DEFRA 2013), although the median herd size of 178 cows was higher than the UK national average of 123 cows (DEFRA 2013). There was a considerable range in recommended mineral allowances between national bodies, with for example AFRC (1991) providing the highest recommended allowance of P in early lactation at 4·6 g/kg DM and CSIRO (2007) the lowest at 3·4 g/kg DM, while for Zn, INRA (Jarrige Reference Jarrige1989) recommended the highest dietary concentration at 50 mg/kg DM and CSIRO (2007) the lowest at 21 mg/kg DM. There was greater agreement for some of the other minerals, such as Mg and Cu. It should be noted that expressing mineral requirements as g or mg/kg DM is dependent on DM intake, which also varies considerably between national bodies for cows of the same live weight, milk production and live weight change.
Mineral feeding levels were generally well in excess of requirements for all minerals, most notably Cu. For Ca, K, Na, Mg, Zn, Fe and Mn, feeding excess results in an increase in diet cost and excretion into the environment, but does not present a particularly negative impact on animal performance or health. For example, no detrimental effects were reported by Beede et al. (Reference Beede, Wang, Donovan, Archbald and Sanchez1991) when dietary concentrations of 18 g Ca/kg DM were fed to non-lactating cows, although it is generally accepted that 10 g/kg DM should not be exceeded (NRC 2001). Feeding excess Na is also generally well-tolerated by dairy cows, and up to 16 g Na/kg DM can be fed without detrimental effects on health or performance, providing sufficient water is available (NRC 2001), well in excess of the maximum of 4·8 and 5·4 g Na/kg DM fed in early and late lactation respectively in the present study. Dairy cows are able to tolerate high dietary Zn levels, with the excess being excreted in the faeces, and as a consequence, NRC (2001) recommend a maximum dietary level of 300–1000 mg/kg DM, substantially higher than the maximum concentration of 207 mg/kg DM reported in the present study. Accumulation of excess Zn in soil and run off into water can, however, pose a significant threat to soil and water quality (Zhang et al. Reference Zhang, He, Calvert, Stoffella and Yang2003). In the present study, the excess Zn supplied above requirements could have resulted in an additional excretion of 0·6 to 1·3 g/cow/day or 0·2–0·4 kg/cow per lactation. Of the remaining minerals, Cu and P represent the greatest potential negative effects on animal performance, health or the environment.
Dietary copper
One of the primary aims of the present study was to determine the dietary concentration of Cu, as this is the most widely reported mineral deficiency in cattle, but also accounts for the greatest number of cases of mineral toxicity (AHVLA 2014). EU Regulation 1831/2003 on additives in animal feed sets the maximum permitted level of Cu in cattle feed at 35 mg/kg (ppm), which at 880 g DM/kg equates to 40 mg/kg on a DM basis. Of the 50 herds sampled in early lactation, six were feeding above this limit, with 32 feeding above the recent UK feed industry maximum guideline of 20 mg Cu/kg DM (Advisory Committee on Animal Feed 2010). In early lactation, all herds were feeding substantially above the maximum nutritional guideline of 11 mg Cu/kg DM. Dietary levels were generally lower in late lactation, but there was still two herds feeding above the legal limit and 27 above the UK industry guideline. Even within the ten herds that had organic accreditation, five (0·50) were feeding above 20 mg Cu/kg DM in early lactation and four (0·40) in late lactation. In contrast, only two (0·04) herds (both non-organic) were feeding on average (i.e. mean of early and late lactation) below the required dietary level of c. 11 mg/kg DM, and may have benefited from supplementation.
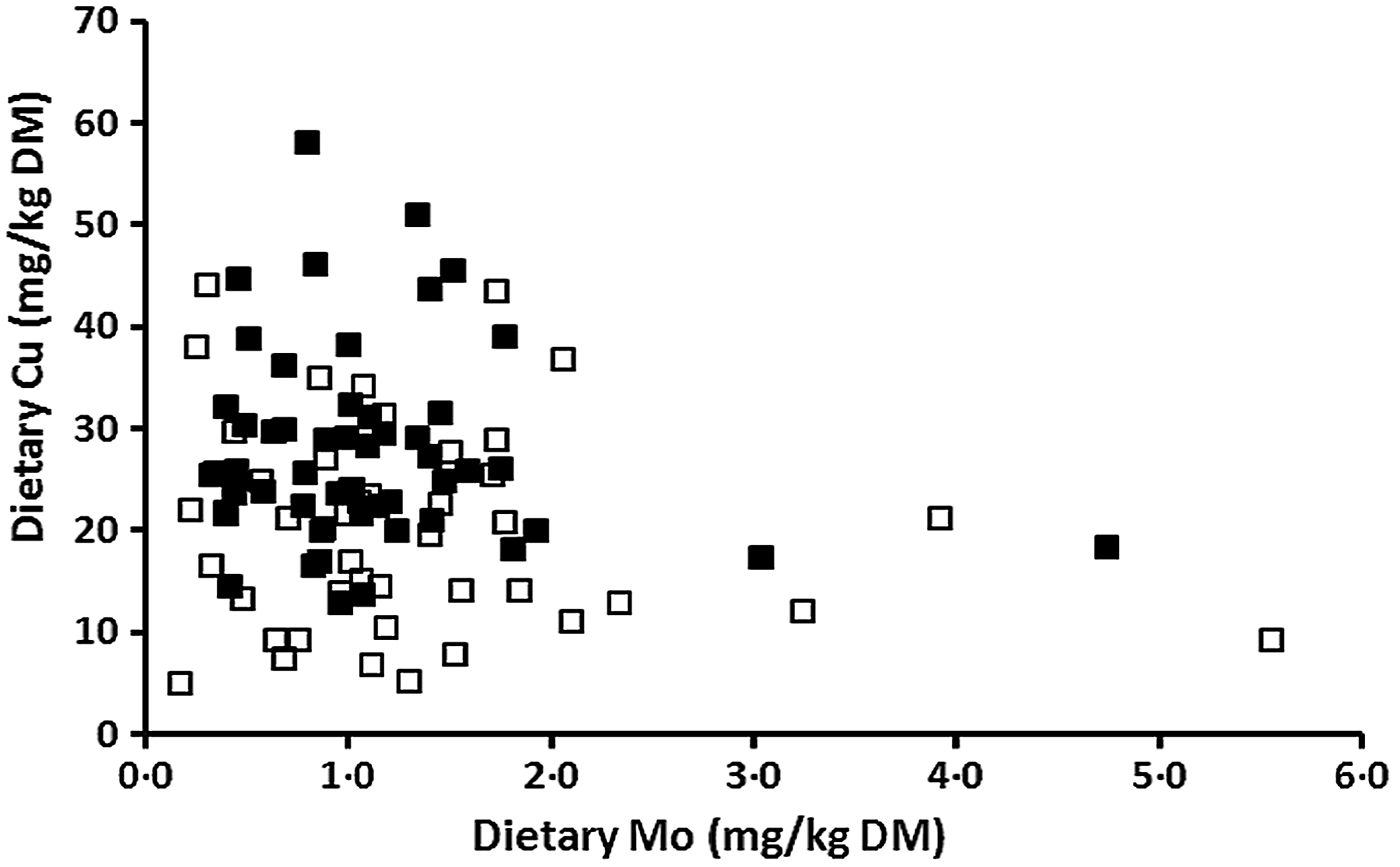
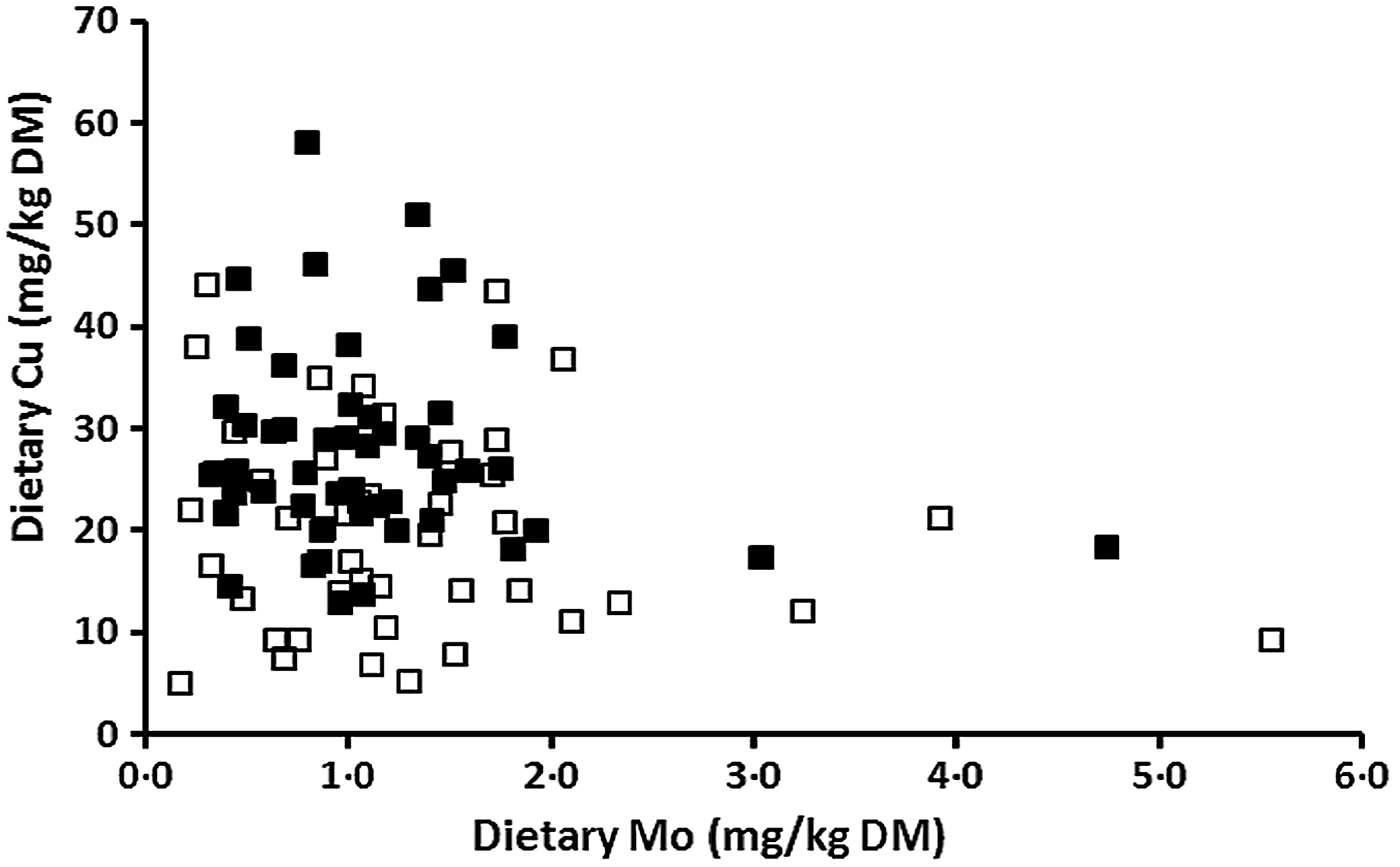
A Cu responsive disorder can be regarded as either primary, due to a lack of Cu in the diet, or secondary, due to an interaction between Cu and antagonists, particularly S and Mo, which in the rumen result in the production of thiomolybdates (TM; Gould & Kendall Reference Gould and Kendall2011), reducing the absorption or subsequent function of Cu. Herds that were feeding high dietary concentrations of Cu may have justified these levels if dietary Mo concentrations were also high. The relationship between dietary Mo and Cu concentration was however, poor for both early and late lactation diets (R 2 = 0·03; P = 0·265 for early lactation and R 2 = 0·03; P = 0·213 for late lactation; Fig. 1). Indeed, herds with the highest dietary concentrations of Mo were feeding some of the lowest levels of Cu. For the majority of herds therefore, dietary Mo concentrations did not justify the high levels of Cu being fed.
Relationship between dietary molybdenum (Mo) and copper (Cu) concentration in early (■) and late (□) lactation diets fed on 50 dairy herds in central and northern England. Values represent the contribution from the diet, water and supplementary sources, and are expressed on a kg dry matter (DM) intake basis. For the early lactation diet Y = 30·4–2·18X; P = 0·265; R2 = 0·03, and for the late lactation diet Y = 22·7–1·79X; P = 0·213; R2 = 0·03.
The liver is the main storage organ for Cu within the dairy cow, and hepatic Cu concentration has been suggested as a useful indicator of status (Laven & Livesey Reference Laven and Livesey2005). Recent studies have shown that, in the absence of significant amounts of antagonists such as Mo and S, feeding 16–17 mg Cu/kg DM resulted in a positive liver Cu balance in high yielding dairy cows (Sinclair et al. Reference Sinclair, Hart, Johnson and Mackenzie2013). Similarly, an analysis of liver Cu concentrations and Cu intake by Sinclair & Mackenzie (Reference Sinclair, Mackenzie, Garnsworthy and Wiseman2013) indicated a dietary concentration of 13 mg/kg DM to be adequate for lactating dairy cows, a value not dissimilar to the 8–11 mg/kg DM recommended by most national bodies, and considerably lower than the mean dietary concentration being fed in early and late lactation in the present study. In the present study, Fe was the mineral in greatest excess, primarily due to its comparatively high concentration in animal feeds, and as a result of soil contamination of forages (Suttle Reference Suttle2010). The effects of feeding excess Fe are primarily as a consequence of interference with the absorption of Cu, with levels as low as 250 mg/kg DM having been shown to affect absorption (Phillippo et al. Reference Phillippo, Humphries, Atkinson, Henderson and Garthwaite1987), although there is currently no method for accurately predicting the effect of dietary Fe levels on Cu absorption.
Dietary phosphorus
Recommended dietary concentrations for P differ between national bodies, with values in early lactation ranging from 3·4 to 4·6 g/kg DM. More recent estimates by Suttle (Reference Suttle2010) suggest an even lower requirement of between 2·6 and 2·8 g/kg DM depending on diet type and likely salivation rate. Studies with dairy cows fed grass and grass-silage-based rations over four lactations have shown no significant difference in intake or performance when they contained 3·6 or 4·5 g P/kg DM (Ferris et al. Reference Ferris, Patterson, McCoy and Kilpatrick2010a). Similarly, there was no difference in the incidence of lameness, mastitis or measures of fertility (Ferris et al. Reference Ferris, McCoy, Patterson and Kilpatrick2010b). Of the 50 herds sampled during the winter feeding period in the present study 41 (0·82) had a P concentration in early lactation above 3·6 g/kg DM, and there is therefore little justification for these high dietary concentrations. Indeed, Wu et al. (Reference Wu, Satter, Blohowiak, Stauffacher and Wilson2001) found few negative effects on performance or bone strength from feeding 3·1 g P/kg DM over three lactations, and recommended that 3·5 g/kg DM provided a sufficient safety margin. In early lactation cows have also been shown to mobilize P irrespective of dietary concentration, and it has been suggested that an even lower dietary concentration could be used at this time without any long term negative effects (Elizondo Salazar et al. Reference Elizondo Salazar, Ferguson, Beegle, Remsburg and Wu2013). In contrast, a reduction in DM intake and milk yield has been associated with dietary P levels below 3·3 g/kg DM in the studies of Call et al. (Reference Call, Butcher, Shupe, Lamb, Boman and Olsen1987) and Valk & Sěbek (Reference Valk and Sěbek1999), most likely due to a reduction in salivary excretion of P and impairment of rumen microbial activity (AFRC 1991).
Excess dietary P is generally associated with an increase in the excretion of P in the faeces (Challa et al. Reference Challa, Braithwaite and Dhanoa1989), but unless dietary values are very high (above 10 g/kg DM), toxicity is rare (NRC 2001). Long-term excess feeding of P can, however, affect Ca and Mg metabolism (Schnewille et al. Reference Schnewille, Van't Klooster and Beynen1994; NRC 2001). The greatest negative impact of excess feeding of P is the increased risk of nutrient enrichment (eutrophication) of watercourses and the subsequent negative impact of dairy farming on the environment (Hristov et al. Reference Hristov, Hazen and Ellsworth2006). For example, Ferris et al. (Reference Ferris, McCoy, Patterson and Kilpatrick2010b) calculated that a reduction in dietary P concentration from 4·5 (the same as the mean value of 4·5 g/kg DM reported here for cows in early lactation) to 3·6 g/kg DM would reduce P excretion by an average of 27 g/day, equivalent to 4·0 kg P per cow over a 150 day winter, or 10·1 kg/ha assuming an average stocking rate of 2·5 cows/ha.
Mineral contribution from different sources
In the present study, the forage mix included additional feed ingredients, along with added minerals, and it is therefore not possible to determine the direct contribution from the basal forages. As common forages and feed ingredients used in the UK typically have a low Cu concentration (Suttle Reference Suttle2010), it is fair to conclude that the majority of Cu in both parlour concentrates and the forage mix were added. As parlour concentrates contributed a smaller proportion to daily DM intake, with ten of the herds not feeding any concentrates in the milking parlour, it is not surprising that their contribution to mineral intake was also lower. For the upper 90th percentile of herds however, parlour concentrates alone supplied more than the UK recommended amount of Cu, Zn and Mn, and between 0·31 and 0·40 of P requirements. Despite the low concentration of minerals in water recorded in the present study, for the upper 90th percentile of herds water could supply 0·33 g Ca/kg DM, or c. 0·08 of requirements advised in early lactation by AFRC (1991) or 0·05 of NRC (2001). These values are below the 90th percentile of dairy herds in California reported by Castillo et al. (Reference Castillo, St-Pierre, Silva del Rio and Weiss2013) where water could contribute 0·58 g Ca/kg DM, or 0·09 of the requirements described by NRC (2001). Iron concentrations in water have also been reported to be as high as 123 mg/l (Socha et al. Reference Socha, Ensley, Tomlinson and Johnson2003), although none of the herds in the current survey had particularly high concentrations, with all values below the 0·3 mg/l suggested for dairy cows (Genther & Beede Reference Genther and Beede2013).
CONCLUSIONS
This is the first study to demonstrate that for the majority of dairy herds in central and northern England, macro and trace minerals were being fed at levels well in excess of dietary requirements, although a few herds were feeding certain minerals below requirements. For minerals such as P, feeding excess is likely to increase the environmental impact of dairy farming. For Cu, there are a concerning number of dairy herds feeding above the industry maximum limit, and of even greater concern are those feeding above the legal limit which poses a major risk to cow health on these farms. High feeding levels of Cu were not justified by the concentration of antagonists in the diet or water.
The authors are very grateful to the farmers who participated in the study, E. McKenna, S. Studden and A. Ali for technical assistance with the mineral analysis and to DairyCo for funding the study.