I. INTRODUCTION
The grain boundary network (GBN) plays a noticeable role in the grain-boundary-related properties in polycrystalline materials. The concept of “grain boundary engineering” (GBE),Reference Watanabe1, Reference Randle2 means “grain boundary design and control” that aims at improving the grain-boundary-related properties. Coincidence site lattices (CSLs) play an important role in GBE, with the notation ∑ denoting the reciprocal density of coincidence sites; the improvement in grain-boundary-related properties are sought to be effected by enhancing the proportion of the so-called low-∑ CSL grain boundaries (GBs)Reference Lin, Palumbo, Erb and Aust3 (∑-value ≤ 29). GBE has been successfully applied in many low stacking fault energy (SFE) face centered cubic (FCC) metallic materials, such as nickel-based alloys,Reference Kumar, Schwartz and King4–Reference Tan, Sridharan, Allen, Nanstad and McClintock9 copper alloys,Reference Randle10–Reference Randle and Davies13 lead alloysReference Wang and Guo14, Reference Xia, Zhou and Chen15 and stainless steels.Reference Shimada, Kokawa, Wang, Sato and Karibe16–Reference Michiuchi, Kokawa, Wang, Sato and Sakai20
Two types of thermomechanical treatment are reported for GBE-processing: iterative strain annealingReference Kumar, Schwartz and King4, Reference Kumar, King and Schwartz5, Reference Schuh, Kumar and King8, Reference Randle10–Reference Wang and Guo14 and one-step strain annealing.Reference Lee and Richards6, Reference Xia, Zhou and Chen7, Reference Tan, Sridharan, Allen, Nanstad and McClintock9, Reference Xia, Zhou and Chen15–Reference Michiuchi, Kokawa, Wang, Sato and Sakai20 Although different processing schedules are applied during GBE-processing, they have the same principal purposesof increasing the proportion of low-∑ CSL GBs, increasing the proportion of triple junctions with ∑3n boundariesReference Schuh, Kumar and King8, Reference Rohrer, Randle, Kim and Hu12 and disrupting the connectivity of the random boundary networkReference Kumar, Schwartz and King4, Reference Randle10, Reference Randle and Coleman11, Reference Schuh, Kumar and King21 or forming large grain-clusters.Reference Xia, Zhou and Chen7, Reference Xia, Zhou, Chen and Wang22, Reference Xia, Zhou and Chen23 Grain-cluster is a domain of twin-related grainsReference Reed, Kumar, Minich and Rudd24, Reference Reed and Kumar25: all of the boundaries within the cluster have ∑3n misorientations, whereas the outer boundaries of the cluster are crystallographically random.Reference Xia, Zhou and Chen23, Reference Gertsman and Henager26
Regarding the GBN evolution during GBE-processing, the “∑3 regeneration model” proposed by Randle,Reference Randle10, Reference Randle and Coleman11 and “boundary decomposition mechanisms” proposed by KumarReference Kumar, Schwartz and King4 and “twinning emission” proposed by Shimada and KokawaReference Shimada, Kokawa, Wang, Sato and Karibe16 could interpret the formation of high proportion of ∑3 boundaries and the disrupted connectivity of the random boundary network after GBE. The key point is that a relatively low-strain deformation is chosen for inducing local grain boundary migration upon heating rather than the full recrystallization route.Reference Lee and Richards6 Our previous worksReference Xia, Zhou and Chen7, Reference Xia, Zhou, Chen and Wang22, Reference Xia, Zhou and Chen23 showed that the GBE microstructures are featured by the formation of large grain-cluster and large amount of inner connected ∑3n type triple junctions. All the grains maintain ∑3n mutual misorientations in a grain-cluster regardless of whether they are adjacently positioned or not. It is believed thatReference Xia, Zhou and Chen7, Reference Xia, Zhou, Chen and Wang22 the grain-cluster is formed by “multiple-twinning”Reference Reed and Kumar25–Reference Cayron31 starting from a single nucleus during the recrystallization process.
Prestrain and annealing are two factors of GBE-processing schedule. Many published articles studied the influence of prestrain and annealing on the resulting GBN. However, high proportion of low-∑ CSL GBs could be formed after GBE with different processing schedules. The reason may be the different initial microstructures. The microstructure after deformation and annealing is influenced by its initial microstructure,Reference Matsumoto, Shibayanagi and Umakoshi32–Reference Liu, Xia, Li, Zhou and Chen35 such as grain size, texture and carbide precipitation at GBs. The present work aims to study the influence of initial grain sizes on the GBN after GBE in nickel (Ni)-based Alloy 690, which is usually used as the steam generator tube material in pressurized water nuclear reactors. Comparison between GBE microstructures with different initial grain sizes was made. Analysis of partially recrystallized microstructure using electron backscatter diffraction-based orientation imaging microscopy (EBSD-OIM) technique gives an indication of the GBN evolution during GBE. Influence of initial grain sizes on GBE microstructures can be understood following the GBN evolution characterization.
II. EXPERIMENT
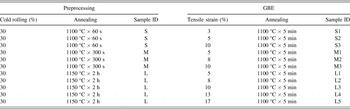
A solution-annealed Alloy 690, with the measured chemical composition (in wt%): 30.39 Cr, 8.88 Fe, 0.023 C, 0.002 S, 0.006 P, 0.07 Si, 0.23 Mn, 0.22 Al, 0.26 Ti, 0.02 Cu, and the balance Ni, was used as the experimental material in this work. The Alloy 690 sample with a shape of 1.12 × 8 × 80 mm was single pass cold-rolled with a thickness reduction of 30%. The deformed strips were vacuum-sealed in quartz capsules and annealed at 1100 °C for 1 min or 5 min or at 1150 °C for 120 min, respectively, then quenched in water. Thereafter, the quartz capsules (WQ) were broken open simultaneously to obtain the desired starting state specimens of the cold rolled and annealed Ni-based Alloy 690 strips with different grain sizes, which have been designated as specimens S, M and L correspondingly. After the GBE-processing, the strips were scheduled to be characterized by low-strain deformation prior to short-duration annealing at adequately high temperature, this part of the data were adopted from our previous works.Reference Xia, Zhou and Chen7, Reference Xia, Zhou, Chen and Wang22, Reference Xia, Zhou and Chen23, Reference Liu, Xia, Li, Zhou and Chen35 The specimens were deformed by tensile deformations at room temperature. Specimens S were deformed with tensile strains of 3%, 5%, and 10% respectively. Specimens M were deformed with tensile strains of 5%, 8%, and 10% respectively. Specimens L were deformed with tensile strains of 5%, 8%, 10%, 13%, and 17% respectively. These tensile-strained strips were vacuum-sealed in quartz capsules and subsequently annealed at 1100 °C for 5 min, then quenched in water. Thereafter the quartz capsules were broken open simultaneously so that the specimens S1, S2, S3, M1, M2, M3, L1, L2, L3, L4, and L5 were obtained correspondingly. These thermomechanical processing procedures are displayed in Table I. The specimens are classified into S-series, M-series and L-series according to their initial grain sizes. In this work, all types of boundaries are included as defining individual grains, and thus the twins are regarded as grains. The partially recrystallized specimens S2p (S-5% tensile strained—1100 °C/60 s), M1p (M-5% tensile strained—1100 °C/120 s) and L3p (L-10% tensile strained—1100 °C/60 s) were prepared to study the GBN evolution during recrystallization.
The thermomechanical processing procedure of specimens.

The specimens for electron backscatter diffraction (EBSD) experiments were mechanically polished, and subsequently electropolished in an electrolyte containing 20% HClO4—80% CH3COOH at room temperature with 30 V direct current for 90 s. The specimen surface crystallographic orientation data were obtained using the HKL-Technology EBSD system (Oxford Instruments, Cambridge, UK), which was attached to a CamScan Apollo 300 scanning electron microscope (SEM; Obducat CamScan Ltd., Cambridge, UK). The EBSD mapping area was 300 × 300 or 800 × 500 μm with step size of 1 or 2 μm according to the grain size. Two maps were measured for each specimen. Grain boundary characters were defined by coincidence site lattice (CSL) model according to the Palumbo-Aust’s criterion (Δθ max = 15°∑ −5/6).Reference Palumbo and Aust36
III. RESULTS AND DISCUSSION
A. GBNs after GBE with different initial grain sizes
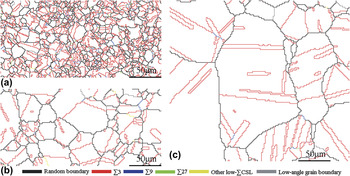
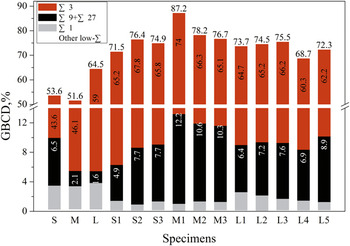
Figure 1, the GBN maps with boundary types, shows the microstructures of three starting state samples with different grain sizes, designated as S (6.6 μm), M (17.1 μm), and L (31.3 μm), respectively. The proportions of low-∑ CSL GBs are 53.6%, 51.6%, and 64.5% by length for samples S, M and L, as shown in Fig. 4. Sample L has the highest ∑3 proportion and the highest total low-∑ CSL GBs proportion. The sum of ∑9 and ∑27 proportion is higher in sample S than that in the other two. However, for all these three microstructures the ∑3 boundaries appear in the shape of straight single line or parallel line pairs, either grain spanning or terminated within a single grain.
The GBNs of starting state samples: (a) sample S, (b) sample M, and (c) sample L. Random boundaries, ∑3, ∑9, ∑27, and other low-∑CSL boundaries, and low-angle grain boundaries (∑1) are black, red, blue, green, yellow and gray respectively. (The same below).

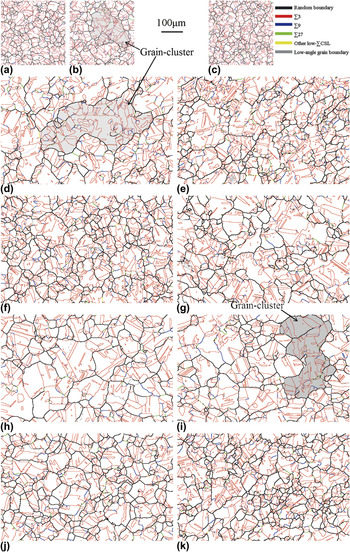
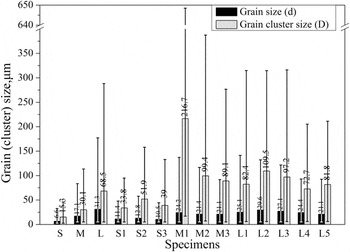
Figure 2 shows the GBNs of samples after GBE-processing, which is a thermomechanical treatment featured by low-strain deformation followed by high-temperature annealing. There are obvious differences in the grain sizes between S2 and M1, L3. The average grain size and distribution for all the samples are shown in Fig. 3. The area with unique orientation was regarded as a grain in the current work, and therefore the annealing twins are included for the purpose of grain size calculation. The average grain size of GBE-processed samples in S-series is obviously smaller than those in M-series and L-series. The grain sizes of GBE-treated samples in M-series and L-series are at the same level. The average grain sizes after GBE-processing are similar among the S-series samples and among the M-series samples respectively regardless of the extent of deformation. But the grain size distributions for all the samples have quite wide fluctuations.
GBN maps of samples after GBE-processing: (a)-(c) S1-S3, (d)-(f) M1-M3, and (g)-(k) L1-L5. Some grain-clusters encircled by random boundaries are highlighted by gray and in figures (b), (d), (i).

The mean sizes of grain and grain-cluster of all specimens.

The grain boundary character distribution (GBCD) of all specimens: ∑1, ∑3, ∑9+∑27 and other low-∑CSL GBs.

The grain boundary character distributions (GBCDs) of all the samples are shown in Fig. 4, including ∑1 (low-angle boundaries, misorientation angle: 2–15°), ∑3, the sum of ∑9 and ∑27, and other low-∑ CSL GBs. There is an evident increasing of the proportion of low-∑ CSL GBs in the samples after strain deformation and annealing processing as compared with the starting samples. The proportion of low-∑ CSL GBs in sample M1 is near 90%. In S-series, the proportions of low-∑ CSL GBs after GBE are around 75% despite the different strains before annealing. The proportions of low-∑ CSL GBs in the M-series decrease obviously with increase of the strain deformations before annealing. No obvious differences are found in the proportion of low-∑ CSL GBs for the samples of L-series except L4. Nearly all of the low-∑ CSL GBs are of ∑3n type, and about 85% of the special boundaries are ∑3 boundaries. The (∑9 + ∑27) fraction is nearly in direct proportion to the ∑3 boundary fraction for all the samples after GBE-processing.
The marked characteristic of the GBN with high proportion of low-∑ CSL GBs after GBE is the formation of large-size gain-clusters.Reference Xia, Zhou and Chen23, Reference Reed, Kumar, Minich and Rudd24, Reference Gertsman and Henager26 As shown in Fig. 2, some grain-clusters highlighted by gray background are encircled by random high-angle GBs. The mean size of grain-clusters and the size spread for each sample are included in Fig. 3. In the size statistics, the border clusters in the OIM map are included because the clusters are very large and only a small number of clusters are wholly included in the EBSD-investigated areas, especially for M-series and L-series. Figures 2 and 3 show that the grain-cluster size is quite inhomogeneous. An extremely large cluster is found in sample M1. The circle equivalent diameter of the cluster is over 600 μm. The mean cluster size of the GBE-treated samples in S-series is less than those in M-series and L-series. The low-∑ CSL GBs fraction is determined not only by the grain-cluster size but also by the grain size.
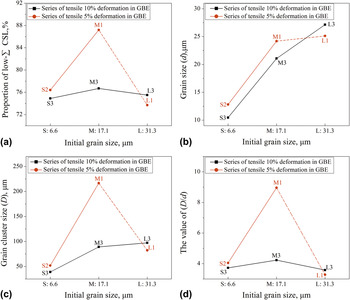
In general, a high proportion of low-∑ CSL GBs is expected for the GBE-processed material. Large grain-cluster associated with large amount of inner connected ∑3n type triple junctions is believed to be the reason for the improved corrosion resistance of GBE-processed material.Reference Xia, Zhou and Chen7, Reference Hu, Xia, Li, Liu, Zhou, Chen and Wang18, Reference Xia, Li, Liu and Zhou37 Small grain size is believed to be beneficial for the mechanical properties. Therefore, the proportion of low-∑ CSL GBs, the grain-cluster size and the grain size are three most significant measures of the GBN. The three parameters determine the characteristics of GBN in the GBE-processed specimens. The plots of the three measures versus the initial grain size are shown in Fig. 5, including low-∑ CSL GBs proportion, grain size (d) and grain-cluster size (D). Two lines are plotted in each map for the samples with different strain deformation amounts during GBE-processing, which are designated as the “series of 5% tensile deformation in GBE” (red lines) and as the “series of 10% tensile deformation in GBE” (black lines) respectively. Because it is observed that only the sample L1 is not fullyrecrystallized, the dashed lines are used to link between “M1” and “L1” instead of solid lines. Figure 5(a) shows that the low-∑ CSL GBs percentage changes dramatically with the initial grain sizes for the samples of “series of 5% tensile deformation in GBE,” but changed slightly for the samples of “series of 10% tensile deformation in GBE.” The grain sizes after GBE-processing increase with the increasing of the initial grain sizes for both of the two series samples as shown in Fig. 5(b). Regarding the dependence of grain-cluster size on the initial grain sizes, the 5% tensile deformation series sample “M1” shows a dramatic increase as compared with that of “S2”; however, in the case of the 10% tensile deformation series, the increase in grain-cluster size is not so large. Figure 5(d) shows the ratio of the grain-cluster size over the grain size, (D/d), as a function of initial grain sizes. In this figure, both of the two series samples show a very similar changing trend with respect to that of Fig. 5(a). This establishes that the parameter (D/d) and low-∑ CSL GBs proportion show a consistent dependence on the initial grain size.
The dependence of GBE microstructures on the initial grain sizes: (a) the proportion of low-∑ CSL GBs, (b) the mean grain size, (c) the mean grain-cluster size, and (d) the ratio of grain-cluster size over grain size, (D/d).

B. Analysis of GBN evolution during GBE using partially recrystallized microstructure
The initial grain size has a significant influence on the GBN after GBE-processing, as shown in Fig. 5. The GBCD data on Fig. 4 revealed that the single-step GBE-processing can increase the proportion of low-∑ CSL GBs to more than 75% irrespective of the initial grain size. However, a microstructure with medium grain size is required for achieving the highest low-∑ CSL GBs proportion. The grain size and grain-cluster size data (Fig. 3) revealed that the GBN after GBE is quite different for the different series samples with different initial grain sizes. The mean sizes of grains and grain-clusters after GBE tend to increase with increase in the initial grain sizes.
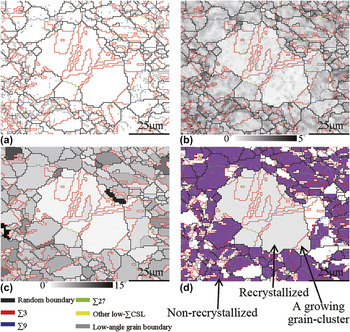
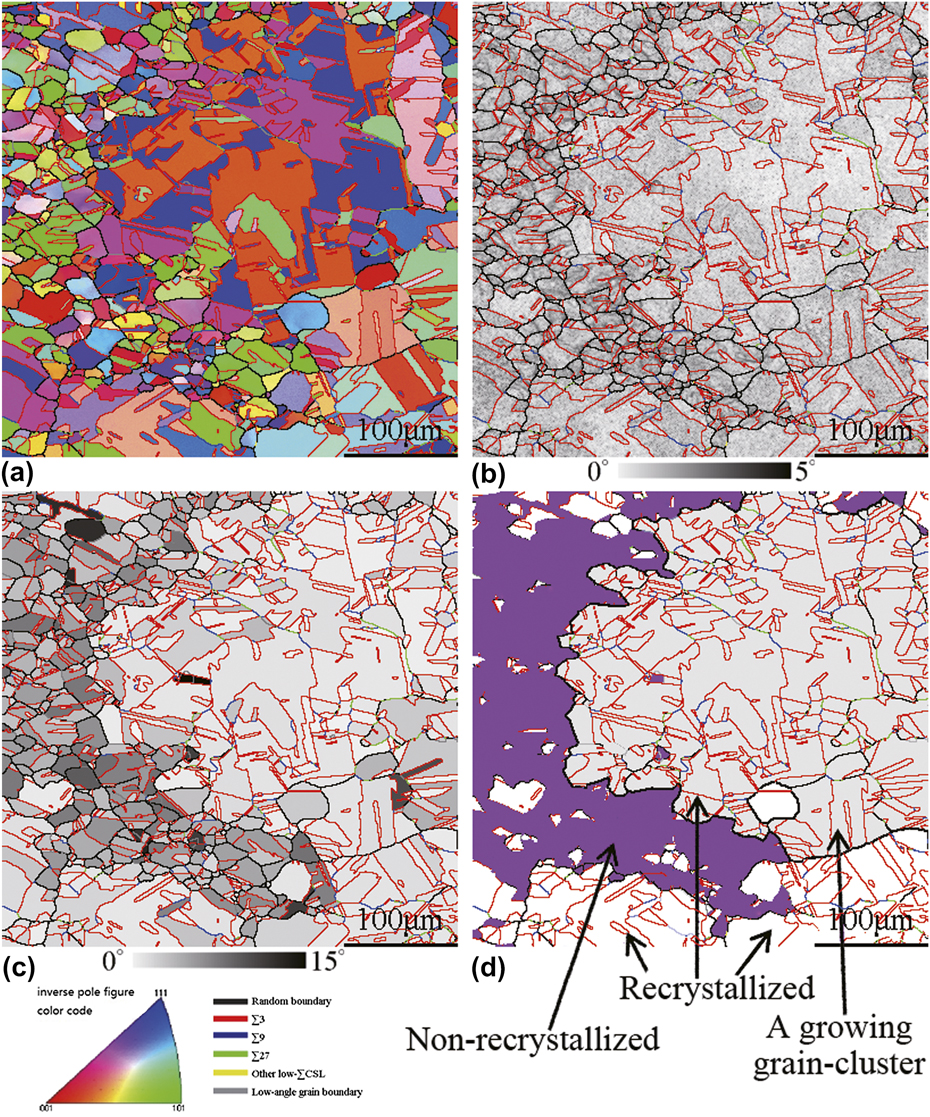
Partially recrystallized specimens were prepared to study the microstructural evolution at the early stage of annealing. Specimen S was annealed 60 s at 1100 °C after 5% tensile deformation, and thus the partially recrystallized specimen S2p was obtained. The crystallographic features of the partially recrystallized microstructure in sample S2p was characterized with different methods by HKL-Channel 5 software, as shown in Fig. 6. Figure 6(a) shows the GBN with different grain boundary types. The gray lines are low-angle boundaries, which is formed during deformation and recovery annealing. The low-angle GB density can be used to distinguish between the recrystallized and the nonrecrystallized regions in the partially recrystallized sample. In Fig. 6(a), the middle region is nearly free of low-angle GBs, but there is a larger amount of such low-angle GBs in the surroundings. This can be used to distinguish the areas between recrystallized and nonrecrystallized microstructures.
The microstructure of partially recrystallized sample S2p is characterized with different methods by HKL/Channel 5: (a) GBN distribution map, (b) GBN distribution map in which the background is shaded according to the local orientation gradient, (c) GBN distribution map in which the background is shaded according to the grain mean misorientation, and (d) recrystallized fraction component map.

Figure 6(b) shows the GBN distribution in which the background is shaded according to the local orientation gradientReference Humphreys, Bate and Hurley38, Reference Field, Trivedi, Wright and Kumar39 (or local misorientation in HKL/Channel 5 software), which is a parameter describing the deformation amount. The orientation imaging microscopy (OIM) map is a grid map in which each grid point corresponds to the crystallographic orientation of that point in the sample. The local orientation gradient is the average misorientation between the analyzed grid point and its adjacent points, which indicates the amount of the local strains. The local orientation gradient is close to zero in the fully recrystallized grains. The recrystallized region (light gray) is surrounded by the nonrecrystallized darker gray region in Fig. 6(b).
In HKL/Channel 5 software, grain mean misorientation is another parameter describing the deformation amount. Grain mean misorientation gives a quantification measurement of the grain's deformation.Reference Humphreys, Bate and Hurley38, Reference Field, Trivedi, Wright and Kumar39 The background of Fig. 6(c) is shaded according to this parameter. The light gray region is recrystallized and surrounded by the nonrecrystallized darker gray region in Fig. 6(c). A critical value of 0.85° for the grain-mean-misorientation was set to distinguish the recrystallized and nonrecrystallized regions in Fig. 6(d). Nonrecrystallized regions were colored purple. The white and gray regions are recrystallized.
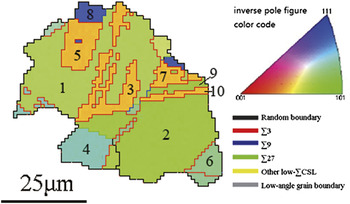
From the analysis above, it is believed that the specimen S2p is partially recrystallized. As shown in Fig. 6, there are recrystallized and nonrecrystallized regions, which are separated by random GBs. A grain-cluster formed in the recrystallized region, that is, the gray region in Fig. 6(d). All GBs are of ∑3, ∑9 or ∑27 types in the cluster, that is, all the inner neighboring grains have ∑3n misorientations. Ten grains are selected in the grain-cluster, as shown in Fig. 7. They have six different orientations, and the mutual misorientations between any two orientations are of ∑3n, as listed in Table II. Therefore, it can be known that all grains inside of the grain-cluster maintain ∑3n mutual misorientations regardless of whether they are adjacent.

Mutual misorientations of the ten grains selected from Fig. 7. (The bottom left data are rotation angle-axis pair: θ, [hkl]; the top right data are the closest CSL ∑-value and deviation: ∑/Δθ).

Note:
Grains are grouped by grain average orientation. Orientation relationship is given in the form: rotation angle and axis in the bottom left of the table, the closest CSL ∑-value/deviation in the top right.
A: 1; B: 2, 9; C: 3, 5, 7, 10; D: 4; E: 6; F: 8
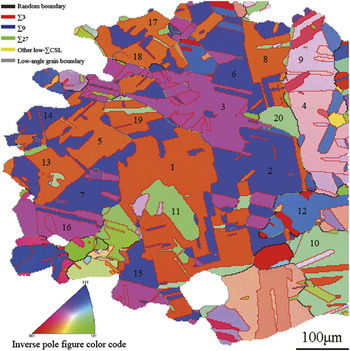
The M–5% tensile deformation –1100 °C/120 s annealing specimen M1p is also characterized with different methods by HKL/Channel 5 software. Orientation distribution map, local misorientation map, grain mean misorientation map and recrystallized fraction component map are shown in Fig. 8. Following the analysis above, it is believed that the sample M1p is also a partially recrystallized sample. A large grain-cluster formed in the recrystallized region, as shown in Fig. 9. Twenty big grains are randomly selected for analysis of the mutual misorientations, which are listed in Table III. The same conclusion can be drawn that any two grains in the grain-cluster have ∑3n misorientations regardless of whether they are adjacent.
The microstructure of partially recrystallized sample M1p is characterized with different methods by HKL/Channel 5: (a) grain orientation map contrasted by color of inverse pole figure, (b) GBN distribution map in which the background is shaded according to the local orientation gradient, (c) GBN distribution map in which the background is shaded according to the grain mean misorientation, and (d) recrystallized fraction component map.


Mutual misorientations of the twenty grains selected from Fig. 9.

Note:
Grains are grouped by grain average orientation. Orientation relationship is given in the form: rotation angle and axis in the bottom left of the table, the closest CSL ∑-value/deviation in the top right.
A: 1, 8,19; B: 2, 6, 7, 14, 15; C: 5, 13, 17, 18; D: 3, 16; E: 4; F: 10, 20; G: 9; H: 11; I: 12
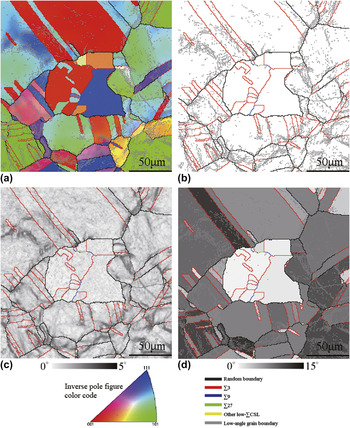
The L–10% tensile deformation −1100 °C/60 s annealing specimen L3p is characterized with different methods by HKL/Channel 5 software, as shown in Fig. 10. It is also a partially recrystallized sample. A small grain-cluster is found in the recrystallized region. All GBs are ∑3, ∑9 or ∑27 misorientation inside of the grain-cluster.
The microstructure of partially recrystallized sample L3p is characterized with different methods by HKL/Channel 5: (a) grain orientation map contrasted by color of inverse pole figure, (b) GBN distribution map, (c) GBN distribution map in which the background is shaded according to the local orientation gradient, and (d) GBN distribution map in which the background is shaded according to the grain mean misorientation.

As shown in Figs. 6, 8, and 10, it is clear that the samples S2p, M1p, and L3p are partially recrystallized samples. On the other hand, GBE microstructures are featured by high proportion of low-∑CSL GBs and large grain-clusters in the fully recrystallized samples S2, M1, and L3. Therefore, the GBE-processing should be a recrystallization process. In the partially recrystallized samples, grain-cluster formed in the recrystallized regions that are surrounded by deformed microstructures. All GBs have ∑3n misorientations inside of these grain-clusters, no matter what the cluster sizes are. It is suggested that the grain-clusters would grow during further annealing by the migration of the GBs between the cluster and the deformed matrix. Therefore, the GBE process is a recrystallization process with the grain-cluster growth starting from a single nucleus. During the nucleus growth, the first, the second and the higher order generation twins were produced sequentially to form a twin-chain. This is the “multiple twinning” processReference Reed and Kumar25, Reference Haasen28–Reference Cayron31. Therefore, any grain in a grain-cluster has a ∑3n misorientation with its mother orientation, that is, the recrystallization nucleus. Therefore a further inference can be got that any two grains in a cluster have ∑3n misorientation regardless of whether they are adjacent.
C. Influence of the initial grain sizes on the GBE microstructures
The initial grain size influences both the grain-cluster size and the grain size. It is evident that a grain boundary network with larger size grain-clusters and smaller size grains are expected to have higher proportion of low-∑ CSL GBs. The ratio of the grain-cluster size over the grain size, (D/d), determined the proportions of low-∑ CSL GBs.
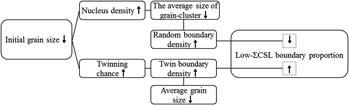
In the GBE microstructures, the random GBs are formed by the impingement of the grain-clusters, and the grain-cluster is formed by multiple twinning starting from a single recrystallization nucleus, as can be seen from the partially recrystallized microstructure. The lower the nucleus density is, the larger the grain-clusters are. The nucleation density decreases with the increasing of original grain size because GBs are the preferential nucleation sites. Hence, the average size of grain-cluster increases with the increasing of initial grain sizes for the samples of “series of 10% tensile deformation in GBE” in Fig. 5(c). However, in the case of the samples of “series of 5% tensile deformation in GBE,” the grain-cluster size first increases and then decreases. This is because the 5% tensile deformation is too low for the large grained sample L1 to induce completed recrystallization during annealing at 1100 °C/5 min. So, except the unrecystallized sample L1, the grain-cluster size increased with the increasing of the initial grain sizes for both series samples. On the other hand, a large initial grain size reduces the twinning frequency because the disorientation of the moving boundary is changing less frequently during recrystallization. The grain size, which can partly represent the size of twins, therefore increases with the increasing of the initial grain sizes.
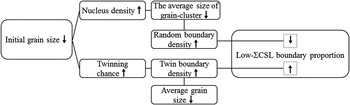
Although both the grain-cluster size and the grain size increase with the increases of the initial grain sizes in the fully recrystallized samples, the proportions of low-∑ CSL GBs do not monotonically increase with the initial grain sizes. For example, the proportions of low-∑ CSL GBs of the “M3” are slightly higher than that of “S3” and “L3,” those of which are belonging to the “series of 10% tensile deformation in GBE,” as shown in Fig. 5(a). This can be attributed to the fact that the initial grain size has a combined effect on the low-∑ CSL GBs proportion, as shown in Fig. 11. Smaller initial grain sizes induce higher density of nucleation sites. The final GBN would have smaller grain-clusters and higher density of random boundaries, which is a disadvantageous factor for the formation of high proportion of low-∑CSL GBs. On the other hand, twinning is easier to occur when the misorientation of the front boundary between the growing grain and the deformed microstructure frequently change in a smaller grained initial microstructure.Reference Fullman and Fisher40–Reference Field, Bradford, Nowell and Lillo44 The sizes of twins are therefore smaller, in other words, higher twin density defined by twin boundary amount per unite area. This is an advantageous factor for the formation of high proportion of low-∑ CSL GBs. Because of this combined effect, neither grain-cluster size nor the twin boundary density is the solely sufficient condition for determining the low-∑ CSL GBs proportion. The low-∑ CSL GBs proportion is proportional to the ratio of the grain-cluster size over the grain size, (D/d), as shown in Fig. 5(d).
Effects of initial grain sizes on GBE microstructures: grain-cluster size, grain size and low-∑ CSL GBs proportion.

The sample series with smaller deformation amount (5%) has higher low-∑ CSL GBs, larger grain-cluster sizes and larger grain sizes than that of the 10% strained samples, the only exception being the unrecrystallized sample L1. This indicated that the smaller deformation used in the GBE-processing results in higher proportion of low-∑ CSL GBs. But, for a material being considered for critical use in certain real and rigorous industrial applications, one cannot only consider the proportion of low-∑ CSL GBs but also should consider the grain size, because the too large grain size will decrease the mechanical properties. Therefore, when using the GBE technique, cares must be taken to make a compromise between the proportion of low-∑ CSL GBs and other microstructure parameters, such as grain size.
IV. CONCLUSIONS
In Alloy 690, GBE-processing, which is featured by low-strain deformation, followed by short-duration annealing at high temperature, can increase the proportion of low-∑ CSL GBs to more than 75%. The initial grain size has a significant influence on the GBN resulting from GBE-processing. The partially recrystallized microstructures showed that the GBE-processing is a recrystallization process, in which each grain-cluster was formed by “multiple twinning” starting from a single recrystallization nucleus. The large grain-clusters and high proportion of low-∑ CSL GBs are the features of GBN after GBE-processing. The initial grain size has a combined influence on the low-∑ CSL GBs proportion. Smaller initial grain sizes induce higher twin boundary density, but smaller grain-cluster and higher random GB density, and vice versa. In the GBE-processed microstructure, neither grain-cluster size nor the twin boundary density is the solely sufficient condition for determining the low-∑ CSL GBs proportion. The ratio of the grain-cluster size over the grain size (D/d) governs the proportion of low-∑ CSL GBs. However, when applying the GBE technique to materials involved in manufacture for real and critical industrial or other applications, a compromise between the proportion of low-∑ CSL GBs and grain size should be considered.
ACKNOWLEDGMENTS
This work was jointly supported by National Science Foundation of China (NSFC) (Grant No. 50974148), Major State Basic Research Development Program of China (Grant No. 2011CB610502), the fund from Jiuli Hi-Tech Metals Co., Ltd., China, and Shanghai Leading Academic Discipline Project (Grant No. S30107).