I. INTRODUCTION
In recent years, high angle annular dark field scanning transmission electron microscopy (HAADF-STEM) imaging method has become a powerful tool in characterizing defect Reference Farokhipoor, Magen, Venkatesan, Iniguez, Daumont, Rubi, Snoeck, Mostovoy, de Graaf, Muller, Doblinger, Scheu and Noheda1,Reference Lubk, Rossell, Seidel, Chu, Ramesh, Hytch and Snoeck2 and interface structures of materials Reference Ohtomo, Muller, Grazul and Hwang3,Reference Lee, Christen, Chisholm, Rouleau and Lowndes4 due to the fact that its contrast depends highly on atomic number Z in a form of Z n (n = 1.6–1.9), Reference Hartel, Rose and Dinges5 which makes it easy to distinguish different atomic columns. Advances in aberration-corrected (S)TEM provide high-resolution HAADF-STEM imaging with more opportunities in identifying novel structures owing to its insensitivity to electron beam irradiation and ability to image a large area without contrast inversion. Reference Nellist, Chisholm, Dellby, Krivanek, Murfitt, Szilagyi, Lupini, Borisevich, Sides and Pennycook6,Reference Tang, Zhu, Ma, Borisevich, Morozovska, Eliseev, Wang, Wang, Xu, Zhang and Pennycook7 Particularly, the recently developed bright field (BF) and annular bright field (ABF) STEM imaging make it possible to image light atoms such as O and H. Reference Tang, Zhu, Ma, Borisevich, Morozovska, Eliseev, Wang, Wang, Xu, Zhang and Pennycook7–Reference Ishikawa, Okunishi, Sawada, Kondo, Hosokawa and Abe9 However, under STEM imaging condition, specimen deviation slightly from crystal zone axis is a main but unavoidable factor that will impact on the quality of high resolution images. For example, previous studies indicated that crystal deviating slightly from zone axis will result in remarkable contrast reduction, Reference Maccagnano-Zacher, Mkhoyan, Kirkland and Silcox10–Reference Wu, Robertson, Kawasaki and Baribeau13 especially, the relative image spot positions of different atomic columns were identified to change under HAADF- and ABF-STEM imaging mode due to the electron beam propagation in the crystal is modified when crystal tilt. Reference So and Kimoto14,Reference Zhou, Caspary, Sigle, Krause, Rosenauer and Aken15 In contrast, one study proposed that small crystal tilt will not cause relative image spots position change in a Si dumbbell structure under HAADF imaging mode. Reference Yamazaki, Kawasaki, Watanabe, Hashimoto and Shiojiri16 Therefore the atomic number depending effects of crystal tilt is still a problem which should be further explored. On the other hand, previous studies have revealed crystal tilt effects on HAADF and ABF imaging mode, Reference So and Kimoto14,Reference Zhou, Caspary, Sigle, Krause, Rosenauer and Aken15 while how the crystal tilt will affect BF imaging mode has not been involved yet. In addition, previous works focused mostly on high symmetric crystal, such as cubic SrTiO3 [100] and ZrO2 [100]. Reference So and Kimoto14,Reference Zhou, Caspary, Sigle, Krause, Rosenauer and Aken15 However, for a noncentral symmetric crystal, a dedicate investigation has never been conducted, especially for materials in which small deviations from the symmetry of atom positions allow them to store charge, information, or energy. One of such materials is ferroelectrics.
Ferroelectrics such as PbTiO3 (PTO), Pb(Zr x Ti1−x )O3 (PZT), BiFeO3, and YMnO3 etc. have attracted great attention due to their significance in theoretical research and applications in electronic device. Reference Dawber, Rabe and Scott17–Reference Chen, Wang, Ringer and Liao20 Microstructures in ferroelectrics such as electron dipole, which is determined directly by the relative positions of different ion columns, play significant roles in determining their ferroelectric properties. However, such structure can hardly be investigated by conventional (S)TEM directly due to its limited resolution and lens aberration. Advances in aberration corrected (Scanning) transmission electron microscope, whose resolution has reached sub-angstrom scale, Reference Haider, Uhlemann, Schwan, Rose, Kabius and Urban21,Reference Batson, Dellby and Krivanek22 make it possible to investigate these microstructures in detail. In previous reports, it is demonstrated that the displacements of Ti (Zr) or O can be used to determine the direction and magnitude of spontaneous polarization in PTO (or PZT), Reference Tang, Zhu, Ma, Borisevich, Morozovska, Eliseev, Wang, Wang, Xu, Zhang and Pennycook7,Reference Jia, Urban, Alexe, Hesse and Vrejoiu19,Reference Jia, Mi, Urban, Vrejoiu, Alexe and Hesse23–Reference Koch25 so a study on how crystal tilt will affects the determination of the positions of these ions in STEM images and how to reasonably determine these ion displacement will be of crucial importance for studying ferroelectric materials at the atomic scale.
In this work, taking tetragonal PTO as an example, the effects of small crystal tilt on the relative image spot positions of different ion columns (Pb, Ti, and O) for HAADF/BF-STEM imaging are studied. Great change of their relative positions has been identified. The effects increase gradually as PTO tilts away from exact zone axis by degrees. Moreover, it is found that the influence of crystal tilt is closely related to the PTO thickness. For less than 20 unit cells thick PTO, the ion positions deviate rapidly from nominal positions; when PTO reaches 25 unit cells thick, the variation becomes stable (HAADF imaging). The difference in atomic number is supposed to be a main contributor to the relative image spot positions change for HAADF imaging. Under BF imaging mode, it is discovered that the Ti deviation direction (δTi) is opposite to those of the O1 and O2 (δO1 and δO2). Effects of crystal tilt on the determination of the relative positions of different ions under both HAADF- and BF-STEM imaging mode have been proved experimentally.
II. EXPERIMENT
For this study, BF/HAADF-STEM image simulations were conducted employing QSTEM software based on frozen phonon multislice methods. Reference Nelson, Winchester, Zhang, Kim, Melville, Adamo, Folkman, Baek, Eom, Schlom, Chen and Pan24 To make our simulation results guided for the structural investigation using aberration corrected STEM, the parameters used in the simulations were set according to the experiment condition and shown as follows: 300 kV acceleration voltage; spherical aberration C s = 0 nm; convergence angle α = 21.4 mrad; defocus Δf = 0 nm; source size of 0.8 Å; and chromatic aberration C c = 1 mm. Images were calculated using 0–10 mrad and 50–250 mrad inner and outer angles for BF-STEM and HAADF-STEM detector, respectively.
The experimental images of PTO were taken from 80 nm PTO film grown on SrTiO3 (001) substrate by pulsed laser deposition technique. The HAADF-STEM images shown in this study were recorded by FEI cubed Titan G2 60-300 (FEI Company, Eindhoven, The Netherlands), whose resolution is 0.8 Å under STEM mode.
The positions of atomic columns from both experimental and simulated images were determined precisely by fitting them as 2D Gaussian peaks using Matlab software. Reference Jia, Mi, Urban, Vrejoiu, Alexe and Hesse23,Reference Anthony and Granick26
III. RESULTS
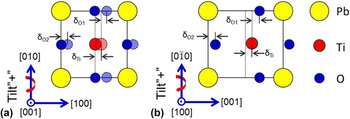
In this work, [001] and [100] zone axes HAADF/BF-STEM images of PTO were simulated, the relative image spots positions variation of Pb, Ti, and O with PTO tilting away from exact zone axis were summarized. PTO exhibits tetragonal symmetry, with lattice parameter a = b = 3.899 Å, c = 4.153 Å. Both oxygen octahedron and Ti have displacements from the center of Pb tetragonal lattice, which give rise to a spontaneous polarization along [001]. Figures 1(a) and 1(b) show schematically the projection of PTO unit cell along [001] and [100] directions. In the schematics, red circles denote Ti, yellow circles denote Pb, and blue circles denote O, respectively. δTi, δO1, and δO2 indicate the Ti displacement vector with respect to mass center of its four nearest Pb, O1 displacement vector with respect to Ti and O2 displacement vector with respect to Pb, as illustrated in Fig. 1. The positive crystal tilt directions are defined as indicated by red arrows.
Schematics of PbTiO3 along (a) [001] and (b) [100] zone axes. Yellow, Pb; red, Ti; blue, O. The positive crystal tilt directions are defined by red arrows. δTi, δO1, and δO2 are defined as shown in the schematics.

A. HAADF-STEM images simulation
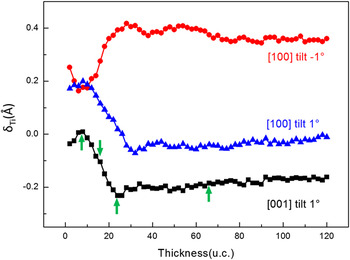
Under HAADF-STEM imaging mode, only Pb and Ti can be observed, so Ti displacement vector with respect to Pb (δTi) was extracted. HAADF images of 0–120 unit cells thick PTO when it is tilted away from [001] zone axis of 1°, tilted away from [100] zone axis of 1° and −1° were simulated first (not shown here). δTi curves extracted from these images are shown in Fig. 2. These curves suggest that crystal tilt does affect the relative positions (HAADF-STEM image) of different ions columns, and the effects depend highly on the PTO thickness. For PTO of less than 10 unit cells thick, 1° tilt has slight effects on the relative image spots positions of Pb and Ti: δTi tends to be zero and 0.2 Å for [001] and [100] oriented PTO, which is in agreement with its crystal structure; when the thickness of PTO increases, the effects of crystal tilt become significant: δTi decreases from 0 to −0.2 Å for 1° tilted [001] oriented PTO, while decreases from 0.2 Å to 0 and increases from 0.2 Å to about 0.4 Å for 1° and −1° tilted [100] oriented PTO, respectively. It is noted that when the thickness of PTO exceeds 25 unit cells, δTi tends to be stable for all three cases. Considering about the tendency of δTi variation with thickness, four representative thicknesses: 8, 16, 24, and 66 unit cells (indicated by green arrows) were chosen to study the relationships of δTi (extracted from STEM images), PTO thickness and tilt angles.
δTi curves as a function of PbTiO3 thickness when PbTiO3 is tilted 1° away from [001] zone axis; 1° and −1° away from PbTiO3 [100] zone axis under HAADF-STEM imaging mode. Green arrows indicate four representative thickness values chosen to study δTi trend as a function of PbTiO3 tilt angles.

1. PTO [001] zone axis
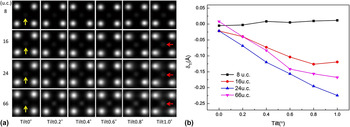
Figure 3(a) shows an array of simulated HAADF-STEM images of 8, 16, 24, and 66 unit cells thick PTO and tilting away from [001] zone axis of 0–1°. PTO was tilted positively around [010] as shown in Fig. 1(a). From Fig. 3(a), it is found that when PTO oriented exactly along [001] zone axis, Ti lies in the center of its four nearest Pb as indicated by yellow arrows. As PTO tilts away from [001] crystallographic direction, Ti displacements (simulated image) are not obvious for 8 unit cells thick PTO; while for 16, 24, and 66 unit cells thick PTO, Ti is off-centered and shift to the left, this phenomena is particularly significant when it is tilted 1° as indicated by red arrows. Figure 3(b) shows the corresponding δTi curves as a function of tilt angles, which give a precise value of δTi. It can be identified that when PTO is tilted 0–1°, δTi changes little for 8 unit cells PTO; as the thickness of PTO increases to 16 unit cells, δTi decreases obviously from 0 to −0.12 Å; Further increasing the thickness to 24 unit cells, δTi deceases dramatically from 0 to −0.22 Å; for 66 unit cells PTO, δTi variation shows similar tendency to 24 unit cells thick PTO besides a little smaller absolute value of δTi. These trends are consistent with δTi curve as a function of thickness when PTO is tilted 1° as shown in Fig. 2 (black curves for PTO [001]), which indicates that with the thickness of PTO increasing, δTi decreases to a smallest value and then increases a little.
(a) Simulated HAADF-STEM images along PbTiO3 [001] at different tilts and specimen thicknesses. Yellow arrows indicate Ti which lie in the center of four nearest Pb; red arrows indicate Ti which shift to the left compared to not tilted PTO. (b) δTi curves as a function of PbTiO3 tilt angles for 8, 16, 24, and 66 unit cells PbTiO3.

2. PTO [100] zone axis
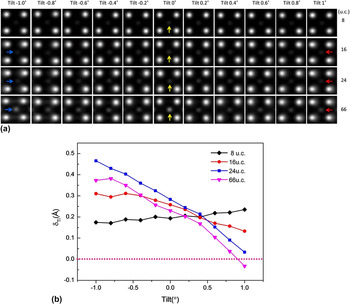
Figure 4(a) shows simulated HAADF-STEM images of 8, 16, 24, and 66 unit cells thick PTO and tilting away from [100] zone axis of −1 to 1°. In this crystal zone axis, spontaneous polarization (P s) which is opposite to the direction of δTi can be identified if the sample orients exactly along [100] zone axis, as indicated by yellow arrows in Fig. 4(a). Effects of crystal tilt depending highly on PTO thickness were also recognized. When PTO is tilted −1° to 1°, no obvious Ti shifts can be identified for 8 unit cells PTO; as the thickness of PTO increasing to 16, 24, and 66 unit cells, Ti shifts increasing can be observed evidently as PTO tilts gradually away from [100]: when PTO is positively tilted, the position of Ti shifts to the left (compared to not tilted PTO), this can be perceived clearly from 1° tilted PTO as indicated by red arrows; as PTO is negatively tilted, the position of Ti shifts to the right, which can be identified from −1° tilted PTO as indicated by blue arrows. Figure 4(b) shows the corresponding δTi curves as a function of tilt angles for 8, 16, 24, and 66 unit cells thick PTO. Similar to [001] oriented PTO, when PTO is tilted from −1° to 1°, δTi keeps nearly constant for 8 unit cells PTO; with the thickness of PTO increasing to 16 unit cells, δTi decreases obviously from 0.3 Å to about 0.15 Å; as the thickness of PTO reaching 24 unit cells, δTi goes down rapidly from 0.47 Å to 0.03 Å; for 66 unit cells PTO, δTi declines similarly and from 0.4 Å even to zero below, which means that HAADF-STEM images may give the fake information of relative positions of Pb and Ti, and thus polarization directions, when tilting above 0.8° away from [100] PTO.
(a) Simulated HAADF-STEM images along PbTiO3 [100] at different tilts and specimen thicknesses. The blue, red arrows indicate Ti displacement direction compared to not tilted PTO (indicated by yellow arrows). (b) δTi curves as a function of PbTiO3 tilt angles for 8, 16, 24, and 66 unit cells thick PbTiO3.

From the discussion shown above, it is concluded that crystal tilt does affect the relative image spots positions of Pb and Ti, and the influence depends highly on specimen thickness. For PTO of less than 10 unit cells thick, the effects of crystal tilt is small; increasing the thickness from 10 to 20 unit cells, the effects increase rapidly; when PTO reaches 25 unit cells thick, the effects become stable. Moreover, for [100] oriented PTO, when PTO is tilted about 1°, δTi may become even minus, implying that the determination of ion displacements simply from HAADF-STEM image is not much convincing under this circumstance.
3. Atomic number Z: an important factor that influences the relative positions of different ions when crystal is tilted under HAADF-STEM imaging mode
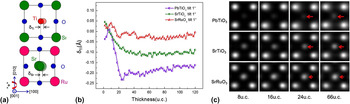
In our experiment, it was found that the atomic number difference is an important factor that influences the relative positions of different ion columns when the crystal tilts. Here, besides PTO (the atomic numbers of Pb and Ti are 82 and 22, respectively), HAADF-STEM images of SrTiO3 (the atomic numbers of Sr and Ti are 38 and 22, respectively) and SrRuO3 (the atomic numbers of Sr and Ru are 38 and 44, respectively) were also simulated for comparison. SrTiO3 has a cubic perovskite structure with lattice parameters a = 3.905 Å; Sr locate at the corner of the cubic unit cell, Ti lies in the body center and O lie in the face center of Sr lattice; while SrRuO3 has an orthorhombic structure which can also be viewed as a pseudo cubic perovskite crystal structure, and the pseudo cubic lattice parameter is a pc = 3.92 Å. The projected schematics of SrTiO3 and SrRuO3 along (pseudo) cubic [001] zone axis are shown in Fig. 5(a). For [001] oriented SrTiO3, Ti lies in the center of four Sr; while for SrRuO3, the mass center of Sr lies in the center of four Ru. Figure 5(b) shows δTi (PTO), δTi (SrTiO3), and δSr (SrRuO3) curves as a function of thickness when the samples tilt 1°. From these curves, it can be figured out that when the thicknesses are more than 10 unit cells, the ion displacements follow the rules: δTi (PTO) > δTi (SrTiO3) > δSr (SrRuO3). Beyond 10 unit cells, the three δ behave quite differently. The curve for SRO first goes up a little, then goes down, and finally keeps nearly unchanged. For STO, the curve goes down obviously and then keeps constant. In contrast, the curve for PTO drops dramatically with the minimum around minus 0.25 at the thickness of around 24 unit cells, and then fluctuates a little. HAADF-STEM images for 4 typical thicknesses of 8, 16, 24, 66, unit cells of PTO, SrTiO3, and SrRuO3 are shown in Fig. 5(c). From these images, it can be recognized that for thin PTO, SrTiO3, and SrRuO3, the displacements are not obvious (8 unit cells); when they get thicker, such as more than 24 unit cells, the effect of crystal tilt becomes apparent. Moreover, it is discovered that when the atomic number difference between two elements is larger, the effect of crystal tilt is greater. This is supposed to be induced by the difference in scattering strength of different atoms with respect to thermal diffuse scattering (TDS), because a lighter atom is a less efficient scatter than a heavy atom which results in more electrons channeling to the adjacent atomic columns when crystal tilt. Reference So and Kimoto14
(a) Projected schematics of SrTiO3 and SrRuO3 along (pseudo) cubic [001] zone axis. (b) δTi (PbTiO3), δTi (SrTiO3) and δSr (SrRuO3) curves as a function of PbTiO3, SrTiO3, and SrRuO3 thickness when they tilt away from (pseudo) cubic [001] zone axis of 1°. (c) Simulated HAADF-STEM images of 8, 16, 24 and 66 unit cells thick PbTiO3, SrTiO3 and SrRuO3 when they tilt away from [001] zone axis of 1°. Red arrows indicate the direction of Ti (PbTiO3), Ti (SrTiO3), Sr (SrRuO3) displacement direction and magnitude. The longer arrows indicate larger displacement values.

4. Experimental verification of the influence of crystal tilts on the relative positions determination of Pb and Ti under HAADF-STEM imaging mode
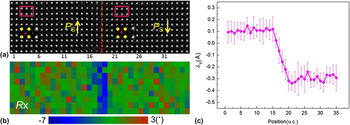
To prove the effects of crystal tilt on the relative image spots positions of Pb and Ti under HAADF imaging mode, aberration corrected STEM observation was conducted. Figure 6(a) shows a HAADF-STEM image taken from an area including 180° domain wall. In this area, PTO is about 25 nm thick (∼64 unit cells) and deviates from [100] of about 0.6°. Figure 6(b) shows the corresponding in-plane lattice (Pb) rotation map. A valley value of lattice rotation (the blue area) found in (b) denotes the position of the 180° domain wall. In the left part of this image, P s is upward, while in the right part, P s is downward. δTi profile extracted from Fig. 6(a) is given in Fig. 6(c). It shows that δTi keeps at 0.1 Å with small deviations in the left part while it fluctuates around about −0.3 Å in the right part. These results do not exhibit the characteristic of 180° domain wall correctly, because in two sides of 180° domain wall, P s is supposed to be equal in size, and opposite in direction. This phenomenon is perceived to be caused by PTO tilt and is consistent with our simulations shown in Fig. 4, which indicate that for 66 unit cells PTO, when it tilts 0.6° from away [100], δTi decreases to 0.1 Å; when PTO tilts −0.6° from away [100], δTi increases to 0.35 Å. A little difference in δTi value might result from the small discrepancy between simulation and experimental condition, such as the difference in sample thickness, tilt angles and (S)TEM condition.
(a) A HAADF-STEM image taken from PTO [100] with the sample thickness of about 25 nm, deviating from exactly zone axis of about 0.6°. Red dotted line indicates a 180° domain wall. Yellow arrows indicate polarization directions of PbTiO3 in each area. The enlarged HAADF-STEM images are from rectangular areas. (b) In-plane lattice rotation mapping of (a). A valley value of lattice rotation (blue area) shows the position of 180° domain wall. (c) δTi curves extracted from image (a) and obtained by averaging all rows.

B. BF-STEM images simulation
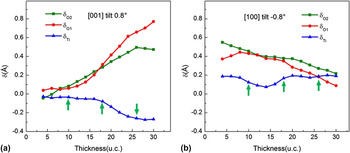
Under BF-STEM imaging mode, besides Pb and Ti, O can also be observed. To judge the effects of crystal tilt on the positions of O, BF-STEM images of 0–30 unit cells thick PTO, tilts away from [001] zone axis of 0.8°, tilts away from [100] zone axis of −0.8° were simulated first (not shown here). δTi, δO1, and δO2 curves extracted from these images as a function of PTO thickness are shown in Figs. 7(a) and 7(b), respectively. From these curves, it can be concluded that the effects of crystal tilt on the relative image spot positions of different ions under BF-STEM imaging mode rely heavily on sample thickness, too. Increasing the thickness of PTO from 4 to 30 unit cells, δTi goes down and δO1, δO2 go up obviously from near zero for 0.8° tilted [001] oriented PTO (for not tilted [001] PTO, δTi, δO1, and δO2 are supposed to be zero); while δTi changes small and δO1, δO2 decrease evidently for −0.8° tilted [100] oriented PTO. Considering about the changing trend of δTi, δO1, and δO2 with thickness, three representative thicknesses value: 10, 18, and 26 unit cells (as indicated by green arrows) were selected to investigate δTi, δO1, and δO2 variations with PTO tilting away from [001] and [100] zone axis.
δTi, δO1, and δO2 curves as a function of PbTiO3 thickness when it is tilted (a) 0.8° away from [001] zone axis and (b) tilted −0.8° away from [100] zone axis under BF-STEM imaging mode. Green arrows indicate three representative thickness values used to study the δTi, δO1, and δO2 variation versus tilt angles.

1. PTO [001] zone axis
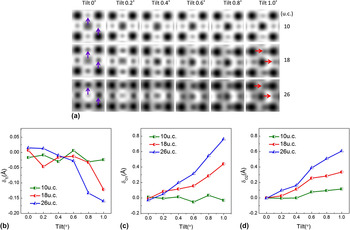
Figure 8 shows the simulated BF-STEM images (a) and the corresponding δTi [Fig. 8(b)], δO1 [Fig. 8(c)] and δO2 [Fig. 8(d)] curves for 10, 18, and 26 unit cells thick PTO, upon tilting 0–1° away from [001] zone axis. BF-STEM images of not tilted PTO show that Ti lies in the center of four Pb; while O1, in the middle of two horizontal Pb; O2 lies in the center of two vertical Pb (O1 and O2 positions are indicated by purple arrows). These are consistent with PTO [001] projections. Deviate the sample 0–1° away from [001] axis around [100] [schematically shown in Fig. 1(a)], no obvious shifts of O1 and O2 can be distinguished in BF images for 10 unit cells thick PTO; however their left shift can be clearly observed for 18 and 24 unit cells thick PTO, especially when its tilt angle reach 1°, as indicated by red arrows. Nevertheless, Ti displacement can hardly be identified for all thicknesses under BF-STEM imaging mode. To see the tendency clearly, δTi, δO1, and δO2 curves as a function of PTO tilt angles were extracted from BF-STEM images which are shown in Figs. 8(b)–8(d). From these curves, it can be perceived that δTi decreases slightly, while δO1 and δO2 increase obviously as PTO tilts away from [001] zone axis. Moreover, δTi, δO1, and δO2 depend largely on PTO thickness are further verified: for 10 unit cells PTO, δTi, δO1, and δO2 are near zero and no clear variations can be found as PTO tilting away from [001] zone axis; for 18 unit cells PTO, δTi goes down and δO1, δO2 go up apparently; for 26 unit cells PTO, similar trend goes further.
(a) Simulated BF-STEM images near PbTiO3 [001] zone axis at different tilts and different specimen thicknesses. Purple arrows indicate O1 and O2 positions when PTO orient exactly along [001]. In such circumstance O1 lies in the center of two horizontal Pb; O2 lies in the center of two vertical Pb. Red arrows indicate that both O1 and O2 shift to the right (compared to not tilted PTO) when PTO tilts away from [001] zone axis. (b) δTi, (c) δO1, and (d) δO2 curves as a function of PbTiO3 tilt angles for 10, 18, and 26 unit cells thick PbTiO3.

2. PTO [100] zone axis
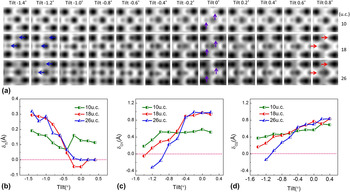
Figure 9 shows the simulated BF-STEM images (a) and the corresponding δTi (b), δO1 (c) and δO2 (d) curves extracted from these BF images for 10, 18, and 26 unit cells thick PTO, upon tilting −1.4° to 0.8° away from [100] zone axis. The relative image spots positions of Pb, Ti, O1, and O2 for exactly [100] oriented BF-STEM images of PTO are also consistent with its projection structure: Ti lies in the right side of four Pb center; O1, in the right side of the horizontal coordinate of Ti; O2 lies in the right side of the horizontal coordinate of two vertical Pb. O1 and O2 positions of not tilted PTO are indicated by purple arrows. From Fig. 9(a), it can be realized that, −1.4° to 0.8° tilt of PTO cause no apparent shifts of O1 and O2 for 10 unit cells thick PTO. With the thicknesses of PTO increasing to 18 unit cells, O1 and O2 shift gradually to the right when PTO tilt positively from 0 to 0.8°; while they shift to the left evidently when PTO tilt negatively from 0 to −1.4°. As the thickness of PTO reach 26 unit cells, O1 and O2 shifts become more remarkable when PTO tilts. The leftwards shifts of O1 and O2 are denoted by navy blue arrows while the rightwards shifts of O1 and O2 are denoted by red arrows. Just like PTO [001], Ti shifts can hardly be determined directly from [100] BF-STEM images either. δTi, δO1, and δO2 curves as a function of PTO tilt angles shown in Figs. 9(b)–9(d) help understand the variation more exactly. From these curves, it can be recognized that, as PTO tilts −1.4° to 0.4° away from [100] zone axis, δO1 and δO2 increase and δTi decreases at different rates for PTO of different thicknesses. For 10 unit cells thick PTO, δTi decrease, δO1 and δO2 increase a little with PTO tilting away from [100] zone axis (green lines). As the thicknesses of PTO increase to 18 unit cells, δO1 and δO2 increase and δTi decreases significantly (red lines). For 26 unit cells thick PTO, δO1 and δO2 increase even faster, while δTi decreases also rapidly compared to 18 unit cells PTO (navy blue lines).
(a) Simulated BF-STEM images of PbTiO3 [100] at different tilts and different specimen thicknesses. Purple arrows indicate O1 and O2 positions when PTO does not tilt; blue and red arrows denote their shifts toward left and toward right, respectively. (b) δTi, (c) δO1, and (d) δO2 curves as a function of PbTiO3 tilt angles for 10, 18, and 26 unit cells thick PbTiO3.

3. Experimental verification of the influence of crystal tilt on the relative image spots positions of Pb, Ti, and O under BF-STEM imaging mode
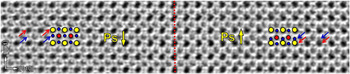
To verify the effects of crystal tilt on the image spots positions of O, BF-STEM observation was conducted. Figure 10 shows a BF-STEM image taken from an area including 180° domain wall (indicated by red dashed line). The thickness of sample is about 10–15 nm, deviating [100] of ∼0.4°. From this image, it can be observed that the positions of O (as indicated by navy blue arrows) are not symmetric. In the left side, the distance between O (indicated by navy blue arrows) and the upside Pb (indicated by red arrows) is larger than the distance between O (indicated by navy blue arrows) and the downside Pb (indicated by red arrows) in the right side. The asymmetrical O position does not manifest the feature of 180° domain wall exactly. This phenomenon is supposed to be caused by PTO tilt and is consistent with our PTO [100] BF-STEM simulation result.
A BF-STEM image shows the relative position of Pb, Ti, and O in both sides of 180° domain wall. Red dashed line indicates 180° domain wall. Yellow circles denote Pb; red circles denote Ti; navy blue circles denote O. Red arrows indicate the positions of Pb; navy blue arrows indicate the positions of O.

BF-STEM images simulation of [001] and [100] oriented PTO indicate that, as PTO tilts away from [001] and [100] zone axis gradually, image spots positions of Ti, O1, and O2 deviate from the original positions more or less. Moreover, the effects of crystal tilt on the determination of relative positions of Pb, Ti, and O depend highly on the PTO thickness. In general, for thicker PTO, the impacts of crystal tilt are greater. Such as for 26 unit cells PTO, δO1 and δO2 increase faster compared to 18 and 10 unit cells thick PTO. For 18 and 26 unit cells PTO, δTi decrease more remarkable than 10 unit cells thick PTO. In addition, though both heavy elements such as Pb and Ti and light element such as O can be imaged for BF-STEM imaging, it may give fake information of relative positions of Pb, Ti, and O when PTO tilts.
IV. DISCUSSIONS
The results shown above indicate that crystal tilt has great impacts on the determination of the atomic columns positions, because electron channeling of incident probe is modified when crystal tilts slightly away from a zone axis. Reference So and Kimoto14 When PTO tilts beyond 0.8°, both HAADF and BF-STEM images of [100] oriented PTO may give the fake information of ion displacements, which relate directly to the judging of ferroelectric polarization direction. So, whether these HAADF/BF-STEM images are useless when determining the ions relative positions? Actually, if special attention is paid, it is not difficult to judge the ion displacements direction of PTO. Here we suggest some tips which will help. First, Ronchigram shadow map is a good reference in detecting crystal tilt. From the map, magnitude of crystal tilt could be measured. Next, images themselves give the information of crystal tilt. It has been proved that small crystal tilt will result in remarkable contrast reduction and atomic column trailing. Reference Maccagnano-Zacher, Mkhoyan, Kirkland and Silcox10 Finally, ions displacements can be judged by some definite characteristics, such as 180° domain walls in PTO, as shown in Figs. 6 and 10. Such a 180° domain wall can be detected by the sudden jump of lattice rotation [as shown in Fig. 6(b)]. Reference Tang, Zhu, Ma, Borisevich, Morozovska, Eliseev, Wang, Wang, Xu, Zhang and Pennycook7,Reference Meyer and Vanderbilt27,Reference Tang, Zhu and Ma28 In both sides of a 180° domain wall, though δTi is not symmetric, the remarkable difference of δTi [as shown in Figs. 6(c) and 6(d)] could provide useful information to judge polarization directions and estimate the probable angles of crystal tilt.
V. CONCLUSIONS
In this work, to investigate the effects of crystal tilt on the determination of the relative positions of Pb, Ti, and O in PTO, HAADF/BF-STEM images were simulated when it tilts away from [001] and [100] zone axes slightly. The results indicate that the effects depend highly on the PTO thickness. When PTO is less than 25 unit cells thick, crystal tilt will modify the image spot positions of different ions dramatically (under BF/HAADF-STEM imaging mode). When PTO thickness exceeds 25 unit cells, the values become stable (under HAADF-STEM imaging mode). Moreover, as PTO tilts gradually away from exactly zone axes, the relative positions of Pb, Ti, O (extracted from STEM image) vary and the deviation values increase by degree. When PTO tilts below 0.8° away from [100], judging polarization directions through the relative positions in BF/HAADF-STEM images is feasible. In addition, simulations on [001] oriented PTO, SrTiO3, and SrRuO3 suggest that the difference in atomic number Z accounts greatly for the effects of crystal tilt on their relative positions under HAADF-STEM imaging mode. The dedicate investigation of the effects of crystal tilt on the determination of ions displacement in perovskite oxides, especially ferroelectrics PTO, contribute greatly to the studying of ferroelectric material and the ferroelectric related theory using aberration corrected STEM.
ACKNOWLEDGMENTS
This work is supported by the National Natural Science Foundation of China (Nos. 51231007, 51571197, 51501194, 51671194 and 51521091), National Basic Research Program of China (2014CB921002), and Chinese Academy of Sciences (QYZDJ-SSW-JSC010). Y.L. Tang gratefully acknowledges the IMR SYNL-T.S. Kê Research Fellowship and the Youth Innovation Promotion Association CAS (No. 2016177).