Nomenclature
- ADEPT
-
Adaptive Deployable Entry and Placement Technology
- AoA
-
angle-of-attack
- CFD
-
computational fluid dynamics
- CG
-
centre of gravity
-
 ${c_d}$
-
drag
-
${c_A}$
-
axis force coefficient
-
${c_N}$
-
normal force coefficient
-
${c_m}$
-
pitching moment coefficients
- EDL
-
entry, descent and landing
- IAD
-
inflatable aerodynamic decelerator
- IRVE
-
inflatable reentry vehicle experiment
- Ma
-
Mach number
- MDAD
-
mechanically deployable aerodynamic decelerator
- PLC
-
parachute-like configuration
- SCC
-
sphere cone configuration
- TPS
-
thermal protection system


1.0 Introduction
With the development of the aerospace industry, the reusable launch vehicle has become one of the important goals [Reference Goyal, Wongchote and Strizzi1, Reference Kim, Lee and Roh2]. However, the traditional entry, descent and landing (EDL) technology cannot meet the requirements. Researchers have developed various novel recycling technologies [Reference Zang, Dwyer-Cianciolo, Kinney, Howar, Chen and Ivanov3, Reference Zuppardi and Mongelluzzo4]. Among them, the deployable aerodynamic decelerator stands out due to its excellent deceleration performance and thermal protection system (TPS). There are two types of aerodynamic decelerators based on the deployment method: inflatable aerodynamic decelerator (IAD) [Reference Finchenko, Ivankov, Golomazov and Shmatov5] and mechanically deployable aerodynamic decelerator (MDAD) [Reference Cruz and Green6]. A typical MDAD proposed for reentry into Venus and Mars is the Adaptive Deployable Entry and Placement Technology (ADEPT) [Reference Bose, Winski, Shidner, Zumwalt, Johnston, Komar, Cheatwood and Hughes7, Reference Venkatapathy, Hamm, Fernandez, Arnold, Kinney, Laub, Makino, McGuire, Peterson, Prabhu, Empey, Dupzyk, Huynh, Hajela, Gage, Howard and Andrews8]. IAD expands the flexible aerodynamic surface through external or internal inflation. It can cause aerodynamic deformation and affect the aerodynamic and aerothermodynamic characteristics, such as increased pressure in valleys with decreased heat flux [Reference Guo, Lin, Bu, Fu and Chao9–Reference Zhao, Yan, Liu and Qin11]. ADEPT can effectively suppress aerodynamic elasticity by utilising the rigid mechanical structure [Reference Dutta, Karlgaard, Korzun, Green, Tynis, Williams, Yount, Cassell and Wercinski12].
Both types of aerodynamic decelerators mentioned above exhibit excellent performance in the hypersonic and supersonic regions. However, their deceleration capabilities are not as good as a parachute in the subsonic region [Reference Smith, Tanner, Mahzari, Clark, Braun and Cheatwood13]. Generally, other deceleration technologies would be used to further lower the velocity [Reference Samareh and Komar14]. The variable design of MDAD proves to be effective in improving deceleration performance [Reference Skolnik, Kamezawa, Li, Rossman, Sforzo and Braun15]. For instance, Hou et al. [Reference Hou, Zhang, Zhang, Gui and Hou16] conducted a secondary deployment of MDAD using a telescopic rod in both the transonic and subsonic regions. The results showed that the secondary deployment could achieve a better deceleration effect. Gramola et al. [Reference Gramola, Bruce and Santer17] used an origami structure as the TPS of MDAD, and developed an efficient hypersonic engineering model to analyse the aerothermal properties of the origami structure. The mode was employed for the TPS design by studying the insulating and ablative. The ablative thickness of 14 mm was chosen for the TPS. At present, there is limited research on the variable design of MDAD, and further investigation is needed.
In consideration of the superior deceleration performance of a parachute in the subsonic region compared to the deployable aerodynamic decelerator, this paper proposes a novel concept of transforming the MDAD from a sphere cone configuration (SCC) into a parachute-like configuration (PLC) at Ma 0.8. The aerodynamic surface of the MDAD is driven by its mechanical structure, and the aerodynamic characteristics of both configurations have been analysed. The purpose is to investigate the aerodynamic characteristics of the variable MDAD design in depth. The results show that the drag coefficient can be effectively increased with a PLC in the subsonic region. The change in configuration will impact the airflow behaviours, and the changes in axial and normal force coefficients during the transformation process are analysed. Furthermore, the PLC will alter the surface pressure distribution and static stability of the MDAD.
2.0 Computational model
2.1 Geometrical model
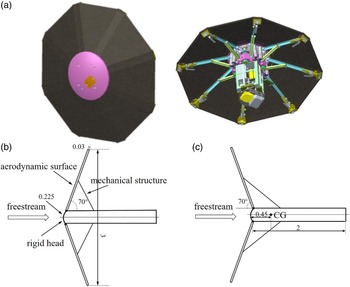
The geometric models of the two configurations are shown in Fig. 1. Figure 1(a) shows the 3D geometry of the ADEPT. As shown in Fig. 1(b), the maximum diameter of the MDAD is 3 m in the research. The half-cone angle of the SCC is 70°. The radius of the rigid head is 0.225 m. And the thickness of the aerodynamic surface is 0.03 m. The shoulder shape is shown in Fig. 1(b) (two small, rounded corners and a broken line). The half-cone angle of the PLC becomes 110° after the aerodynamic surface is driven by the mechanical structure, as shown in Fig. 1(c). The MDAD surface in SCC is supported by a retractable spoke device. The struts of the spoke device can be extended twice to support the deformation of the aerodynamic surface during the transformation process. The maximum diameter of the MDAD remains unchanged in the transformation process, meaning that the two configurations have the same aerodynamic characteristics. The axial centre of gravity (CG) position in this research was at a distance of 0.45 m, behind the rigid head. This position was chosen to maintain stability after the configuration changed [Reference Dutta, Karlgaard, Korzun, Green, Tynis, Williams, Yount, Cassell and Wercinski12].
Schematic diagram of geometric model (unit: m). (a) ADEPT; (b) SCC; (c) PLC.

2.2 Numerical calculation
The computational fluid dynamics (CFD) simulations were performed by a commercial software (Platform for Hybrid ENGineering Simulation of Flows, PHengLEI) [Reference Zhao, Zhang, Lei, He, Guo and Xu18]. The aerodynamic characteristics of the computational domain were solved using the Reynolds-Averaged Navier-Stokes equations based on the finite volume method. The user panel in this CFD software provides some available models. The shear-stress transport (SST) model was selected as the turbulence model. The ‘coupled’ scheme of pressure and velocity was selected for calculation. Then, the relevant items of the spatial discretisation are set as follows. The ‘least squares cell-based’ method was chosen for the gradient item, the ‘second order’ option for the pressure item. And the ‘second order upwind’ option was used for the density item, the momentum item, the turbulent kinetic energy item, the specific dissipation rate item and energy item.
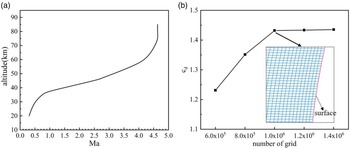
The boundary conditions were based on the flight test data of the Inflatable Reentry Vehicle Experiment (IRVE), and various altitudes were chosen for simulation. The relationship between Mach number (Ma) and altitude is shown in Fig. 2(a) [Reference Olds, Beck, Bose, White, Edquist, Hollis, Lindell and Cheatwood19]. The assumed conditions are as follows: the entry altitude is below 80 km, and the Ma ranges from 0.3 to 4.5. The incoming flow is considered as a continuous flow without any chemical reactions occurring among its components. The incoming air is an ideal compressible air, and the viscosity condition is based on Sutherland’s law. For the free incoming flow, Ma and static conditions are known for the flow field. The velocity inlet condition is set as the pressure-far-field boundary, and the wall is adiabatic and non- slip.
(a) Schematic diagram of Ma changing with altitude; (b) grid study (Ma 1.0).

The geometric model above generates a grid using a structured grid for CFD calculations. Different grid quantities, ranging from 0.6 million to 1.2 million grids, were used to study grid dependency. The results are shown in Fig. 2(b), which demonstrates that the drag coefficient increases as the number of grids increases. However, after exceeding 1.2 million grids, the drag coefficient no longer exhibits significant changes at Ma 1.0 (the angle-of-attack is zero). Therefore, it can be inferred that increasing the number of grids only marginally improves calculation accuracy. Consequently, a grid quantity of 1 million is utilised for the subsequent simulations (as shown in the inset image in Fig. 2(b)).
2.3 Compared of the simulation
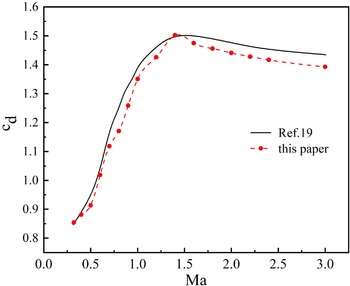
The numerical method mentioned above was used for simulation and compared with the results in the reference literature. The half-cone angle of the MDAD is 65°, which is consistent with the reference literature [Reference Wang, Hou and Niu20]. As shown in Fig. 3, the black line represents the values obtained from the reference literature, and the red dots illustrate the drag coefficient simulated by using the SCC. The comparison of results reveals that the maximum error is approximately 5.4% at Ma 0.7. This error is attributed to variations in the grid and boundary conditions. According to the comparative results, it is evident that the simulation method used in this paper is reliable.
Compared of the simulation results.

3.0 Computational details
3.1 Simulation of drag characteristics of two configurations
In order to assess whether the PLC can improve the deceleration performance, two configurations of the MDAD, the SCC and the PLC, were simulated. As the atmosphere is thin in the hypersonic region, it is not the primary deceleration stage for the MDAD. The simulation was performed in both the subsonic and supersonic regions, assuming a zero angle-of-attack (AoA). The drag coefficient of MDAD is used to represent its deceleration performance. To ensure that the configuration change is acceptable, the distributions of surface pressure and temperature have been investigated. The surface pressure and temperature were simulated for both configurations at Ma 0.3 and Ma 0.8.
3.2 Simulation of axis and normal force coefficients during the transformation process
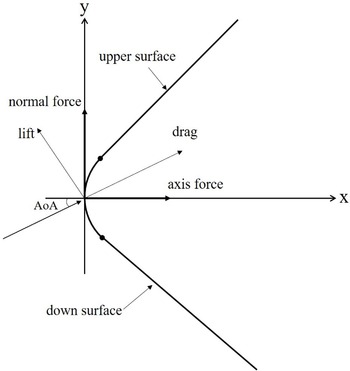
As shown in Fig. 4, the calculation of aerodynamic force relies on axial and normal forces as well as AoA. The magnitude and direction of the normal force have an impact on the pitching moment. Throughout the transformation process, the variation trend and magnitude of aerodynamic forces can significantly affect the stability of the MDAD. Hence, particular attention is given to the aerodynamic force during this process. The coefficients for axial and normal forces are employed to represent the trend of the aerodynamic force. The axial and normal forces are observed to detect any sudden changes that may occur during the transformation process. If the trend of axial and normal forces is not smooth, it will lead to a deterioration in the stability of the MDAD. Driving the aerodynamic surface by the mechanical structure, the MDAD turned into the PLC form the SCC. That is, the half-cone angle is changed from 70° to 110°. So, the transformation process is characterised by the change of half-cone angles. At the same time, the condition at different AoA is considered. The specific parameters of the half-cone angles and AoA are listed in Table 1. In section 3.1, a preliminary study on the distribution of surface pressure has been conducted. And it shows that the changed configuration would affect the airflow around the MDAD. That needs to be studied further. In the transformation process, the change of the surface pressure distribution was simulated at different AoA. MDAD has characteristics of axial symmetry in two configurations. The surface pressure distribution is different when there is an AoA. In a two-dimensional diagram as shown in Fig. 4, the upper area is defined above the axis, while the down area is defined below the axis.
Schematic diagram of MDAD at the AoA.

Parameters of half-cone angle and AoA.

3.3 Simulation of the static stability of the two configurations
It may result in a roll-over, if the attitude of the MDAD is out of control. The static stability is important in the transformation process. Consequently, the pitching moment coefficient was simulated to assess the static stability between the two configurations. And considering the condition of the entry, the AoA was expanded to 80°. The analysis of static stability can provide a foundation for the subsequent design of control system. The static stability can be judged using the following equation [Reference Hou, Zhang, Zhang, Gui and Hou16]:
 \begin{align}{c_m} = 0\,\,\&\,\,{{\partial {c_m}} \over {\partial AoA}} \lt 0\end{align}
where
 ${c_m}$
is the pitching moment coefficient.
4.0 Results and analysis
4.1 Drag characteristics
Figure 5 displays the drag coefficients of the two configurations. The results show that there is little difference in the drag coefficients within the supersonic region, and the curves of the drag coefficients are essentially the same. In the subsonic region, the drag coefficients of the two configurations are clearly different. The drag coefficient of the PLC is obviously higher than that of the SCC, as shown in the locally enlarged photograph. The maximum increase is approximately 10%. Considering that the MDAD has to be folded and unfolded using a mechanical structure, the drag coefficients could increase by shape transformation based on the existing mechanical structure. It has been shown that the PLC could improve the deceleration performance of the MDAD in the subsonic region.
Drag coefficients in the SCC and PLC.

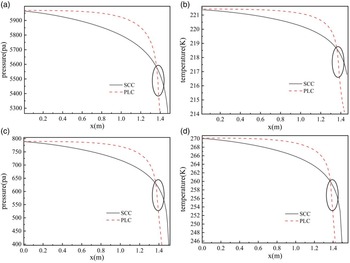
The changed configuration would affect the airflow of the MDAD. As shown in Fig. 6, the maximum values of pressure and temperature are nearly the same in both configurations. The changed configuration affects the distribution of pressure and temperature on the aerodynamic surface. For the SCC, the rigid head is the main area that experiences aerodynamic force and heat. The surface pressure gradually decreases along the radial direction of the MDAD. For the PLC, the surface pressure is not only concentrated on the rigid head. The overall aerodynamic surface pressure is similar to that of a rigid head, which puts forward higher requirements for the structural strength and TPS in a PLC. At the shoulder (as shown by the black circle) of MDAD, the pressure and temperature rapidly decrease in the two configurations. The shoulder location is positioned ahead in a PLC.
Distributions of surface pressure and temperature of MDAD at two different configurations and the AoA is zero. (a-b) Ma 0.3; (c-d) Ma 0.8.

4.2 Axis and normal force coefficients
The analysis results presented in Section 4.1 demonstrate that the PLC exhibits superior deceleration performance in the subsonic region. Notably, the drag coefficient of the PLC starts to increase significantly below Ma 0.8. Consequently, the PLC configuration is employed for deceleration in the subsonic and below regions, while the SCC configuration is utilised for deceleration in the supersonic region. The Ma 0.8 is deemed appropriate for the configuration transformation. To ensure the reliability of the transformation process, simulations were conducted to examine the behaviour of the axial and normal force coefficients at Ma 0.8.
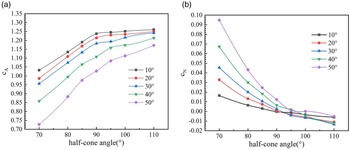
The MDAD reenters at different AoA during reentry, and the study of the axial and normal force trends with the half-cone angle is to ensure that there is no attitude destabilisation during the configuration transition at Ma 0.8. As shown in Fig. 7(a), the results reveal that the axial force coefficients can tend to stabilise at different AoA with the changed half-cone angles. In the process of structural transformation, there is no sudden change of the axial and normal forces. In general, the axial force coefficients decrease with increasing AoA. When the half-cone angles reach 90°, the MDAD turns into a special state – the flat-panel configuration. The axial force coefficients increase as the half-cone angle changes from 70° to 90°. When the half-cone angles exceed 90°, the axial force coefficients tend to stabilise at the AoA below 30°. However, when the AoA reaches 40° and 50°, the axial force coefficients increase slightly. The normal force coefficients decrease as the half-cone angles increase to 90°. However, for the half-cone angles that exceed 90°, the normal force coefficients at an AoA of 10° are greater than in other conditions (the AoA exceeds 10°). This may be due to the altered configuration. Overall, the normal force coefficients show little variation at different AoA when the half-cone angles exceed 90°. The PLC can affect the airflow. According to the result, Ma 0.8 is an appropriate point for transforming the configuration.
Axial and normal force coefficients in the transformation process at Ma 0.8 at different AoA (10° - 50°). (a) axial force coefficients; (b) normal force coefficients.

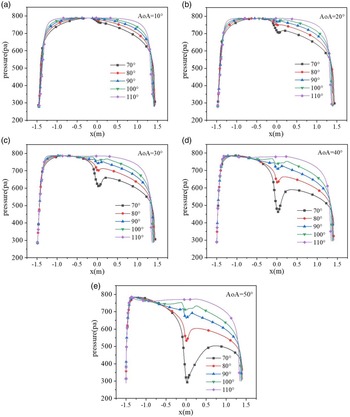
Considering the change in surface pressure at different AoA during the transformation process, the results are shown in Fig. 8. The AoA would affect the surface pressure. For the half-cone angles below 90°, the pressure on the down area is lower than the pressure on the upper area, as shown in Fig. 8(a). The pressure on the upper area shows little change, while the pressure on the down area decreases along the radial direction. The pressure drops rapidly at the shoulder of the MDAD. There is a low-pressure area on the rigid head. For the half-cone angles exceeding 90°, the pressure on the upper area is only slightly different from the pressure on the down area pressure. In the transformation process, the range of pressure change is small at the AoA below 30°. And when the AoA reaches 40° and 50°, it shows that there is a significant difference in the down area pressure between the two configurations. Although there is no significant difference in the maximum surface pressure between the two configurations, the transition process requires overcoming aerodynamic forces for relative motion. Under dynamic loads, higher strength requirements are imposed on the MDAD.
Distribution of surface pressure at different half-cone angles (70°-110°) and AoA. (a) AoA = 10°; (b) AoA = 20°; (c) AoA = 30°; (d) AoA = 40°; (e) AoA = 50°.

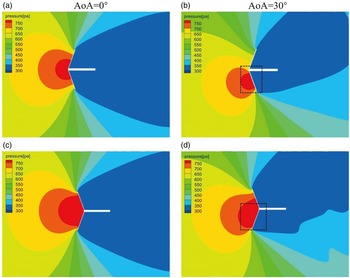
As shown in Fig. 9(a) and (b), it is the pressure flow field in the leeward of the MDAD in SCC. Figure 9(c) and (d) show the pressure flow field in the leeward of the MDAD in PLC. Compared to the two configurations, the differences are concentrated in the rigid head and shoulder area. The impact area of the pressure on the MDAD is greater in PLC. And due to the shoulder effect, the affected flow field in the leeward is larger as shown in Fig. 9(c). According to the analysis above, the critical point occurs at an AoA of 30°. As shown in Fig. 10, the above phenomenon could be explained by analysing the velocity vector diagram. For the SCC, shown in Fig. 10(a), the stagnation point (as shown by the black circle) gradually moves downward as the AoA increases. When the AoA exceeds the critical point (the AoA exceeds 30°), the airflow separates from the rigid head, causing a rapid decrease in pressure. And it would also result in the vortex (as shown by the dotted line). The airflow separation and vortex induce a low-pressure area on the rigid head. Figure 10(b) shows that in the PLC, it inhibits the separation of airflow on the rigid head, and the distribution of surface pressure does not change obviously.
Pressure contour for different AoA at Ma 0.8 in two configurations. (a-b) SCC; (c-d) PLC.

Vector of velocity for different AoA at Ma 0.8 in two configurations. (a) SCC; (b) PLC.

The aft section was considered in the previous simulations, as shown in Figs 9 and 10. The pressure field flow in Fig. 9 shows that the flow on the leeward side did not affect the pressure distribution on the upward side. It is due to the much smaller diameter of the aft section compared to the diameter of the MDAD. Further, the black dashed area in Fig. 9(b) and (d) was zoomed in to observe the flow in a velocity flow field, as shown in the first column of Fig. 10(a) and (b). The same operation was done for AoA of 40° and 50° in the second and third columns of Fig. 10(a) and (b). The simulations showed that the aft vortexes did not affect the upward velocity field. Although there is an effect on the vortices, the effect is not sufficient to change the aerodynamic characteristics of the flow field.
4.3 Static stability
In the subsonic region, the static stability during the transformation process has a critical impact on guidance and control design. Therefore, the pitching moment coefficient was simulated, and the stability was analysed. As shown in Fig. 11, the ‘cg1’ represents the fixed position of the CG at 0.45. The ‘cg2’, ‘cg3’, ‘cg4’ and ‘cg5’ represent the positions of the CG for half-cone angles of 80°, 90°, 100° and 110°, respectively. The results in Fig. 11 show that the pitching moment coefficient exhibits similar trends when the CG position is fixed. However, the stability of the PLC configuration is inferior to that of the SCC configuration. The change in the pitching moment coefficient remains consistent at small AoA (the AoA is less than 30°). And it is statically stable when the AoA is below 40° in two configurations. The stability of MDAD is strongest when the half-cone angle is 70°. For half-cone angle greater than 90°, the static stability is worse. According to Equation (1), the SCC has the maximum slope, while the PLC has the minimum slope. It shows that the static stability of the PLC is inferior to that of the SCC. It is necessary to enhance stability control in the transformation process.
Pitching moment coefficient.

The influence of the position of the CG on the static stability is also discussed. The assumed mass of the recovery system and payload is 500 kg, and the mass of the structure is 50 kg. This refers to the scale modeling of the flight test [Reference Dutta, Karlgaard, Korzun, Green, Tynis, Williams, Yount, Cassell and Wercinski12]. The mass of the aft section is not uniformly distributed, so the CG is located further forward. The structure mass is divided into four main components, i.e., the mass of the aerodynamic surface, the aerodynamic surface support rod, the spokes and the rigid head and auxiliary section, which weigh 15 kg, 10 kg, 10 kg and 15 kg, respectively. For a half-cone angle of 70°, the CG of the aerodynamic surface and the support rod is assumed to be 0.29. The spoke mass is uniformly distributed with a CG of 0.445. The CG of the rigid head, auxiliary section, and the payload is 0.46. By the half-cone angle, the mass of each component and the coordinates, the position of the CG for the recovery system and payload can be calculated as 0.45. The position of the CG is calculated as 0.442, 0.434, 0.426, 0.415 for half-cone angles of 80°, 90°, 100° and 110°, respectively. Since the position of the CG did not change significantly, the pitching moment coefficients also remained relatively unchanged. As a result, the overall trend had minimal impact on the static stability.
5.0 Conclusions
This paper proposes a novel concept to enhance the deceleration performance of the MDAD in the supersonic and subsonic regions. Using the SCC to achieve deceleration in the supersonic region. And utilising a PLC to enhance deceleration performance in the subsonic region. The results show that the PLC has better deceleration performance in the subsonic region, and the maximum drag coefficient could be increased by 10%.
In the PLC, the pressure and temperature distributions on the surface are not only concentrated in the rigid head due to the changed configuration. According to the results, the transformation is carried out at Ma 0.8 to achieve better performance. In the transformation process, the axial and normal force coefficients tend to stabilise. However, the changed configuration affects the airflow at the AoA. When the AoA is over 30°, the surface pressure varies greatly. The pressure on the down area decreases along the radial direction, while the pressure on the upper area remains relatively unchanged. That is because when the AoA exceeds 30°, the airflow separation occurs on the rigid head. The PLC could inhibit the occurrence of airflow separation on the rigid head. The analysis shows that the static stability of the PLC is worse than that of the SCC. It is necessary to implement stability control during the transformation process. The static stability remains almost the same when the CG position is changed compared to the fixed position. The analysis results show that the novel concept proposed in this paper could advance the deceleration performance of the MDAD in the subsonic region. The research would provide a certain basis for the variable design of the MDAD.
Competing interests
The authors declare none.