

1 Introduction
Previous work has documented two asymmetries in the cross-linguistic occurrence of a consonantal palatalization contrast (Takatori Reference Takatori1997, Kochetov Reference Kochetov2002). First, such a contrast is dispreferred in syllable codas in comparison to onsets. For example, Bulgarian has a palatalization contrast in onsets but not codas; no language has the opposite distribution. Second, a palatalization contrast is disfavored in labial consonants compared to coronal ones. For example, Czech has a palatalization contrast for coronals but not for labials; no language shows the reverse. Belorussian combines these tendencies, having a palatalization contrast for labials only if they are in the onset; coronals contrast in the onset and the coda.
Based on results of articulatory, acoustic, and perceptual studies of palatalization in Russian, Kochetov (Reference Kochetov2002, Reference Kochetov2004) argues that the contrast tends to be lost in certain contexts because it is perceptually weaker there. Kochetov's hypothesis, which is inspired by Steriade's (Reference Steriade1997) ‘licensing by cue’ hypothesis, implies that we should find perceptual asymmetries favoring onset and coronal palatalization contrasts in other languages. Our main goal is to test this prediction by means of a production and perception experiment employing Irish data and Irish listeners. Like Russian, Irish maintains a consonantal palatalization contrast for labials as well as coronals, and for codas as well as onsets. If Irish listeners nevertheless fare less well distinguishing palatalized consonants from non-palatalized ones for labials, or in coda position, such data would support the claim that contrasts in these contexts are universally disfavored.
We report results of an experiment testing the effects of position (word/syllable-initial and word/syllable-final), place of articulation (labial vs. coronal) and aspiration on the perception of palatalized versus non-palatalized Connemara Irish plosives. Though aspiration has not been implicated in typological asymmetries involving palatalization, we hypothesized that it might affect both production and perception of palatalization, for reasons discussed later.
There has been a fair amount of research on the acoustics and perception of secondary palatalization. However, much of it concerns Russian. There has been relatively little instrumental or experimental work on palatalization in Irish in particular. A second goal of this paper is to address this gap. In particular, an acoustic analysis of the production data used in our perception experiment establishes a range of properties distinguishing palatalized from non-palatalized consonants in Irish, though our acoustic data come from only one speaker.
2 Background
2.1 Irish palatalization
We use the term ‘(secondary) palatalization’ here to refer to a [j]- or [i]-like gesture accompanying some primary consonantal place gesture (International Phonetic Association 1999: 17), as in the Russian examples in (1). Normally the most noticeable acoustic effects obtain around the consonantal release.
(1)


The major acoustic effects of Russian palatalization are summarized in (2) (Jakobson, Fant & Halle Reference Jakobson, Fant and Halle1952, Halle Reference Halle1959, Fant Reference Fant1960, Bondarko & Zinder Reference Bondarko and Zinder1966, Zubkova Reference Zubkova1974, Derkach Reference Derkach, Fant and Tatham1975, Purcell Reference Purcell1979, Richey Reference Richey2000, Kochetov Reference Kochetov2006).
(2)

Palatalization is an important feature of Irish consonants too. The consonant phoneme inventory for the Cois Fharraige dialect of Irish is given in (3) below.Footnote 1 Though we retain the conventional transcriptions here, the ‘voiceless’ and ‘voiced’ stops are generally realized as voiceless-aspirated and voiceless-unaspirated respectively. (A similar system in Scottish Gaelic is described in Ladefoged et al. Reference Ladefoged, Ladefoged, Turk, Hind and Skilton1998.) This was very consistently the case in our data, and we will refer to the Irish distinction accordingly.
(3)

Footnote 2 Minimal pairs illustrating the contrast in Irish are given in (4) below. Unlike in Russian, palatalization alone in Irish can serve to encode morphosyntactic features, particularly differences in number and case for some noun classes, as exemplified in (5). Since this happens word-finally, one might speculate that this fact would make Irish listeners more attuned to the coda palatalization contrast than Russian listeners are. However, even if Russian does not use pure palatalization as a morphosyntactic marker, it does maintain the contrast in coda position, as seen in (1), and this can even lead to minimal pairs involving morphologically related forms, e.g. govori-t ‘speak (3rd sg.)’ vs. govori-tj ‘speak (inf.)’. It is therefore not obvious that we would expect Russian listeners to be any less sensitive to coda palatalization cues.
(4)
(5)


The transcriptions used above are broad. The realization of the secondary palatalization contrast in Irish involves a number of details and is both context-dependent (see Ní Chiosáin & Padgett Reference Ní, Padgett and Linda2001) and dialect-dependent (see Ní Chasaide Reference Ní Chasaide1995). For example, though the contrast typically manifests itself as palatalized vs. plain before back vowels, before front vowels it is better described as plain vs. velarized. This is shown in (6). Palatalization can lead to a shift in a consonant's primary place, as when a velar is realized as palatal, or a dental as something more like alveolopalatal, (6c). In the case of dental stops there is typically some affrication as well. Similar effects are evident in the realization of palatalization in Russian.
(6)

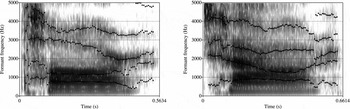
We know of one previous instrumental study of the acoustic properties of Irish palatalization. Ní Chasaide (Reference Ní Chasaide1990) reports a higher F2 for palatalized unaspirated (‘voiced’) stops compared to their non-palatalized counterparts. (See also Ladefoged et al. Reference Ladefoged, Ladefoged, Turk, Hind and Skilton1998 on Scottish Gaelic.) This difference can be seen in the spectrograms given in Figure 1, from tokens employed in the experiment reported on below.
Plain (left) vs. palatalized (right) Irish /t/, produced by a female speaker, from the words [tɔːr] and [tʲɔːr] (see Table 1).

2.2 Perception and positional neutralization
As noted in the introduction, two typological generalizations have been claimed to hold of palatalization contrasts (Takatori Reference Takatori1997, Kochetov Reference Kochetov2002). First, a palatalization contrast in syllable codas implies a contrast in syllable onsets. Second, a contrast in labial consonants implies one in coronal consonants. Kochetov (Reference Kochetov2002, Reference Kochetov2004) carried out articulatory, acoustic, and perceptual studies of palatalization in Russian [ppjttj]. Building on Steriade's (Reference Steriade1997) ‘licensing by cue’ hypothesis, he argued that the contrast tends to be lost in certain contexts because it is perceptually weaker there, and his results support this claim. Kochetov found that Russian listeners misindentify [ppjttj] more often word/syllable-finally. He also found that, in word/syllable-final position, listeners misidentify [pj] most of all, confusing it mostly with [p].
Spinu (Reference Spinu, Camacho, Flores-Ferrán, Sánchez, Déprez and Cabrera2007) tested Romanian listeners’ identification of a word-final palatalization contrast in Romanian.Footnote 4 Unlike Kochetov, Spinu found no difference in listeners’ performance between labials and coronals. There are several differences in methodology between Kochetov's and Spinu's experiments, but possibly the most important involves the consonants chosen for the studies.Footnote 5 While Kochetov tested Russian [ppjttj], Spinu specifically avoided coronal stops because they (af)fricate under palatalization.Footnote 6 The typical affrication of palatalized coronal stops is likely a robust cue to the palatalized/non-palatalized contrast at that place (see discussion in Padgett Reference Padgett, Hume and Johnson2001, and see below).
Babel & Johnson (Reference Johnson and Babel2010) tested Russian and English listeners in both a similarity and a speeded AX discrimination task, focusing on the contrast between CV and CjV (among others) in Russian. They did not investigate the role of position in the word or aspiration; their stimuli included the six consonants [bmvdlr], but Babel and Johnson found no significant difference in discrimination reaction times between [b] and [d], the relevant comparison here.
Kochetov's hypothesis implies that we should find perceptual asymmetries favoring onset and coronal palatalization contrasts in other languages. Our goal is to test this prediction with Irish production data (and Irish listeners). Like Russian, Irish maintains the palatalization contrast for labials as well as coronals, and for codas as well as onsets. If Irish listeners nevertheless fare less well distinguishing palatalized consonants from non-palatalized ones for labials, or in coda position, such data would support the claim that contrasts in these contexts are universally disfavored.
We are not aware of any demonstration that perception of a palatalization contrast depends on aspiration of a plosive. However, there is reason to hypothesize it might do so: palatalization may be cued by the length and intensity of stop releases (see references at (2) above), while aspiration bears on both of these properties of stops (see Repp Reference Repp1979, and our acoustic results below).
3 Methods
We designed an AX discrimination task to test the effects of three factors on the perception of the Irish palatalization contrast: position, with the values word/syllable-initial and word/syllable -final; place of articulation, specifically labial [pb] and coronal [td]; and aspiration.
3.1 Participants
Our participants were 10 native speakers of Connemara Irish in the west of Ireland. All participants were employees of Údarás na Gaeltachta, a governmental organization in Na Forbacha, County Galway, that supports economic development in Irish-speaking regions. Nine out of ten of our participants were raised in Connemara; the tenth was raised in an Irish-speaking household in Galway city by Connemara parents. All ten subjects lived in Connemara at the time of recording. There were six male speakers and four female speakers, with ages ranging from 20 years to 53 years (mean = 35, median 29). All subjects were English speakers as well. Irish is a minority language and there are no monlingual Irish speakers. Subjects received no remuneration for their participation.
3.2 Materials
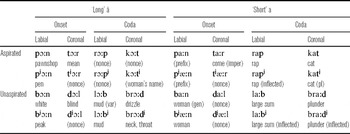
The stimuli for the experiment consisted of the 32 monosyllabic forms shown in Table 1. The target consonants, any of [ppjttjbbjddj], are underlined. The stimuli were chosen so as to vary the three factors already mentioned – position, place, and aspiration. A stimulus pair for this discrimination task always differed only in the palatalization of the target consonant; that is, participants heard pairs such as [rap] vs. [rapj], or [kɔːt] vs. [kɔːtj].Footnote 7 More than half of the stimuli were actual words, but the rest were nonce. This was necessary in order to maintain sufficient control over the material. Nonce words were always phonotactically well formed.Footnote 8
Irish stimuli used for the acoustic and perceptual studies, organized according to the position, place, and aspiration of the target consonant (in bold), as well as the quality of the neighboring vowel.

We had also hoped to vary vowel length, hence the ‘long á’ versus ‘short a’ categories. (In Irish orthography, an accent denotes a long vowel.) As in many languages, the length distinction in Irish is accompanied by differences in quality. Long /a/ in Connemara Irish is generally realized as [ɔː]. However, the facts of this dialect turn out to be even more complicated. ‘Short’ /a/ is generally long, but is shortened before aspirated syllable-final consonants (Ó Siadhail Reference Ó Siadhail1989). Our own measurements corroborated this description: ‘long á’ was on average 298 ms long; ‘short a’ averaged 138 ms before aspirated codas and 270 ms elsewhere. There was therefore no balanced distinction in length achieved by the design. However, participants in the perception experiment are not likely to have made discrimination judgements based on vowel length, since they discriminated pairs differing only in palatalization of the target consonant. (For example, in the pair [rap] vs. [rapj] both vowels are short.)
The stimuli were recorded by a 42-year-old female native speaker of Connemara Irish who grew up in, and has strong family ties to, An Spidéal. The speaker trained as a primary level teacher and works in an Irish immersion school in Dublin, where she has lived for the past 20 years. She is also active within the Irish-speaking community in Dublin.
Recordings were made directly to an Apple Powerbook G4 laptop computer in a quiet room using Praat and a Plantronics Gamecom stereo gaming headset microphone, mediated by a Griffin iMic USB audio interface, at a sampling rate of 22050 Hz. The stimuli were read in ten blocks, each block containing one each of all the words in isolation. For this production task, the words were randomized within each block and presented in Irish orthography. This provided ten tokens of each stimulus type, apart from reading mistakes. From these, five each were chosen to use in the listening task. Those discarded either contained distinguishing features judged to be irrelevant (including intonational differences and anomalous productions), or were random. Stimulus words were extracted from the onset of acoustic energy (which was the burst in the case of plosives) to its end. Since some judgement must be exercised in determining the end of stop releases and sonorant murmurs when they decay gradually, this presumably introduced some unwanted variability. These extracted stimuli were then normalized in intensity (to .8) using Praat's ‘scale peak’ feature. They were then converted to Apple system sound files by SoundApp PPC software.Footnote 9
3.3 Procedures
The experiment was presented to participants in a quiet room at Údarás na Gaeltachta in Na Forbacha, County Galway, using Superlab Pro version 1.75 on an Apple Powerbook G4 laptop with headphones. As already noted, stimuli were minimal pairs like pɔːn–pʲɔːn, in which all factors but palatalization were held constant. The interstimulus interval was 30 ms, and no noise was added. Within a block only one set of factor levels was tested. For example, one block consisted only of the pairs pɔːn–pʲɔːn, pʲɔːn–pɔːn, pɔːn–pɔːn, and pʲɔːn–pʲɔːn. (There were an equal number of same and different pairs.) There were five repetitions of each such pair, for a total of 20 stimulus pairs per block. ‘Same’ pairs were always built out of distinct recorded productions, and no repetition of a pair used the same combination of recorded tokens. Since there were 16 combinations of factors (2 positions × 2 places × 2 levels of aspiration × 2 vowel types), there were 16 blocks and 16 × 20 = 320 stimulus pairs per participant. Both trials and blocks were randomized by participant.
Responses and reaction time were recorded. Reaction times were measured from the end of the second stimulus. Instructions and feedback (about accuracy and reaction time) were given in Irish via the computer monitor. Participants listened to the stimuli over headphones and were instructed to press a blue key on the keyboard for a ‘same’ (mar a chéile) judgment, using the right hand, and a red key for a ‘different’ (éagsúil) judgment, using the left. If participants took two or more seconds to respond, they were interrupted by the program and told to go faster. For those cases, reponses were discarded. Discarded responses ranged from 4% to 25%, depending on participant. Participants began with a practice block of 16 trials of a range of types. During the experiment, participants were allowed to rest as long as they wanted between blocks. After each trial within a block, participants were given feedback reporting the correctness of their response, unless they responded too slowly, in which case only the message reminding them to speed up was given. The entire experiment took roughly 20 minutes to complete.
Many perceptual experiments are intended to explore the effect of linguistic experience on the perception of sound categories. In our case, however, the purpose was more the reverse: to use Irish to explore how perceptual factors might affect sound patterns. (All distinctions we tested are in fact phonemic.) An ideal task, therefore, would be one that is independent of language. There may be no such ideal, but there is reason to assume a distinction between short-term auditory and phonetic category memories (Pisoni Reference Pisoni1973). Building on this idea, Babel & Johnson (Reference Johnson and Babel2010) and Johnson & Babel (Reference Babel and Johnson2010) argue that sufficiently speeded RTs in a discrimination task can access processing at the auditory (‘psycho-acoustic’) level rather than at the phonetic (‘subjective perceptual processing’) level. It was for similar reasons also that we chose to block stimuli by minimal pair, to use a very short inter-stimulus interval, and to present stimuli without noise, all decisions meant to reduce difficulty and encourage low-level perceptual decisions.Footnote 10
4 Results
4.1 Acoustic results
Before presenting the results of the perceptual experiment, this section describes the acoustic properties of the stimuli used in the experiment. This is useful to do, first, in order to provide some basis for evaluating the perceptual results. It is interesting also in and of itself, since there is relatively little instrumental data on Irish palatalization. However, the limitation should be borne in mind that our experimental tokens represent only one Irish speaker.
To explore possible acoustic effects of palatalization, we took the measurements described in the list below (all analyses employing Praat; Boersma & Weenink Reference Boersma and Weenink2007). The decision to measure these acoustic properties was based on results of previous research on palatalization, particularly for Russian (see the works cited in Section 2.1 above).
• Consonant and vowel F2, using Praat's Burg algorithm, with a window of 25 ms, set to find five formants in a 5500 Hz range, time step of 2.5 ms, and preemphasis from 50 Hz. Values were taken 12.5 ms after consonant offset for initial consonants, 12.5 ms before consonant onset for final consonants, and at vowel midpoint.
• Duration, intensity, and center of gravity of consonantal release. ‘Release’ was defined as the period beginning with the consonantal burst and ending with the onset of vowel periodicity (initial consonants) or cessation of noise (final consonants). This included periods of aspiration for aspirated stops, and for all stops finally, as well as frication in the case of palatalized consonants. For intensity, minimum pitch was set at 300 Hz, giving a small window (2.67 ms) for weighted averaging. This was necessary in order to get values for the smaller release intervals. For center of gravity, sounds were first band-pass filtered to retain the 1–10 KHz range (smoothing = 100), and a power of 2 used.
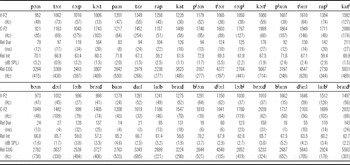
Means and standard deviations of all acoustic measures for every word are given in the Appendix. With respect to the effect of palatalization on these measures, our results line up with previous work such as that cited in Section 2.1: palatalized consonants have a higher F2, and their releases are louder, longer, and spectrally distinct. In what follows, we discuss details of these measures as they bear on the hypotheses about the perception of a palatalization contrast.
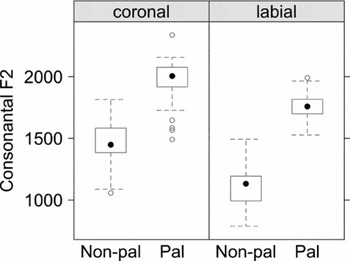
We submitted all measurements to analyses of variance using all factors (palatalization, position, place, aspiration, and vowel), with the token as experimental unit (since there was one speaker). Figure 2 shows boxplots of consonantal F2 for palatalized versus non-palatalized consonants, broken down further by place of articulation. There were significant main effects of both palatalization (F(1,125) = 1262, p < .001) and place (F(1,125) = 279, p < .001), both in the expected directions (F2 higher for palatalized consonants and coronals). There was also an interaction, with the difference in palatalization being greater for labial consonants (F(1,125) = 19, p < .001).Footnote 11
Consonant F2 by palatalization and place of articulation.

Consonantal F2 was on average about 600 Hz higher for palatalized consonants compared to non-palatalized ones (1867 Hz vs. 1270 Hz respectively). The difference was about 670 Hz in the case of labials (1764 Hz vs. 1098 Hz) and 510 Hz in the case of coronals (1969 Hz vs. 1456 Hz). For comparison, Purcell (Reference Purcell1979) found an overall difference of about 400 Hz for Russian (1919 Hz vs. 1524 Hz); for labials the difference was about 520 Hz (1845 Hz vs. 1328 Hz), for coronals about 270 Hz (1993 Hz vs. 1721 Hz).Footnote 12 Based on this comparison, Irish and Russian have very similar F2 values for palatalization, but Irish has a lower F2 than Russian for non-palatalized consonants.
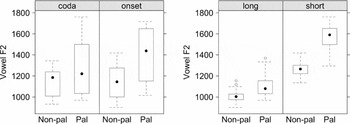
It seems important to consider the effect of consonantal palatalization on the adjacent vowel as well. As expected, F2 is higher for vowels next to palatalized consonants (F(1,125) = 451, p < .001). There is also a main effect of vowel (F(1,125) = 1549, p < .001), reflecting the quality of ‘short’ [a] as opposed to ‘long’ [ɔ]. (Recall that ‘short’ [a] is long in most contexts.) The interaction of these factors (F(1,125) = 117, p < .001) shows that the effect of palatalization is much more dramatic in the case of ‘short’ [a], as can be seen in Figure 3 (right). This figure also shows (left) that vowel F2 is more greatly affected by onset consonants. To some extent these facts accord with dialect descriptions: according to Ó Siadhail (Reference Ó Siadhail1989), ‘short’ /a/ is realized as [æ] after palatalized consonants in Connemara Irish. However, we found no three-way interaction involving palatalization, vowel, and position as this description would suggest. Rather, ‘short’ /a/ is more greatly affected both before and after palatalized consonants; and onset consonants have more of an effect whether the vowel is ‘short’ or ‘long’. In any case, these facts are worth bearing in mind, since they point up the possibility that cues to a palatalization contrast might reside well inside adjacent vowels. Palatalization and velarization have been shown to affect most or all of a vowel's quality in other languages too, including Marshallese (short vowels, Choi Reference Choi1995) and Russian (Avanesov Reference Avanesov1972, Bondarko Reference Bondarko1998).
Vowel F2 by palatalization and position (left), and by palatalization and vowel ‘length’ (right).

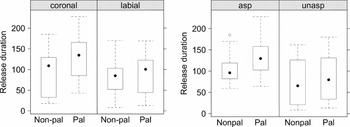
Turning now to release duration, there were significant main effects of palatalization, place, aspiration, and position (F(1,125) = 61, 103, 218, 588 respectively, p < .001 for all): releases were longer for palatalized consonants, for coronals, for aspirated consonants, and for syllable-final consonants. (Final releases were in general very long, likely due to utterance-final lengthening, since our words were read in isolation.) The effect of palatalization on release duration depended on both the place of articulation (F(1,125) = 16, p < .001) and aspiration (F(1,125) = 6.4, p < .05) of the consonant, as shown in Figure 4: the difference was greater for coronals and for aspirated consonants.
Release duration by palatalization and place (left), and by palatalization and aspiration (right).

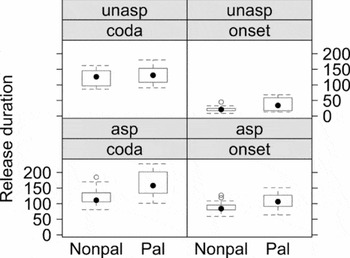
There was also a three-way interaction of palatalization, position, and aspiration (F(1,125) = 4.7, p < .05): as Figure 5 shows, the effect of palatalization on release duration was greatest in the case of aspirated codas.
Release duration by palatalization, position, and aspiration.

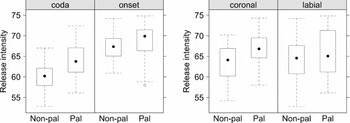
Turning to release intensity, there were main effects of palatalization, position, and aspiration (F(1,125) = 26, 182, 31 respectively, p < .001 for all): intensity was greater for palatalized consonants, for onsets, and for aspirated consonants. There were two-way interactions between palatalization and position (F(1,125) = 5.9, p < .05) and palatalization and place (F(1,125) = 6.2, p < .05). As can be seen in Figure 6, palatalization had a greater effect on release intensity for codas than for onsets (though intensity was greater overall in onsets), and for coronals than for labials.
Release intensity by palatalization and position (left), and by palatalization and place (right).

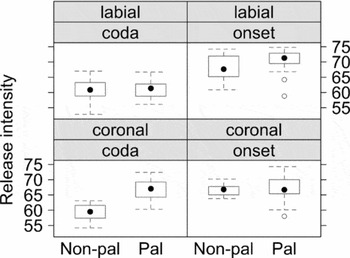
In addition, there was a three-way interaction between palatalization, position, and place (F(1,125) = 23, p < .001). What is most clear from Figure 7 is that palatalization had the greatest effect on release intensity for coronal codas.
Release intensity by palatalization, position, and place.

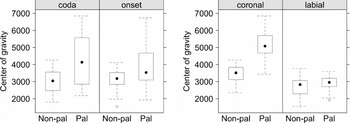
Finally, an analysis of variance showed main effects of palatalization (F(1,125) = 174, p < .001) and place (F(1,125) = 444, p < .001) on the center of gravity (COG) of the release, with COG being higher for palatalized consonants and coronal consonants. There were also two-way interactions between palatalization and position (F(1,125) = 5.9, p < .05) and palatalization and place (F(1,125) = 114, p < .001). As Figure 8 shows, palatalization had more of an effect on COG for codas and for coronals.
Center of gravity by palatalization and position (left), and by palatalization and place (right).

To sum up, first, palatalization has the expected effect of significantly raising F2, for both the consonant and the adjacent vowel at midpoint. The difference in consonantal F2 is greater for labial consonants than for coronals (indeed, this is true even for vowel F2). The effect of palatalization on the vowel F2 is greater for onsets and ‘short’ [a] vowels. Returning to the larger typological questions guiding this study, these F2 results by themselves might lead us to predict perceptual advantages for a palatalization contrast in labials compared to coronals, and in onsets compared to codas.
Second, compared to their non-palatalized counterparts, palatalized consonants have longer, louder, and spectrally higher (in terms of COG) releases (burst plus frication). These findings parallel those of Kochetov (Reference Kochetov2006) for Russian. In terms of release duration, the difference between palatalized and non-palatalized consonants was greater for coronals and for aspirated consonants, particularly aspirated codas. In the case of release intensity, the difference was likewise greater for coronals; however, it was greater for (especially coronal) codas than for onsets – though intensity was greater for onsets overall. Finally, in the case of COG, the difference was once again greater for coronals and for codas. In contrast to the F2 results, the release results reported here might lead us to expect perceptual advantages for a palatalization contrast in coronals rather than labials, and in codas rather than onsets.
4.2 Perceptual results
4.2.1 Proportion correct
All of our analyses of the perceptual results are based on different stimuli only, that is, stimulus pairs differing in presence versus absence of palatalization.Footnote 13
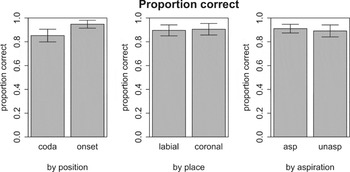
Figure 9 shows accuracy of responses by position, place of articulation, and aspiration. To analyze these proportion correct results, we carried out a binary logistic regression analysis with the factors position, place, aspiration, participant, and vowel. Including vowel as a factor gave the analysis more statistical power, but this factor was itself involved in significant effects only for some three-way interactions that we do not attempt to interpret.
Proportion correct for the 10 participants, by position, by place, and by aspiration. Error bars represent 95% confidence intervals for n = 10.

Participants were on the whole very good at the task, not a surprising fact given the design (see Section 3.3). Participants were overall more accurate discriminating onset contrasts compared to coda contrasts (95% vs. 85%, p = .001). This trend held for all ten participants. Participants also responded more accurately overall on aspirated contrasts (e.g. [rap] vs. [rapj]) than on unaspirated ones ([lab] vs. [labj]), though the difference was minimal (91% vs. 89%, p = .012), and it did not hold for all participants. There was no significant difference by place of articulation (90% for labial, 91% for coronal).
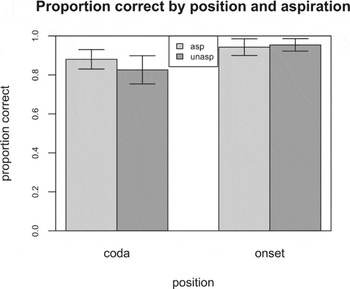
Figure 10 shows an interaction between the effects of aspiration and position on accuracy (p = .009). Though there was essentially no difference based on aspiration in onset position, in coda position participants did worse with the unaspirated contrast compared to the aspirated contrast (83% vs. 88%).
Proportion correct by position and aspiration. Error bars represent 95% confidence intervals for n = 10.

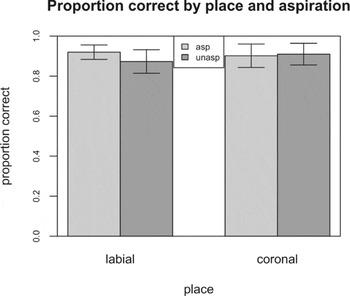
As Figure 11 shows, there was likewise an interaction between the factors of aspiration and place (p = .005), with participants doing worse on the unaspirated contrast in the case of labials (87% vs. 92%).
Proportion correct by place and aspiration. Error bars represent 95% confidence intervals for n = 10.

There was no interaction between the factors place and position.
4.2.2 Reaction times
Reaction times (RTs) were analyzed for correct ‘different’ responses. We analyzed the RTs using a mixed model with factors participant, position, place, and aspiration. It is not useful to compare RTs by position alone: since participants hear onset consonants sooner than coda consonants in the stimuli, they can be expected to react more quickly to the former for this reason alone. Figure 12 shows RTs by place of articulation for all participants combined. Participants overall responded more quickly to labial contrasts compared to coronals (1039 ms vs. 1080 ms, p = .016). However, this effect was small overall and held for only seven of the ten participants. There was no main effect of aspiration on RT.
Reaction times for all participants combined, by place of articulation. Error bars represent 95% confidence intervals for n = 10.

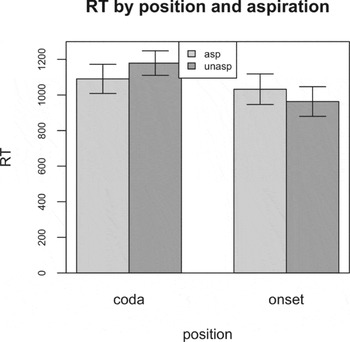
There was an interaction of position and aspiration for RTs (p < .001), as shown in Figure 13. Though participants responded more quickly to unaspirated contrasts than to aspirated ones in onset position (960 ms vs. 1027 ms), they did the reverse in coda position (1188 ms vs. 1085 ms).
Reaction times by position and aspiration. Error bars represent 95% confidence intervals for n = 10.

5 Discussion
Our acoustic results discussed earlier led to diverging predictions about perception of the palatalization contrast. The F2 results suggest that the contrast should be better perceived for labials and onsets, while the release results would seem to favor the contrast in coronals and codas. Overall our perception results point to a stronger influence of F2 on perception compared to release cues: onsets are favored over codas, and labials over coronals. We discuss these results, and our results concerning aspiration, in more detail below.
Our Irish participants had more difficulty distinguishing plain consonants from palatalized ones in coda position compared to onset position (proportion correct data). This finding mirrors that of Kochetov (Reference Kochetov2002, Reference Kochetov2004), who used stimuli produced by a Russian speaker and listeners of Russian and Japanese backgrounds, and it fits well with the observation that coda palatalization contrasts are disfavored cross-linguistically. We found this difference for Irish even though coda palatalization serves as a morphosyntactic marker in the language, unlike in Russian (though the word-final contrast in Russian is robust, see Section 2.1). We found it also even though our stimuli were derived from words read in isolation, and therefore having relatively long and audible releases. (Presumably codas would have been even more disadvantaged had they come from words in a sentential context, especially before a following consonant.) Our results therefore provide more support for Kochetov's hypothesis that coda palatalization contrasts tend to be lost because they are perceptually disadvantaged.
There are several possible (and mutually compatible) explanations for the perceptual advantage enjoyed by onset contrasts. First, it could be related to the overall greater release intensity we found for onsets: though release intensity itself did not significantly distinguish plain vs. palatalized in onset position, higher intensity overall would enhance perception of other cues, such as F2 transition. Second, listeners may be better attuned to onset contrasts apart from any purely acoustic advantage they have (Fujimura, Macchi & Streeter Reference Fujimura, Macchi and Streeter1978, Ohala Reference Ohala, Kingston and Beckman1990). Finally, we found that F2 at the vowel midpoint differed significantly more for palatalized vs. nonpalatalized when the target consonants were onsets compared to codas. To further test this last observation, we ran a logistic regression analysis on the proportion correct data, similar to that of Section 4.2.1 but employing as predictors the differences in our acoustic measures for each pair of forms in the discrimination experiment. (For example, for a given trial pair such as [lab] vs. [labj], we entered the difference between them in vowel F2, release intensity, and so on.) The only significant predictor of response among the acoustic variables was vowel F2 (p < .001). Overall, the perceptual advantage of onset palatalization suggests that listeners succeed better at employing F2 distinctions than they do release cue distinctions (which seem to favor codas).
We are not aware of previous work testing the effect of consonantal aspiration on perception of palatalization. Nor do we know of any typological evidence in support of such a connection. However, since palatalization affects the duration and intensity of the consonantal release, and since aspiration affects these cues as well, one might expect such an effect. We found a very slight advantage for the aspirated palatalization contrast overall (proportion correct), and a more robust disadvantage for the unaspirated palatalization contrast in the case of codas (proportion correct and reaction time). The one acoustic measure in our stimuli that we might attribute these differences to involves release duration: we found that the difference in release duration was greater for aspirated than unaspirated palatalization contrasts, and indeed that this acoustic difference was most robust for aspirated codas. However, release duration did not emerge as a predictor in the logistic regression analysis mentioned above. In any case, no acoustic measures (or perceptual results) seem to favor unaspirated palatalization contrasts.
The perceptual disadvantage of unaspirated palatalization contrasts was also more evident for labials. Here we may note that all of the cues involving release – duration, intensity, and COG – would seem to favor a coronal palatalization contrast. However, we found no direct acoustic support for a disadvantage for unaspirated labials in particular.
Finally, we found an advantage for labial palatalization contrasts overall (reaction time), though it was slight and did not hold for all participants. This finding is surprising in light of both the typology and Kochetov's (Reference Kochetov2002, Reference Kochetov2004) experimental results discussed earlier. It is surprising also in light of some of our own acoustic results, which showed that release characteristics distinguish plain from palatalized for coronals more than for labials. As noted in Section 2, palatalized coronals tend to be affricated in Irish (as in other languages), and the favorable release characteristics of coronals that we found are related to this fact.Footnote 14 However, it is also true that acoustic differences in consonantal F2 are more robust for labial palatalization contrasts. Perhaps these formant cues counteracted the release advantages of coronals for our Irish listeners, suggesting once again a greater role for F2 than for release cues in perceiving the palatalization contrast.
An anonymous reviewer notes that words ending in palatalized labials are not very frequent in Irish and that speakers sometimes avoid standard plural forms that would have them, using e.g. teileagramanna instead of standard teileagraim (for ‘telegrams’), the latter marked with final palatalization. If such forms were much less frequent than those with final palatalized coronals, our finding about the perception of palatalization and place might be even more surprising. We counted words ending in vowel+plain vs. palatalized p/b/t/d, based on a reverse Irish dictionary. The number of consonants palatalized is as follows: for /b/, 52/180, that is, 52 palatalized out of 180 instances of /b/ (29%); for /p/, 41/125 (33%); for /d/, 446/646 (69%); for /t/, 78/190 (41%). There are indeed many more coronals overall, and they are more likely to be palatalized. We performed another count based on a corpus of about 92,000 words.Footnote 15 When all word-final labial and coronal consonants are counted (including stops, fricatives, and nasals, again preceded by a vowel), 44% of the labials and 47% of the coronals are palatalized. Of the 52 words ending in a labial stop, 25% are palatalized (18% for /b/, 39% for /p/); of the 403 words ending in a coronal stop, 61% are palatalized (63% for /d/, 53% for /t/). These counts do indeed suggest that labial palatalization is relatively infrequent, at least for the stops. However, both of these counts were of types and not tokens, and so they should be viewed with caution.
The hypothesis of Kochetov (Reference Kochetov2002, Reference Kochetov2004) and Steriade (Reference Steriade1997) – that contrasts in some contexts are intrinsically vulnerable for perceptual reasons, and that such contrasts will be lost recurrently in sound changes – parallels a well-known line of thinking pursued by e.g. Ohala (Reference Ohala, Masek, Hendrick and Miller1981, Reference Ohala, Kingston and Beckman1990). However, a separate line of thinking hypothesizes that contrasts that might otherwise be vulnerable can be phonetically enhanced (Stevens, Keyser & Kawasaki Reference Stevens, Keyser, Kawasaki, Perkell, Klatt and Stevens1986, Stevens & Keyser Reference Stevens and Keyser1989, Kingston & Diehl Reference Kingston and Diehl1994). Related to this is the general idea that sound systems might reflect a principle of adaptive dispersion (Lindblom Reference Lindblom, Ohala and Jaeger1986), where it is understood that dispersion can come at the cost of articulatory effort. For example, Ní Chiosáin & Padgett (Reference Ní, Padgett and Linda2001) and Padgett (Reference Padgett and Holt2003) point out that both Irish and Russian innovated velarization of non-palatalized consonants before front vowels. Before back vowels in Irish, the palatalization contrast is realized as plain vs. palatalized, e.g. [fuːə] ‘hate’ vs. [fjuː] ‘worth’; but before front vowels this corresponds to a realization of velarized vs. plain, e.g. [bɣiː] ‘yellow’ vs. [biː] ‘be (imp)’. Some languages do not maintain a palatalization contrast at all in a front vowel context, presumably because e.g. [bi] vs. [bji] is a poor contrast (Padgett Reference Padgett, Hume and Johnson2001). A plausible explanation for velarization in Irish and in Russian is that it provides a means to preserve the palatalization contrast.Footnote 16
It is possible that the greater F2 differential for labial palatalization contrasts, compared to coronal ones, also represents a kind of enhancement or dispersion effect, compensation for the paucity or weakness of release cues in the case of labials (see also Padgett Reference Padgett, Hume and Johnson2001).Footnote 17 It will not do to simply point to this difference between Irish labials and coronals to explain our subjects’ better performance with labials, though, since Purcell's Russian data (recall from Section 4.1) shows an even larger difference between labials and coronals. On the other hand, the difference between palatalized and non-palatalized consonants is greater in Irish than in Russian for both places of articulation. Perhaps F2 overall is simply a more robust cue to the distinction in Irish, and because labials depend more on F2, labials are better cued in Irish. Since our data are based on a single speaker, this line of thinking should be taken with caution.
In any case, our results do suggest that a perceptual disadvantage for labial palatalization contrasts is not inevitable. Similarly, though our perceptual results support the hypothesized advantage for onset palatalization contrasts over coda ones (see above), we found that acoustic release characteristics – intensity, COG, and for aspirated consonants duration – were more robustly differentiated for codas. Others have noted an apparent ‘exaggerated’ degree of noise for palatalized consonants word-finally in Russian and suggested it might be interpreted as ‘compensation’ for comparatively weak formant cues in this position (Zubkova Reference Zubkova1974).
6 Conclusion
There has been relatively little experimental work done on Irish palatalization, and what is known about the perception of palatalization is largely due to studies of Russian. Our perceptual results for Irish parallel Kochetov's (Reference Kochetov2002, Reference Kochetov2004) for Russian in finding a perceptual advantage for onset contrasts. We do not duplicate the advantage for coronal palatalization contrasts over labial ones that Kochetov finds, and we speculate that languages may sometimes respond to perceptual vulnerability by enhancing vulnerable contrasts. Our perceptual results also support some advantage for aspirated palatalization contrasts over unaspirated ones, especially for labials and codas. Our acoustic analysis demonstrates that Irish palatalized stops evince broadly similar features to those of Russian: higher F2, with releases that are longer, louder, and spectrally distinct. Our acoustic data are from one speaker, however, and further investigation of these properties is warranted.
Acknowledgements
We are grateful to Shigeto Kawahara, Grant McGuire, Pauline Welby, and the JIPA referees for comments that improved this paper, as well as audiences at the University of Arizona, the University of California, Santa Cruz, the University of Washington, the University of Siegen, and the Annual Meeting of the Linguistic Society of America 2007. This work was supported by grants from the UCSC Senate Committee on Research and from University College Dublin.