





1. Introduction
A sessile droplet evaporating from a solid substrate is central to a wide variety of processes. Examples range from spray cooling of microelectronics (Bar-Cohen, Arik & Ohadi Reference Bar-Cohen, Arik and Ohadi2006; Kim Reference Kim2007; Deng & Gomez Reference Deng and Gomez2011) to inkjet printing (Calvert Reference Calvert2001; Singh et al. Reference Singh, Haverinen, Dhagat and Jabbour2010), pesticide deposition (Yu et al. Reference Yu, Zhu, Frantz, Reding, Chan and Ozkan2009; Damak et al. Reference Damak, Mahmoudi, Hyder and Varanasi2016) and even disease diagnosis (Sefiane Reference Sefiane2010; Brutin et al. Reference Brutin, Sobac, Loquet and Sampol2011; Chen et al. Reference Chen, Zhang, Zang and Shen2016). An evaporating sessile droplet is rarely at true equilibrium with the limiting mechanism in non-volatile liquids tending to be the diffusion of vapour away from the interface (Bourges-Monnier & Shanahan Reference Bourges-Monnier and Shanahan1995; Hu & Larson Reference Hu and Larson2002). More volatile droplets, however, can be modelled using kinetic theory and interface non-equilibrium effects (Anderson & Davis Reference Anderson and Davis1995; Ajaev Reference Ajaev2005).
Depending on wettability, droplets can either spread completely over the substrate, forming a pancake with a zero contact angle, or they can become pinned at the triple contact line (where solid, liquid and gas meet), settling at an equilibrium contact angle. In both cases, once spreading is finished, evaporation soon takes over and the droplet profile changes, making the non-equilibrium nature of the problem clear. Wettability of a droplet over a substrate can be explained by (1.1) – the well-known Young's equation,
 \begin{equation} \sigma_{SV} - \sigma_{SL} - \sigma_{LV}\cos{\theta_{eq}} = 0,\end{equation}
where  $\sigma$ denotes free energy per unit length (or surface tension) and subscripts
 $S$,
 $L$,
 $V$, refer to the solid, liquid and vapour, respectively. For a partial wetting droplet with a non-zero equilibrium contact angle, the cohesive forces of
 $\sigma _{SL}$ and
 $\sigma _{LV}$ are larger than the adhesive force of
 $\sigma _{SV}$, i.e.
 $\sigma _{SV} < \sigma _{SL} + \sigma _{LV}$. Therefore, the surface energy is minimised by inward motion of the droplet and results in a finite contact angle. For a completely wetting droplet with zero contact angle (
 $\theta _{eq} = 0$), a special case arises from the fact that
 $\cos \theta _{eq} = 1$, yielding
 $\sigma _{SV} = \sigma _{SL} + \sigma _{LV}$, and so the cohesive and adhesive forces are perfectly balanced.
Further complexity arises due to the larger number of factors governing sessile droplet dynamics. Behaviour is heavily influenced by properties of the solid substrate, including substrate roughness (Cazabat & Cohen Stuart Reference Cazabat and Cohen Stuart1986; Nakae et al. Reference Nakae, Inui, Hirata and Saito1998; Chen et al. Reference Chen, He, Lee and Patankar2005) and conductivity (Ristenpart et al. Reference Ristenpart, Kim, Domingues, Wan and Stone2007; Dunn et al. Reference Dunn, Wilson, Duffy, David and Sefiane2009); the liquid, including surface tension and volatility (Sefiane et al. Reference Sefiane, Moffat, Matar and Craster2008b; Starov & Sefiane Reference Starov and Sefiane2009); and the surrounding gas, including atmospheric pressure (Sefiane et al. Reference Sefiane, Wilson, David, Dunn and Duffy2009), humidity (Fukatani et al. Reference Fukatani, Orejon, Kita, Takata, Kim and Sefiane2016) and vapour properties (Shahidzadeh-Bonn et al. Reference Shahidzadeh-Bonn, Rafaï, Azouni and Bonn2006). In addition, the dynamics are strongly dependent on the temperature of each phase (Girard & Antoni Reference Girard and Antoni2008; Sobac & Brutin Reference Sobac and Brutin2012; Parsa et al. Reference Parsa, Harmand, Sefiane, Bigerelle and Deltombe2015), droplet shape (Sáenz et al. Reference Sáenz, Sefiane, Kim, Matar and Valluri2015), and gravity becomes important as volume increases (Extrand & Moon Reference Extrand and Moon2010; Srinivasan, Mckinley & Cohen Reference Srinivasan, Mckinley and Cohen2011).
Introduction of miscible and/or immiscible liquids (Christy, Hamamoto & Sefiane Reference Christy, Hamamoto and Sefiane2011; Bennacer & Sefiane Reference Bennacer and Sefiane2014; Tan et al. Reference Tan, Diddens, Lv, Kuerten, Zhang and Lohse2016) complicates matters even further. For droplets close to or below the capillary length ( $L_c = \sqrt {\sigma /\rho g}$), the well-known Marangoni effect has a strong influence on the flow field, dictating much of their behaviour (Deegan et al. Reference Deegan, Bakajin, Dupont, Huber, Nagel and Witten1997, Reference Deegan, Bakajin, Dupont, Huber, Nagel and Witten2000). Correctly identified by Italian physicist Carlo Marangoni, such flows arise due to surface tension gradients owing to both variations in temperature and liquid composition (Scriven & Sternling Reference Scriven and Sternling1960) – known as thermal and solutal Marangoni flow, respectively.
The solutal Marangoni effect causes droplets comprising of binary mixtures to display distinctly different behaviours from the single component equivalent. Early work by Sefiane, Tadrist & Douglas (Reference Sefiane, Tadrist and Douglas2003) found that pinned binary droplets of ethanol–water mixtures displayed non-monotonous behaviour, heavily influenced by the initial concentration. This was unlike pure droplets which displayed a monotonous evolution of evaporation rate and interface profile in time (Picknett & Bexton Reference Picknett and Bexton1977). The internal flow field of ethanol–water droplets has been shown to be inherently more complex and chaotic (Christy, Sefiane & Munro Reference Christy, Sefiane and Munro2010; Christy et al. Reference Christy, Hamamoto and Sefiane2011) due to surface tension differences arising from the uneven concentration as a result of preferential ethanol evaporation. With these early studies confined to axisymmetric droplets, Sáenz et al. (Reference Sáenz, Wray, Che, Matar, Valluri, Kim and Sefiane2017) investigated well-defined non-spherical geometries and found that controlling the interface curvature would cause segregation of the two components. With evaporation proceeding slowest at areas of minimum curvature, ethanol would linger in these areas for the longest times.
An important study on wetting binary droplets by Guéna, Poulard & Cazabat (Reference Guéna, Poulard and Cazabat2007) found the remarkable behaviour that binary alkane mixtures tended to spread and evaporate faster than either of their pure constituents – as studied by Cachile, Be & Cazabat (Reference Cachile, Be and Cazabat2002a) and Cachile et al. (Reference Cachile, Benichou, Poulard and Cazabat2002b). Guéna et al. (Reference Guéna, Poulard and Cazabat2007) noted that spreading would deviate from Tanner's law, with the spreading exponent rising to  $n = 0.3$ (
 $r \propto t^n$). This behaviour was owing to the solutal Marangoni effect. Mixtures were carefully selected so that the less volatile component (LVC) of the mixture had a higher surface tension than the more volatile component (MVC). The preferential evaporation of MVC at the contact line would leave a higher concentration of LVC and, hence, a higher surface tension compared to the bulk. The surface tension gradient would induce Marangoni flows towards the contact line, enhancing the capillary force and, as a result, the spreading rate. Droplets would spread to minimum thickness more quickly than their single components counterparts and reach dry-out faster, even when only LVC remained, due to the thinner droplet profile and increased interfacial surface area enhancing evaporation. Depending on the initial concentration, interesting drying profiles were observed, such as the droplet centre drying out before the contact line, leaving a torus shaped ring.
The first complete model to simulate the evaporation of a multicomponent droplet was provided by Diddens et al. (Reference Diddens, Kuerten, van der Geld and Wijshoff2017) who extended the mathematical model of Siregar, Kuerten & Van Der Geld (Reference Siregar, Kuerten and Van Der Geld2013), based on the lubrication approximation and solved using the finite volume method. They considered partially wetting binary droplets of ethanol–water and water–glycerol evaporating from an isothermal substrate at contact angles 6.6 $^\circ$–40
 $^\circ$ using a Navier-slip condition at the contact line. For ethanol–water droplets, Diddens et al. (Reference Diddens, Kuerten, van der Geld and Wijshoff2017) observed that at long times ethanol had almost entirely evaporated but a strong thermal Marangoni flow was still present – validating the hypothesis of Christy et al. (Reference Christy, Hamamoto and Sefiane2011). They noted that when the droplet becomes flat, the surface tension gradient leads to shape deformation with a depression in the droplet centre – similar to the observations of Guéna et al. (Reference Guéna, Poulard and Cazabat2007). Entrapped residual ethanol, previously predicted (Liu, Bonaccurso & Butt Reference Liu, Bonaccurso and Butt2008; Sefiane, David & Shanahan Reference Sefiane, David and Shanahan2008a), could not be noticed, which the authors argue was due to strong convective mixing resulting from the fast Marangoni flow. However, residual amounts of water in glycerol–water droplets (where diffusive transport is slower) were found to remain in the later stages. By then extending the model to non-isothermal heated substrates, Diddens et al. (Reference Diddens, Kuerten, van der Geld and Wijshoff2017) was able to reproduce the flow regimes and transitions reported experimentally by Zhong & Duan (Reference Zhong and Duan2016). Diddens (Reference Diddens2017) also approached the problem using a finite element model to tackle larger contact angles above 90
 $^\circ$, no longer invoking the lubrication approximation. Thermal convection was also included, accounting for the effects of substrate thickness and evaporative cooling. Here the results showed that the evaporation of the MVC can drastically decrease the interface temperature, causing the ambient vapour of the LVC to condense onto the droplet. The approach used by Diddens (Reference Diddens2017) was compared with the previous lubrication-based model (Diddens et al. Reference Diddens, Kuerten, van der Geld and Wijshoff2017). While the volume evolutions agreed well, even at low contact angles, the lubrication approach overpredicted the regular Marangoni velocities and underpredicted the chaotic velocities in the case of an instability.
The evaporation of a ternary mixture droplet was investigated for the first time by Tan et al. (Reference Tan, Diddens, Lv, Kuerten, Zhang and Lohse2016). Specifically, partially wetting droplets of the alcoholic beverage, Ouzo – a mixture of water, ethanol and anise oil. The addition of anise oil adds a further complication of mutual solubility, with the oil being miscible in ethanol but immiscible in water. The evaporation phenomena was revealed to be extremely rich, with evaporation-induced phase separation being observed. Li et al. (Reference Li, Lv, Diddens, Tan, Wijshoff, Versluis and Lohse2018) also recently observed component segregation in binary droplets due to evaporation from the contact line rim being faster than the induced Marangoni flow, resulting in the convection usually caused by Marangoni flows too weak to maintain perfect mixing.
From the short review above, while some aspects of evaporating binary mixture droplets have been reported, the underlying physics of spreading (and retraction) dynamics is still in question. This is particularly important for many applications including cooling and development of self-cleaning solvent mixtures that rely on the volatilities. In this paper we present comprehensive lubrication modelling supported by experiments considering ideal ethanol–water mixtures, far away from azeotropic concentrations. We particularly focus on flat droplets formed due to an underlying hydrophilic substrate. This allows us to not only validate our lubrication model but also to identify spreading regimes whilst at the same time revealing the governing physics. Our simulations elucidate the role of thermal and solutal Marangoni stresses and capillary forces at various stages of the evaporating process. In line with our experimental observations reported herein, it is demonstrated that for a sufficiently high concentration of ethanol, solutal Marangoni stresses drive very fast spreading of the droplet at early stages of evaporation, with spreading exponents that may exceed the value of 1. The enhanced spreading may also be accompanied by the formation of a ridge near the contact line. This behaviour is clearly reminiscent of superspreading reported in surfactant-laden flows (Rafaï et al. Reference Rafaï, Sarker, Bergeron, Meunier and Bonn2002; Karapetsas, Craster & Matar Reference Karapetsas, Craster and Matar2011). As it will be shown below, enhanced spreading of binary mixture droplets is due to the presence of strong Marangoni stresses near the contact line, arising due to the preferential evaporation of ethanol in that region. In contrast to the surfactant-laden flows however, the concentration gradients here arise as a natural consequence of the evaporation process. At later stages, it is shown that the dynamics of the evaporation and droplet shape is dictated by the interplay of thermal and solutal Marangoni stresses and capillary forces.
2. Problem statement and model formulation
2.1. Description of the problem
We study the behaviour of a small and thin sessile droplet consisting of a mixture of two volatile, miscible liquids  $A$ and
 $B$ as shown in figure 1. Liquid
 $A$ is the more volatile component (MVC) in the mixture and liquid
 $B$ the less volatile component (LVC). The mixture is assumed to be ideal and the droplet is considered Newtonian with density
 $\hat {\rho }$, specific heat capacity
 $\hat {c}_p$, thermal conductivity
 $\hat {k}$ and viscosity
 $\hat {\mu }$. For simplicity, and because liquids with similar densities will be chosen for components
 $A$ and
 $B$, we assume the liquid mixture to be incompressible and the density of both components equal, such that
 $\hat {\rho }_A=\hat {\rho }_B=\hat {\rho }$. With the exception of density, the remaining properties vary locally with concentration. We account for this using the following rule of mixtures, shown for generic variable
 $\hat {\zeta }$ as
 \begin{equation} \hat{\zeta} = \chi_A\hat{\zeta}_A + (1 - \chi_A)\hat{\zeta}_B, \end{equation}
where  $\chi _A$ is the mass fraction of component
 $A$ in the mixture (hence,
 $\chi _B = 1 - \chi _A$), while
 $\hat {\zeta }_A$ and
 $\hat {\zeta }_B$ denote property values of pure component
 $A$ and
 $B$, respectively. Within the liquid mixture, we consider only Fick's law, with the effects of thermodiffusion arising from the Soret effect neglected. At the interface, the surface tension,
 $\hat {\sigma }$, of the binary mixture has a linear dependence on both the local concentration of each component and the local temperature,
 $\hat {T}$, taking the form
 \begin{equation} \hat{\sigma} = \chi_A ( \hat{\sigma}_{A,r} + \hat{\gamma}_{T,A} (\hat{T} - \hat{T}_r) ) + (1 - \chi_A) ( \hat{\sigma}_{B,r} + \hat{\gamma}_{T,B} (\hat{T} - \hat{T}_r) ), \end{equation}
where  $\hat {\gamma }_{T,i} = \partial \hat {\sigma }_{T,i}/\partial \hat {T}$ is the temperature coefficient of surface tension of component
 $i$ (
 $i = A, B$). Here
 $\hat {\sigma }_{i,r}$ is the surface tension of component
 $i$ at reference temperature
 $\hat {T}_r$. We assume this to be the temperature of the vapour phase,
 $\hat {T}_r = \hat {T}_g$.
Droplet geometry of initial height  $\hat {H}_0$ and radius
 $\hat {R}_0$ in the cylindrical coordinate frame. The droplet consisting of miscible components
 $A$ and
 $B$ and resides on a heated substrate at temperature
 $\hat {T}_w$. The droplet is sufficiently thin such that the aspect ratio is much less than unity,
 ${\hat {H}_0}/{\hat {R}_0} \ll 1$. Gas temperature is kept constant at
 $\hat {T}_g$. Here
 $\boldsymbol {n}$ and
 $\boldsymbol {t}$ denote the outward unit vectors acting in normal and tangential directions to the interface, respectively.

The droplet resides on a heated horizontal solid substrate kept at a constant temperature  $\hat {T}_w$ and is released into a thin precursor film consisting solely of the LVC. Evaporation in the film is stabilised by the disjoining pressure which accounts for the attractive van der Waals interactions. The inclusion of the precursor film removes the stress singularity that can arise at the moving contact line. Rather than a purely artificial tool, the precursor film is also a physical effect with experimental verification (de Gennes Reference de Gennes1985). The precursor film is always formed on the solid surface if the droplet is surrounded by its vapour, from which it is adsorbed. The precursor film is sufficiently thin that the liquid molecules are attracted to the substrate by van der Waals interactions, stabilising the film and suppressing evaporation (Ajaev Reference Ajaev2005; Berthier Reference Berthier2013).
The droplet is in contact with the gas phase which has a bulk temperature of  $\hat {T}_g$. The velocity of the gas and vapour particles is assumed sufficiently low so as to be negligible. The gas phase has density
 $\hat {\rho }_v$, viscosity
 $\hat {\mu }_v$ and thermal conductivity
 $\hat {k}_v$. These gas-phase properties are assumed to be significantly smaller than their liquid counterparts, such that,
 $\hat {\rho }_g \ll \hat {\rho }$,
 $\hat {\mu }_v \ll \hat {\mu }$,
 $\hat {k}_v \ll \hat {k}$ (Burelbach, Bankoff & Davis Reference Burelbach, Bankoff and Davis1988). The same is assumed for the vapour properties. In addition, we assume that the total gas-phase pressure is sufficiently large that it remains constant with evaporation and changing vapour pressure.
Given these assumptions, we adopt the so called ‘one-sided’ model and focus solely on the liquid phase in this study. The draw of such an approach is the considerably reduced complexity by discounting the vapour phase while including the physics of the liquid phase. A clear limitation is that we are forced to assume evaporation is not vapour-diffusion limited and instead controlled by the transfer of molecules across the liquid–vapour interface. Physically, we are assuming that vapour diffuses rapidly away from the liquid–vapour interface and, therefore, the model is expected to be valid in the regime where there is a well mixed environment and so the phase-transition process is the rate limiting step. Phase transition is modelled using the non-equilibrium Hertz–Knudsen relation from kinetic theory (Plesset & Prosperetti Reference Plesset and Prosperetti1976; Moosman & Homsy Reference Moosman and Homsy1980), written in dimensional form for each  $i$ component as
 \begin{equation} \hat{\!J}_i = \frac{\hat{p}_{v,i} \hat{M}_i}{\hat{R}_g \hat{T}|_h} \left(\frac{\hat{R}_g\hat{T}|_h} {2{\rm \pi}\hat{M}_i}\right)^{{1}/{2}} \left(\alpha_{v,i}\frac{\hat{p}_{v,e,i}} {\hat{p}_{v,i}} - \beta_{v,i}\right), \end{equation}
where  $\hat {p}_{v,i}$ is the partial pressure of component
 $i$,
 $\hat {p}_{v,e,i}$ is its equilibrium vapour pressure and
 $\hat {M}_i$ its molecular weight. Here
 $\hat {T}|_h$ denotes the interfacial temperature of the liquid and
 $\hat {R}_g$ is the universal gas constant;
 $\alpha _{v,i}$ and
 $\beta _{v,i}$ are accommodation coefficients for evaporation and condensation, respectively, giving the probability that a molecule of component
 $i$ impinging on the interface will cross over to the other phase (Knudsen Reference Knudsen1950). As reviewed in Murisic & Kondic (Reference Murisic and Kondic2011), the value of accommodation coefficients used in the literature varies over several orders of magnitude from
 $O(10^{-6})$ to
 $O(1)$, with lower values providing a greater barrier to phase change by reducing the probability of a molecule crossing the interface. For simplicity, and in line with other works (Moosman & Homsy Reference Moosman and Homsy1980; Ajaev Reference Ajaev2005; Sultan, Boudaoud & Ben Amar Reference Sultan, Boudaoud and Ben Amar2005), we assume in this study that the accommodation coefficients are constant and nearly equal to each other, such that
 $\alpha _{v,i} = \beta _{v,i} = 1$. Physically this means there is no barrier to phase change and every molecule of vapour or liquid striking the interface transitions to the opposite phase (Persad & Ward Reference Persad and Ward2016).
Another modelling approach not considered here is the ‘1.5 sided’ or ‘lens’ model; generally used when evaporation is firmly in the vapour-diffusion limited regime. When using this method, the liquid phase is fully resolved with the gas phase being solved for diffusion only and boundary conditions applied along the liquid–vapour interface for the liberation of the liquid to vapour. Murisic & Kondic (Reference Murisic and Kondic2011) have explored when one evaporation model is more appropriate than the other for pure droplets of either water or isopropanol with moving contact line on non-heated surfaces. They concluded that a NEOS model with a small accommodation coefficient,  $\alpha _v$, of
 $O(10^{-4})$ better reflected the experimental results for pure water droplets while the lens model was more accurate for the isopropanol droplets.
By using accommodation coefficients close to unity, we expect our model to overpredict the evaporation rates compared to experiment, where the vapour diffusion from the interface to a far-field value is typically several orders of magnitude slower than the liberation of liquid molecules to the vapour phase. In practice, this means while our model will qualitatively simulate evaporation, a quantitative comparison with evaporation fluxes against diffusion-limited experiments is impossible. To achieve a quantitative comparison, a modified accommodation coefficient or more complex models such as those of Sultan et al. (Reference Sultan, Boudaoud and Ben Amar2005) or Sáenz et al. (Reference Sáenz, Sefiane, Kim, Matar and Valluri2015) should be explored. Despite this, one-sided models similar to the one considered here have proved powerful in the prediction of qualitative behaviour for evaporating droplets in the past, for example, the prediction of hydrothermal waves in evaporating pure component droplets (Karapetsas et al. Reference Karapetsas, Matar, Valluri and Sefiane2012).
Initially, we assume that the droplet has maximal thickness  $\hat {H}_0$ and radius
 $\hat {R}_0$, in a polar coordinate system
 $(\hat {r}, \hat {z}, \hat {\theta })$ representing the radial, axial and azimuthal axes. We consider the droplet to be axisymmetric and very thin. Therefore,
 $\hat {R}_0 \gg \hat {H}_0$, so that the droplet aspect ratio,
 $\varepsilon = \hat {H}_0/\hat {R}_0 \ll 1$. This assumption permits the use of lubrication theory, which we will employ to derive the evolution equations. Additionally, we assume the droplet is sufficiently small as to neglect gravitational effects. This means a Bond number of much less than one, requiring the radius of the droplet to be below the capillary length of both liquids in the mixture. A working mixture of ethanol and water is considered. Both liquids are sufficiently volatile on a heated substrate, ethanol being the MVC and possessing a lower surface tension than water. The selection of an ethanol–water mixture also avoids any ‘self-rewetting’ properties (Abe, Iwasaki & Tanaka Reference Abe, Iwasaki and Tanaka2004) present in other alcohol–water mixtures at certain concentrations, for example, butanol–water. The pure component properties of each fluid in the mixture are given in table 1.
Physical properties of ethanol (MVC) and water (LVC) at 20 $^\circ$ and 1 atm.

2.2. Governing equations and boundary conditions
2.2.1. Scaling
All of the aforementioned variables have taken dimensional form – a hat ( $\:\hat {}\:$) signifying the dimensional symbol. We scale the system using the properties of the more volatile component (MVC),
 $A$, and the thermocapillary velocity, defined as
 $\hat {U} = \varepsilon \hat {\gamma }_l {\rm \Delta} \hat {T} / \hat {\mu }_l$. As such, we now introduce the following scalings:
 \begin{equation} \left.\begin{array}{l@{}} \displaystyle \hat{r} = \hat{R}_0 r,\quad \hat{z} = \hat{H}_0 z,\quad \hat{t} = \dfrac{\hat{R}_0}{\hat{U}} t,\quad \boldsymbol{\hat{u}} = (\hat{u}, \hat{w}) = \left( \hat{U} u,\dfrac{\hat{H}_0}{\hat{R}_0}\hat{U} w \right); \\ \displaystyle \hat{p} = \hat{p}_{ig} + \dfrac{\hat{\mu}_A\hat{U} \hat{R}_0}{{\hat{H}_0}^2} p,\quad \hat{T} = \hat{T}_0 + T{\rm \Delta}\hat{T},\quad \hat{\!J}_i = \dfrac{\hat{k}_A{\rm \Delta}\hat{T}}{\hat{H}_0\hat{L}_{v,A}} J_i; \\ \displaystyle \hat{\sigma}_i = \hat{\sigma}_{A,0}\sigma_i,\quad \hat{\mu} = \hat{\mu}_A \mu,\quad \hat{k} = \hat{k}_A k,\quad \hat{c}_p = \hat{c}_{p,A} c_p. \end{array}\right\} \end{equation}
Here,  $\hat {t}$ is time,
 $\hat {p}$ is pressure and
 $\boldsymbol {\hat {u}}$ is the velocity vector field with components
 $\hat {u}$ and
 $\hat {w}$ in the radial and axial directions, respectively. Also,
 $\hat {L}_v$ is the latent heat of vapourisation,
 $\hat {\!J}_i$ is the evaporative flux of component
 $i$ and
 ${\rm \Delta} \hat {T}=\hat {T}_w-\hat {T}_g$. The principal dimensionless numbers arising from the scaling are the Marangoni number,
 $Ma = \hat {\gamma }_A {\rm \Delta} \hat {T}/\hat {\sigma }_{A,r}$, the Reynolds number,
 $Re = \hat {\rho }_A \hat {U} \hat {H}_0 / \varepsilon \hat {\mu }_A$, the Prandtl number,
 $Pr = \hat {\mu }_A \hat {C}_{p,A} / \hat {k}_A$, the Péclet number,
 $Pe = \hat {U} \hat {R}_0 / \hat {\mathcal {D}}_A$, evaporation number,
 $E = \hat {k}_A {\rm \Delta} \hat {T} \hat {R}_0 /{\hat {H}_0}^2 \hat {L}_{v,A} \hat {U} \hat {\rho }$, and the Knudsen number,
 $K = \hat {k}_A (2{\rm \pi} {\hat {R}_g}^3 {\hat {T}_g}^5)^{1/2} / \hat {H}_0 \hat {L}^2_{v,A} \hat {p}_{s,A} {\hat {M}_A}^{3/2}$. Here
 $K$ measures the importance of kinetic effects at the interface and can be thought of as being analogous to the inverse of the Biot number, controlling the heat loss across the interface (Karapetsas et al. Reference Karapetsas, Matar, Valluri and Sefiane2012). In addition, several property ratios unique to the binary mixture also arise from the scaling,
 \begin{equation} \left. \begin{array}{l@{}} \displaystyle \sigma_R = \dfrac{\hat{\sigma}_{B,r}} {\hat{\sigma}_{A,r}}, \quad \gamma_R = \dfrac{\hat{\gamma}_{T,B}} {\hat{\gamma}_{T,A}}, \quad \alpha = \dfrac{\hat{p}_{s,B}} {\hat{p}_{s,A}}, \quad k_R = \dfrac{\hat{k}_B} {\hat{k}_A}; \\ \displaystyle \mu_R = \dfrac{\hat{\mu}_B} {\hat{\mu}_A}, \quad c_{p R} = \dfrac{\hat{c}_{p,B}} {\hat{c}_{p,A}}, \quad M_R = \dfrac{\hat{M}_B} {\hat{M}_A}, \quad \varLambda = \dfrac{\hat{L}_{v,B}} {\hat{L}_{v,A}}, \end{array}\right\} \end{equation}
where  $\sigma _R$ is the ratio of surface tensions,
 $\gamma _R$ is the ratio of surface tension temperature coefficients,
 $\alpha$ is the relative volatility (not to be confused with
 $\alpha _v$ in (2.2)),
 $k_R$ is the ratio of thermal conductivities,
 $\mu _R$ is the viscosity ratio,
 $c_{p R}$ is the ratio of specific heats,
 $M_R$ is the molar weight ratio and
 $\varLambda$ is the ratio of latent heats.
2.2.2. Dimensionless governing equations
Flow within the droplet is incompressible and governed by the following mass, momentum, energy and concentration equations:
 \begin{gather} \boldsymbol{\nabla} \boldsymbol{\cdot} \boldsymbol{u} = 0, \end{gather}
 \begin{gather}\varepsilon Re \left( \frac{\partial \boldsymbol{u}}{\partial t} + \boldsymbol{u} \boldsymbol{\cdot} \boldsymbol{\nabla} \boldsymbol{u} \right) + \boldsymbol{\nabla} p - \nabla^2 \boldsymbol{u} = 0, \end{gather}
 \begin{gather}\varepsilon Re Pr \left( \frac{\partial (c_p T)}{\partial t} + \boldsymbol{u} \boldsymbol{\cdot} \boldsymbol{\nabla} (c_p T) \right) - \boldsymbol{\nabla} k (\boldsymbol{\nabla} T) = 0, \end{gather}
 \begin{gather}Pe \left( \frac{\partial \chi_A} {\partial t} + \boldsymbol{\nabla} \boldsymbol{\cdot} \boldsymbol{u} \chi_A \right) -\nabla^2 \chi_A = 0. \end{gather}
The concentration equation (2.9) is simplified by applying the limit of weak diffusion and assuming  $Pe \approx O(\varepsilon ^{-2})$, as derived by Matar (Reference Matar2002). Therefore, redefining
 $Pe = Pe'\varepsilon ^{-2}$ and substitution into (2.9) yields the amended conservation equation for
 $\chi _A$:
 \begin{equation} \frac{\partial \chi_A} {\partial t} + \boldsymbol{\nabla} \boldsymbol{\cdot} \boldsymbol{u} \chi_A - \frac{\varepsilon^2}{r} \frac{\partial}{\partial r} \left( r \frac{\partial \chi_A}{\partial r}\right) - \frac{1}{Pe'}\left(\frac{\partial^2 \chi_A}{\partial z^2}\right) = 0. \end{equation}
Note that contrary to the standard approach of lubrication theory, we do not remove the third term on the left-hand side, despite  $\varepsilon ^2 \ll 1$. Retaining this weak diffusive force along
 $r$ ensures that the concentration profile remains numerically stable as the solution proceeds. We also explored the limit of rapid vertical diffusion and found no qualitative differences with the simulation presented in this manuscript.
Evaporative effects are modelled using a constitutive equation based on the Hertz–Knudsen expression given by (2.2), written here in dimensionless form as
 \begin{equation} K J = \chi_A \left( \delta p + T \vert _h \right) + (1-\chi_A) \alpha M^{3/2}_R \left(\delta p + \varLambda T \vert _h \right), \end{equation}
where  $T \vert _h$ is the temperature of the interface and
 $\delta = \hat {\mu }_A \hat {U} \hat {R}_0 \hat {T}_g / \hat {\rho }_l {\hat {H}_0}^2 \hat {L}_{v,A} {\rm \Delta} \hat {T}$ accounts for the effects of changes in liquid pressure on the local phase change temperature at the interface (Ajaev Reference Ajaev2005). We partition (2.11) into two separate expressions, yielding the evaporative fluxes of components
 $A$ and
 $B$, respectively,
 \begin{gather} J_A = \frac{\chi_A}{K} \left( \delta p + T\vert_h \right), \end{gather}
 \begin{gather}J_B = \frac{(1-\chi_A) \alpha M^{3/2}_R}{K} \left(\delta p + \varLambda T\vert_h \right). \end{gather}
2.2.3. Interfacial boundary conditions
Turning our attention to the remaining interfacial boundary conditions at  $z = h(r,t)$, the evaporative flux boundary condition at the interface takes the form
 \begin{equation} EJ = - (u - u_s)\frac{\partial h}{\partial r} + (w - w_s), \end{equation}
where  $u_s$ and
 $w_s$ are interface velocities of the liquid and
 $J$ is the total evaporative flux comprising
 $J_A + J_B$. The associated energy balance is given as
 \begin{equation} J_A + J_B\varLambda + k \frac{\partial T}{\partial z} = 0. \end{equation}
Let us now consider briefly the gas phase, consisting of inert gas and the vapour of both components  $A$ and
 $B$. Under Dalton's law, the total gas pressure is written as the sum of the partial pressures of each component,
 \begin{equation} \hat{p}_g = \hat{p}_{ig} + \hat{p}_{v,A} + \hat{p}_{v,B}. \end{equation}
Here,  $\hat {p}_{ig}$,
 $\hat {p}_{v,A}$ and
 $\hat {p}_{v,B}$ indicate the partial pressures of inert gas, component A and component B, respectively. We assume that the surrounding gas phase consists mainly of inert gas rather than vapour, meaning
 $\hat {p}_{ig} \gg \hat {p}_{v,A}$ and
 $\hat {p}_{ig} \gg \hat {p}_{v,B}$. This leads to the simplification that the total gas-phase pressure is approximately equal to the pressure of the inert gas,
 \begin{equation} \hat{p}_{ig} \approx \hat{p}_g. \end{equation}
Additionally, since the droplet is considered to be small, we also ignore the effects of vapour recoil from the gas phase (Larson Reference Larson2014) since this will be relatively weak when compared to the dominating surface tension force. Given these assumptions, the normal stress boundary condition at the interface is defined as
 \begin{equation} \hat{p} - \hat{p}_g + \frac{\varepsilon^2 \sigma}{Ma} 2\kappa + \frac{\mathcal{A}}{h^3} = 0, \end{equation}
where  $2 \kappa$ is the mean curvature of the interface and
 $\mathcal {A} = \hat {\mathcal {A}} / 6 {\rm \pi}\hat {\mu }_A \hat {U} \hat {R}_0 \hat {H}_0$ is the Hamaker constant, made dimensionless in the disjoining pressure term and accounting for intermolecular interactions near the contact line. The interface height,
 $h$, is handled via the kinematic boundary condition imposed as
 \begin{equation} \frac{\partial h} {\partial t} + \boldsymbol{u} \boldsymbol{\cdot} \boldsymbol{\nabla} h + EJ = 0. \end{equation}
We now consider the concentration boundary condition along the interface by applying the limit of weak diffusion introduced in (2.10) above. As outlined in Matar (Reference Matar2002), we derive an expression independent of  $z$ by employing an approximate Galerkin expansion for
 $\chi _A$, seeking solutions of the form
 \begin{equation} \chi_A(r,z,t) = \chi_{A0}(r,t) + \chi_{A1}(r,t) \left(\frac{z^2}{h^2} - \frac{1}{3} \right), \end{equation}
where  $\chi _{A0}$ corresponds to the mean concentration and
 $\chi _{A1}$ is a non-zero mean quadratic fluctuating component. The concentration balance over the interface is given as
 \begin{equation} \left[\frac{\partial \chi_{A}}{\partial z}\right]_{h} = E(\chi_{A} J - J_A). \end{equation}
Differentiation of (2.20) with respect to  $z$ and evaluation at the interface (
 $z = h$) gives an alternative expression for
 $[{\partial \chi _A}/{\partial z}]_{h}$ in terms of
 $\chi _{A1}$,
 \begin{equation} \left[\frac{\partial \chi_A}{\partial z}\right]_{h} = \frac{2 \chi_{A1}}{h}.\end{equation}
Substitution of (2.21) into (2.22) hence constructs an expression for  $\chi _{A}$ in terms of
 $\chi _{A1}$,
 \begin{equation} \chi_A = \frac{2 \chi_{A1}}{E J h} + \frac{J_A}{J}.\end{equation}
By evaluating (2.20) at  $z = h$ and substituting in (2.23), we obtain the following expression for
 $\chi _{A1}$ independent of
 $\chi _A$:
 \begin{equation} \chi_{A1} = \frac{(J_A - J \chi_{A0})}{2 \left( \dfrac{J}{3} - \dfrac{1}{Pe' E h} \right)}.\end{equation}
We arrive at the final form of the concentration balance over the interface in the limit of weak diffusion by substituting (2.24) into (2.22),
 \begin{equation} \left[\frac{\partial \chi_{A}}{\partial z} \right]_{h} = \frac{(J_A - J \chi_{A0})}{h \left( \dfrac{J}{3} - \dfrac{1}{Pe' E h} \right)}. \end{equation}
2.3. Solution method and initial conditions
2.3.1. Kármán–Pohlhausen approximation
We now apply the Kármán–Pohlhausen integral approximation whereby we integrate (2.6), (2.7), (2.8) and (2.10) over  $z$ from
 $0$ to
 $h$. Doing this removes any multiple variable differentials while retaining the inertia and advection terms in the momentum and energy balance equations. First, let us define the integrated forms of
 $f$ and
 $\varTheta$ as
 \begin{equation} f = \int_{0}^{h} u \,\textrm{d} z, \quad \varTheta = \int_{0}^{h} T \,\textrm{d} z.\end{equation}
In order to be able to evaluate (2.26a,b), we now need to prescribe the forms of  $u$, and
 $T$ as a function of the vertical coordinate. To this end, we assume that each variable can be approximated by a polynomial of the form
 $c_1 + c_2 z + c_3 z^2$. By substituting the corresponding polynomials in (2.26a,b) and applying the appropriate boundary conditions, it is possible to evaluate the polynomial constants and eventually derive the following expressions for
 $u$ and
 $T$,
 \begin{gather} u = \left(\frac{3 f}{h^2} - \frac{\partial \sigma}{\partial r} \frac{1}{2 \mu Ma} \right)z - \left(\frac{3 f}{2 h^3} - \frac{\partial \sigma}{\partial r} \frac{3}{4 h \mu Ma} \right)z^2, \end{gather}
 \begin{gather}T = T_w + \left(\frac{(J_A + \varLambda J_B)} {2 k} + \frac{3 \varTheta} {h^2} -\frac{3 T_w} {h} \right)z + \left(- \frac{3(J_A + \varLambda J_B)} {4 h k} - \frac{3 \varTheta} {2 h^3} + \frac{3 T_w} {2 h^2} \right)z^2. \end{gather}
Integration of the governing equations along with application of the boundary conditions defined in § 2.2.3 yields the following integrated forms of the mass,  $r$-momentum, energy and concentration equation in the limit of weak diffusion:
 \begin{gather} \frac{\partial h}{\partial t} = - EJ - \frac{1}{r}\frac{\partial (rf)}{\partial r} - \frac{f}{r}, \end{gather}
 \begin{gather}\varepsilon Re \left(\frac{\partial f}{\partial t} + \frac{1}{r} \frac{\partial}{\partial r} \left(r \int_{0}^{h} u^2 \,\textrm{d} z \right) + u\vert_h EJ \right) = - h \frac{\partial p}{\partial r} + \left[\mu \frac{\partial u}{\partial z} \right]_{0}^{h}, \end{gather}
 \begin{gather}\varepsilon Re Pr c_p \left( \frac{\partial \varTheta}{\partial t} + \frac{1}{r} \frac{\partial}{\partial r} \left( r \int_{0}^{h} u T \,\textrm{d} z \right) + T\vert_h EJ \right) = \left[ k \frac{\partial T}{\partial z} \right]_{0}^{h}, \end{gather}
 \begin{gather}\frac{\partial \chi_{A0}}{\partial t} + \frac{f}{h} \frac{\partial \chi_{A0}}{\partial r} = \frac{(J_A - J \chi_{A0})}{ Pe' h^2 \left( \dfrac{J}{3} - \dfrac{1}{Pe' E h} \right)}. \end{gather}
Note that in the above expressions, all terms containing  $u$ and
 $T$ are evaluated using (2.27) and (2.28) and, therefore, we end up with expressions containing the unknown variables
 $f$ and
 $\varTheta$ instead of
 $u$ and
 $T$.
2.3.2. Precursor film and resulting boundary conditions
As previously mentioned, we assume that the droplet is surrounded by a thin precursor film covering the heated substrate upon which it resides. In this region, the fluid is flat with zero mean curvature and sufficiently thin such that evaporation is suppressed by attractive van der Waals forces. We assume the mixture in the precursor region is at equilibrium concentration,  $\chi _{A,\infty } = 0$, meaning that it consists solely of the LVC. Simplifying (2.18) subject to these conditions when
 $h = h_\infty$ yields the expression for the precursor layer height:
 \begin{equation} h_\infty = \left( \frac{\mathcal{A} \delta} {\varLambda T \vert _h}\right)^{1/3}. \end{equation}
We now turn our attention to the boundary conditions at the bottom wall where the liquid meets the solid substrate ( $z = 0$). Here, we impose conditions of no-penetration, no-slip and constant temperature, such that
 \begin{equation} \frac{\partial \chi_A}{\partial z} = 0, \quad \boldsymbol{u} = 0, \quad T = 1. \end{equation}
Finally, we apply the following boundary conditions to the radial extremes of the domain ( $r = 0$ and
 $r = r_\infty$):
 \begin{equation} \left. \begin{array}{l} \displaystyle \dfrac{\partial h}{\partial r}(0,t) = 0, \quad f(0,t) = 0, \quad \dfrac{\partial \varTheta}{\partial r}(0,t) = 0, \quad \dfrac{\partial \chi_A}{\partial r}(0,t) = 0; \\ \displaystyle h(r_\infty,t) = h_\infty, \quad \dfrac{\partial h}{\partial r}(r_\infty,t) = 0, \quad f(r_\infty,t) = 0, \quad \varTheta(r_\infty,0) = h_\infty,\\ \chi_A(r_\infty,t) = 0. \end{array} \right\} \end{equation}
2.3.3. Penalty function
Due to our modelling approach, the droplet is deposited onto a thin precursor film. This film is sufficiently thin so that van der Waals interactions in the liquid phase become the dominating force and, hence, suppress further evaporation in this precursor region. It is then logical to assume that the precursor layer consists solely of the LVC since any MVC will have evaporated before the film forms. When testing the model, we noticed that artificial behaviour can occur in the precursor film resulting from the added complexity of a second component. Diffusion of the MVC from the bulk droplet into the precursor film is possible, as is condensation of MVC from the gas phase into the film region. To circumvent this problem, we incorporate a forcing-type penalty function ( $\mathcal {P}$) with which we can control the composition of the precursor film. This ensures that the inert precursor region does not interfere with the evaporation of the droplet or induce any artificial behaviour.
The penalty function itself is applied to the advection–diffusion (concentration) equation and forces the precursor film to solely consist of the LVC, preventing any evaporation or condensation from occurring. It takes the form
 \begin{equation} \mathcal{P} = \mathcal{M} \chi_{A0} \left( 1 - \tanh\left[\mathcal{B} \left( \frac{h}{h_\infty} -1 \right) \right] \right) = 0, \end{equation}
where  $\mathcal {M}= 10^3$ is its magnitude and
 $\mathcal {B} = 5$. When
 $h > h_\infty$, as is the case in the bulk droplet,
 $\mathcal {P}$ is zero regardless of the value of concentration and so has no effect on the solution. The penalty function begins to influence the solution when droplet height approaches that of the precursor. If
 $h = h_\infty$,
 $\mathcal {P}$ tends towards
 $\mathcal {M}$. When applied to the conservation equation for concentration,
 $\chi _A$ is forced to zero, minimising
 $\mathcal {M}$ and ensuring
 $\mathcal {P}$ is equal to zero once more. The physical effects of this restriction are twofold. First, it is ensured that there is no artificial condensation of the MVC into the precursor layer. Second, any diffusion of MVC from the bulk droplet to the precursor layer is arrested.
2.3.4. Initial conditions
Within the droplet profile ( $0 \leq r \leq 1$), the initial conditions are imposed such that
 \begin{equation} h(r,0) = h_\infty + 1 - r^2, \quad f(r,0) = 0, \quad \varTheta(r,0) = h(r,0) T_0, \quad 0 \le \chi_{A0,i} \le 1. \end{equation}
Here,  $\chi _{A0,i}=\chi _A(r,0)$ is the initial uniform concentration within the droplet. Outside of the droplet in the precursor layer region (
 $r > 1$), we apply the following:
 \begin{equation} h(r,0) = h_\infty, \quad f(r,0) = 0, \quad \varTheta(r,0) = h_\infty, \quad \chi_{A0,i} = 0. \end{equation}
2.3.5. Overview of solution procedure
From our definitions above, we have seven unknown variables;  $h$,
 $p$,
 $f$,
 $\varTheta$,
 $J_A$,
 $J_B$ and
 $\chi _{A0}$ along with seven independent equations. As a broad overview of the solution procedure, we begin with simplifying these equations by applying the Galerkin method of weighted residuals to obtain weak forms for each equation. Derivation and final forms of the weak equations are given in Williams (Reference Williams2018). The domain is discretised from
 $0$ to
 $r_\infty$ into a uniform mesh of
 $N_{r,tot}$ nodes (see figure 2) using the finite element method. Solutions are then obtained using a Newton–Raphson scheme with the simulation evolved forward in time using implicit Euler and an adaptive time step,
 $dt$. The time step is increased or decreased based on the largest residual error of the governing equations from the previous time step. Initial solutions are provided (via the initial conditions in § 2.3.4) and progressively more accurate values iterated to over each time step. The iterative program is written in Fortran, making use of the linear algebra package LAPACK.
Illustration of the height,  $h$, variable under initial conditions in a domain where
 $r_\infty = 3$. The one-dimensional domain consists of equally spaced
 $N_r$ nodes, here, the vertical dotted lines represent every tenth node where the total number of nodes
 $N_{r,tot} = 300$. The value of height is stored at every node point and is reconstructed to form the drop profile over the domain. The drop is initialised as a quarter circle in dimensionless space for
 $0 \le r \le 1$, with the precursor layer height,
 $h_\infty$, imposed for
 $r > 1$. Similar profiles along
 $r$ are used as initial conditions for the other variables – see § 2.3.4.

3. Experimental methodology
3.1. Apparatus and experimental procedure
A diagram of the experimental apparatus is shown in figure 3 which centres around a flexible silicone heating pad (Omega SRFR-4/5-P-230V) providing a heat flux of 0.775 W cm $^{-2}$. This sits atop an aluminium mechanical scissor lift platform and is held in place with heavy duty white duct (Gorilla) tape. The temperature of the heater is controlled with a PID controller in a feedback loop; the controller maintains the desired set point measured by a thermocouple attached to the heating pad. The CMOS camera is held in place above the scissor lift platform using a laboratory stand and clamp with liberal amounts of duct tape securing it to the desk. The CMOS camera used is a Point Grey Research Flea3 (FL3-U3-13E4M) with a 18–108 mm/2.5–16 Navigator Zoom 7000 zoom lens. The camera is connected to a PC via USB3 and is controlled through FlyCapture2 software. Optical recording is conducted at 60 fps. The droplet is illuminated from the side using a touch mounted on a large three prong clamp as the light source. To ensure a clear image is captured by the camera, Diall PVC repairing tape, possessing a smooth white surface, is layered on top of the duct tape.
Schematic diagram of the experimental apparatus.

Borosilicate glass microscope slides ( $75\ \textrm {mm} \times 25\ \textrm {mm}$, 1 mm thick) manufactured by RC Components are used as the substrate. These are simply placed on top of the tape holding down the heating pad with the friction between the two materials sufficient to prevent movement. The glass slides consistently demonstrated a low equilibrium contact angle for all fluids tested. High wettability was verified by treating the slides with ‘piranha’ solution – a volatile mixture of sulfuric acid and hydrogen peroxide. Piranha solution is a strong oxidiser and so removes organic matter whilst additionally hydroxylating the surface. The droplets are deposited on the substrate manually using a microliter syringe (Hamilton 701N
 $10\ \mathrm {\mu }$l) with reading increments of
 $0.2\ \mathrm {\mu }$l.
We consider ethanol–water mixture droplets of initial volume  $(1.0\pm 0.2)\ \mathrm {\mu }$l. Mixtures ranging from 11 wt.% to 50 wt.% initial ethanol concentration are considered at three substrate temperatures (
 $T_w$); 30
 $^{\circ }$C, 50
 $^{\circ }$C and 70
 $^{\circ }$C. Solutions are prepared in 25 ml volumes and stored in 2 mm diameter jars. Separate syringes of volume (
 $2.50\pm 0.05$) ml were used to collect samples of each pure component for mixing. The mixing volumes of each fluid as well as the initial ethanol concentrations investigated are given in table 2. Once the solutions are prepared, evaporation of the mixtures was kept to a minimum by covering the mouth of the jar with a plastic paraffin film (Parafilm); this allowed the seal to be retained with the lid removed. A sample was taken by piercing the film with the microsyringe, leaving only a small hole and suppressing unwanted evaporation as much as possible. The lid was returned after obtaining each sample. For each mixture concentration deposited on each substrate temperature, a minimum of five experimental runs were conducted to ensure the results are replicable.
Mixing volumes of ethanol and water used to prepare the mixtures and the corresponding initial volume and weight percentages of ethanol.

The results are processed by tracking the droplets radius over time, both the initial spreading followed by contact line recession as evaporation takes over. The radius is tracked frame-by-frame using an in-house algorithm written in python, making use of NumPy and OpenCV libraries. The basic overview is to convert each frame to a high contrast image using in-built OpenCV image processing tools and then detect the circular shape of the droplet using the OpenCV Hough Circles Transform. Image processing begins by removing noise from the greyscale images captured by the camera by passing through the GuassianBlur and medianBlur filters. After this, the sharp edges of the image corresponding to the contact line are detected using the adaptive threshold filter and converted to a binary black and white image using the binary threshold filter – see figure 4(b). The Hough Circles Transform is applied to this image, which then determines the best fit circle to the circular-shaped droplet outline and calculates the corresponding centre point and radius – shown in figure 4(c). To set the scale, a circular black sticker of diameter 0.8 mm is affixed to a sample glass slide. With the scale set, the expanding and contracting radius of the droplet as it spreads and recedes is measured directly. A clear limitation of this method is that the droplet must be close to circular to obtain meaningful results. In our case, this is already a requirement since we are comparing to a one-dimensional axisymmetric model where the droplet is perfectly circular. Contact line radius against time for each droplet can then be plotted. The spreading and retraction rates are obtained by analysing the radius-time graphs in the common logarithmic domain using R statistical software (R Core Team 2013) made available under the GNU General Public License (GPL). This method allows linear fits along with breakpoints to be determined in a statistically significant and consistent manner.
Top-down view snapshots of a 1 ml ethanol–water droplet comprising 25 wt.% initial ethanol deposited on a 70 $\,^{\circ }$C substrate at
 $t =0.6$ s. Panel (a) shows the original greyscale image captured by the camera, (b) shows the binary image after passing through imaging filters, and (c) shows the best-fit circle (green) to the contact line (black) along with the corresponding centre point (orange) overlaid on (a).

3.2. Errors and uncertainty
We briefly discuss the sources of error in the experiment, some more difficult to quantify than others. Table 2 gives the error in measuring the volumes of ethanol and water when preparing the binary mixtures for storage. These are typically low and based on the reading error of the syringes used to prepare the mixtures. The final volume of droplet deposited on the substrate is subject to larger error. Each  $1\ \mathrm {\mu }$l droplet is deposited using a microsyringe with reading increments of
 $0.2\ \mathrm {\mu }$l. Assuming a reading error of
 ${\pm }0.1\ \mathrm {\mu }$l yields a 10 % relative error in the deposited volume. In addition to this, we noticed that there was often a small amount of liquid residue left on the tip of the syringe after deposition. As such, the relative error in the deposited volume is likely to be larger than 10 %, with a 20 % relative error in the volume deposited being a worst case prediction. The uncertainly from the PID feedback loop can be assumed as
 ${\pm }1$ K. However, with the heater and thermocouple buried beneath an insulating plastic tape along with inherently low thermal conductivity of the glass substrate, it is likely that the surface the droplet is deposited onto will be slightly cooler than the displayed value by the controller.
Considering imaging errors, a clear droplet image is captured by the angled light source casting a shadow around the contact line. This causes the contact line to appear thicker than in reality. In addition, the formation of a ridge at the contact line in droplets with higher initial ethanol concentration causes this region to appear thicker still. Contact line instabilities also arise in ethanol rich droplets, making accurate resolution even more difficult. Measuring the pixel width of the droplet at its thickest point in the final images provides a reasonable estimate of this error. Our radius detection method relies on the idealistic assumption that droplets are always perfectly circular throughout spreading and recession. In the absence of perfectly consistent curvature around the whole circumference, the algorithm will fit a circle that best fits the largest portion of the droplet circumference. This results in fluctuation of the radius measurement as the algorithm searches for the optimum curvature. The best estimation of this uncertainty comes from the standard error of the linear fit determined by  $R$.
To minimise this error for each run, we took several measures to maximise even spreading of the droplets. These include ensuring a completely level surface, the selection of small droplet volumes, and the gentle deposition of the droplets from the microsyringe. Another limitation worth mentioning is that, particularly for higher concentrations of ethanol, droplets do not dry out in a circular shape meaning the exact point of dry-out cannot be measured by our algorithm. Rather, we rely on the visual disappearance of the droplet from the original video footage for this.
4. Experimental findings
4.1. Typical evaporation process
As previously mentioned, we consider only droplets of pure water and water–ethanol mixtures consisting of 11 wt.%, 25 wt.% and 50 wt.% initial ethanol at substrate temperatures of 30  $^{\circ }$C, 50
 $^{\circ }$C and 70
 $^{\circ }$C. In order to maximise the evaporation rate for comparison with our simulations, we restrict our investigations into the effect of concentration variation for a substrate at temperature
 $T_w = 70\,^{\circ }$C only, while effects of temperature variation are restricted to the most volatile binary mixture – 50 wt.% initial ethanol. Higher ethanol concentrations, extending to pure ethanol are not included due to difficulties in capturing a sharp contact line using our imaging method.
After a droplet is deposited carefully with the microsyringe, the typical evaporation process for all concentrations and temperatures can be split into two main stages: a rapid spreading stage followed by a slower retraction stage. These stages are to be expected with wetting droplets and has been observed extensively in the literature (Semenov et al. Reference Semenov, Trybala, Rubio, Kovalchuk, Starov and Velarde2014). The length of each stage depends on the droplet composition and substrate temperature. Additionally, for lower volatility cases, a third stationary phase can appear between spreading and retraction whereby the droplet remains at maximum radius for a time before retraction begins. Such behaviour is also expected for lower volatility liquids (Cachile et al. Reference Cachile, Be and Cazabat2002a) and is observed in our modelling results for low evaporation numbers – see, for example, figure 21.
Immediately after depositions, the droplets spread to their maximum radius. The very initial stages are dominated by inertial spreading, similar to pure and other binary mixture droplets (Winkels et al. Reference Winkels, Weijs, Eddi and Snoeijer2012; Mamalis, Koutsos & Sefiane Reference Mamalis, Koutsos and Sefiane2018). Table 3 gives the spreading coefficients,  $n$ (where
 $R \propto t^n$), for each linear regime and their corresponding breakpoints in time,
 $b$, to the next linear regime. The maximum radius achieved by each drop is given by
 $r_{max}$. A visual representation of table 3 is shown in figure 5. Here, the experimentally measured radii are plotted against time on a log-log scale with the best fit lines (
 $n$) for each regime and transition breakpoints (
 $b$) between regimes also drawn. In the case of pure water (first column of table 3 and figure 5a), the inertial spreading exponent,
 $n_1$, is
 $0.36\pm 0.07$. When ethanol is added to the mixture,
 $n_1$ increases, as seen in the remaining three columns of table 3 and figure 5(b–d), meaning inertial spreading proceeds at a faster rate for higher initial ethanol concentration. After the inertial phase, the spreading rate then decreases to a viscous regime, characterised by spreading exponents close to Tanner's law in the case of pure water and higher for binary ethanol–water compositions. After maximum radius is reached, droplets possessing lower volatilities and those on cooler substrates remain stationary for a period of time before retraction. In the case of binary droplets, retraction tends to happen in two stages: an initial rapid retraction followed by a slower contact line recession at later times. We now examine these processes in more detail for a 25 wt.% and 50 wt.% ethanol–water droplet on a 70
 $^{\circ }$C substrate.
Experimentally measured droplet radii against time for droplets deposited on a substrate at  $T_w= 70\,^{\circ }$C. Droplet radius
 $r$ is normalised by the first recorded radius after deposition,
 $r_i$, and plotted in the logarithmic space along with time after deposition. Spreading rates,
 $n$, for each regime are shown as best fit lines and the breakpoints,
 $b$, signifying transition to the next linear regime drawn as vertical dashed lines. Initial ethanol concentration (
 $\chi _{A0,i}$) for each plot is as follows: (a)
 $\chi _{A0,i} = 0.00$ (pure water); (b)
 $\chi _{A0,i} = 0.11$; (c)
 $\chi _{A0,i} = 0.25$; and (d)
 $\chi _{A0,i} = 0.50$. See table 3 for the corresponding numeric values of
 $n$ and
 $b$ for each
 $\chi _{A0,i}$.

Experimentally measured spreading exponents,  $n$, corresponding breakpoints in time,
 $b$, and maximum radii,
 $r_{max}$, for ethanol–water sessile droplets for increasing initial concentrations of ethanol,
 $\chi _{A0,i}$, at substrate temperature
 $T_w= 70\,^{\circ }$C.

4.2. 25 wt.% ethanol–water droplet
Figure 6 presents snapshots taken with the CMOS camera over the lifetime of a 25 wt.% ethanol–water droplet on a 70  $^{\circ }$C substrate. The third column of table 3 gives the spreading exponents and their transition points in time for this concentration with a visual representation given in figure 5(c). After deposition at
 $t = 0$ s, the droplet begins to spread rapidly with
 $n_1 = 1.61 \pm 0.11$ up until
 $t = 0.87 \pm 0.14$ s, considered to be firmly within the inertial regime. Faint interface ripples appear near the contact line at
 $t = 0.4$ s, subsequently dying down by
 $t = 0.8$ s as the spreading rate slows slightly to
 $n_2 = 1.15 \pm 0.45$. The lighter rim near the droplet edge indicates a thicker area of liquid near the contact line, presumably formed from strong currents pulling the fluid outwards. The droplet continues to spread until
 $t \approx 2.0$ s while at the same time the light rim decreases in thickness. A maximum droplet radius of
 $r = 4.47 \pm 0.12$ mm is reached. The droplet then proceeds to recede in two main regimes. A period of rapid recession comes first with an exponent,
 $n_5 = -2.06 \pm 0.24$, terminating at
 $t = 3.69 \pm 0.04$ s. The second regime is slower and characterised by an exponent of
 $n_8 = -0.86 \pm 0.06$. Our simulations indicate that the first rapid recession is owing to the sudden reversal of surface tension gradient as ethanol becomes sufficiently depleted within the droplet. The droplet then continues to evaporate and recede until dry-out at
 $t \approx 25.0$ s.
Top-down view snapshots of a  $1\ \mathrm {\mu }$l ethanol–water droplet comprising 25 wt.% initial ethanol deposited on a 70
 $^\circ$C substrate.

4.3. 50 wt.% ethanol–water droplet
Upon increasing the initial concentration of ethanol from 25 wt.% to 50 wt.%, a radically different behaviour emerges. Figure 7 shows camera stills taken over the droplet lifetime and the corresponding spreading exponents are given in the fourth column of table 3 and shown visually by figure 5(d). It is immediately clear when comparing with the lower concentration droplet in figure 6 that the initial spreading rate when  $\chi _{A,i} = 0.50$ is noticeably faster. Beginning at
 $n_1 = 3.66 \pm 0.33$ until
 $t_1 = 0.24 \pm 0.01$ s and continuing at the slightly reduced rate of
 $n_2 = 1.36 \pm 0.15$ until
 $t_2 = 0.65 \pm 0.03$ s. Spreading then proceeds at a rate of
 $n_3 = 0.59 \pm 0.06$ until the maximum radius of
 $5.35 \pm 0.30$ mm is reached at
 $t_3 = 1.68 \pm 0.04$ s. From
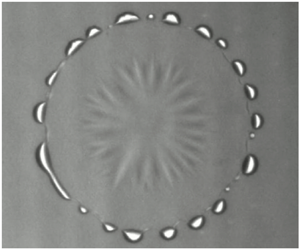
 $t = 0.2$ s in figure 7, two distinct instabilities can be seen forming in the droplet. The first is a contact line instability whereby the contact line breaks up into fingers that grow with time. The second instability appears to occur over the interface, equidistant between the droplet centre and contact line. It takes the form of spoke-like patterns arranged radially around the droplet centre, similar to those observed by Semenov et al. (Reference Semenov, Trybala, Rubio, Kovalchuk, Starov and Velarde2014).
Top-down view snapshots of a  $1\ \mathrm {\mu }$l ethanol–water droplet comprising 50 wt.% initial ethanol deposited on a 70
 $\,^{\circ }$C substrate.

The fingering instability at the contact line resembles the ‘octopi’ instability observed by Mouat et al. (Reference Mouat, Wood, Pye and Burton2020) and Gotkis et al. (Reference Gotkis, Ivanov, Murisic and Kondic2006) and is similar to the droplet ejection phenomena seen by Keiser et al. (Reference Keiser, Bense, Colinet, Bico and Reyssat2017) in ethanol–water droplets and Mouat et al. (Reference Mouat, Wood, Pye and Burton2020) in isopropanol–water droplets. Since the emergence of both instabilities only occurs at high initial ethanol concentrations, the clear indication is that they arise due to solutal Marangoni stresses. As the droplet is initially deposited as a spherical cap, evaporation will be particularly strongest at the contact line – as we have predicted with our model. Preferential evaporation of ethanol at the contact line results in high ethanol concentration within the droplet, causing a large surface tension gradient between the apex and contact line and therefore driving rapid spreading. It is this rapid spreading that causes the fingering contact line instability. The spoke-line patterns on the interface appear to be resulting from the strong outward flow within the droplet towards the contact line.
As time proceeds from  $t = 0.2$ s to
 $t = 1.8$ s, figure 7 clearly shows the contact line fingers growing in volume while the number stays constant at 21–24 fingers. The thicker fingers appear white to the camera compared to the thinner droplet interior. Our theoretical model seems to predict this phenomena in one dimension by the formation of a thicker ridge of liquid ahead of the contact line – see figure 18(a). By
 $t = 2.0$ s, finger growth ceases and the radial interface patterns decay to leave a smooth interface. The droplet then begins to retract, although this could not be recorded by our detection algorithm due to the contact line not being sharp enough after passing through imaging filters. This sudden retraction, resulting from the reversal of the surface tension gradient as ethanol is depleted, causes the fingering patters to also decay as the contact line is drawn inwards. At this point, the droplet is likely to be constituted entirely of water. At around
 $t = 3.2$ s, the droplet centre appears to dry out as it recedes, resulting in the formation of a second, inner contact line. We are now essentially left with a ring of liquid similar to that observed by Guéna et al. (Reference Guéna, Poulard and Cazabat2007). This is also confirmed by our numerical model that predicts dry-out of the interior before the contact line ridge. With the formation of the inner contact line comes a third instability, emerging as inward facing fingers forming along the circumference of the inner contact line.
4.4. Variation in concentration
Figure 8(a) plots the droplet radii measured by our detection algorithm for  $\chi _{A,i} =0.00$, 0.11, 0.25 and 0.50 versus time for
 $T_w = 70\,^{\circ }$C. This clearly illustrates the increased spreading (both rate and maximum radius) exhibited as the initial ethanol concentration is increased. As expected, droplet lifetime decreases with increasing ethanol concentration, owing in part to increased mixture volatility and partly to a larger effective area for evaporation as spreading increases. Table 3 also gives the maximum radii,
 $r_{max}$, achieved by the droplets in these plots. Compared to the
 $1\ \mathrm {\mu }$l pure water droplet, where
 $r_{max} = 2.33 \pm 0.11$ mm, the maximum radius is increased by 29 % for a
 $\chi _{A,i} = 0.11$ droplet of the same volume and then by 92 % and 130 % for droplets of
 $\chi _{A,i} = 0.25$ and
 $\chi _{A,i} = 0.50$,respectively. The rapid recession regimes are also seen clearly for
 $\chi _{A,i} = 0.11$ and
 $\chi _{A,i} = 0.25$ in figure 8(a), whereas recession is slow and steady for pure water.
Droplet radius versus time for (a) constant substrate temperature of 70 $\,^{\circ }$C for initial ethanol concentrations of 0.00 wt.%–0.50 wt.%, and (b) initial ethanol concentration of 50 wt.% for substrate temperatures of 30, 50 and 70
 $^{\circ }$C. The error in the measurement of radius are
 ${\pm }0.41$ mm (at
 $30\,^{\circ }$C),
 ${\pm }0.24$ mm (at
 $50\,^{\circ }$C) and
 ${\pm }0.30$ mm (at
 $70\,^{\circ }$C).

4.5. Variation in temperature
We consider briefly the effects of varying the substrate temperature,  $T_w$, restricting ourselves to only the most volatile ethanol–water mixture,
 $\chi _{A0,i} = 0.50$. Figure 8(b) plots radius over time for
 $T_w =30\,^{\circ }$C, 50
 $^{\circ }$C and 70
 $^{\circ }$C. As we would expect, lower
 $T_w$ results in prolonged droplet lifetimes with the mixture volatility decreasing with temperature. Lower temperature droplets are therefore able to spread for longer times, achieving a larger
 $r_{max}$. It is also clear from figure 8(b) that although droplets spread further overall, the rate of spreading is reduced as the substrate temperature is lowered. The spreading exponents for each regime along with maximum radii are given in table 4. As substrate temperature is increased, the spreading exponent for each regime increases while the corresponding breakpoint in time signifying transition to the next regime occurs earlier. This is likely due to the more rapid development of a concentration gradient when the droplet touches the substrate as ethanol evaporates more vigorously at the higher temperatures. Mamalis et al. (Reference Mamalis, Koutsos and Sefiane2018) also saw an increase in the spreading exponents with substrate temperature in their experiments with self-rewetting droplets. Additionally, when the temperature is increased, the number of fingers produced at the contact line (see figure 7 and § 4.3 for a detailed discussion of this instability) also increases, with approximately 18 seen at
 $T_w =30\,^{\circ }$C, 20 at
 $T_w =50\,^{\circ }$C and 21–24 seen at
 $T_w = 70\,^{\circ }$C. The finger length, which we define as the distance from the apparent contact line of the bulk droplet to the apex of the extended finger, also increases with substrate temperature as a higher evaporation rate drives the instability. A similar trend was seen by Sefiane, Steinchen & Moffat (Reference Sefiane, Steinchen and Moffat2010), where the wavenumber of interfacial HTWs increased with increasing substrate temperature for FC-72 droplets, albeit driven by a different phenomenon viz. thermocapillary instabilities in a pure fluid.
Spreading coefficients,  $n$, corresponding breakpoints in time,
 $b$, and maximum radii,
 $r_{max}$, at initial ethanol concentration of
 $\chi _{A0,i} = 0.50$ for increasing substrate temperatures at 30
 $^{\circ }$C, 50
 $^{\circ }$C and 70
 $^{\circ }$C.

5. Numerical results
5.1. The pure fluid limit
5.1.1. Validation
Returning now to our one-sided model defined in § 2, we first validate our model against the pure fluid model by Karapetsas et al. (Reference Karapetsas, Sáenz, Sefiane, Valluri and Matar2010) on which ours is based. To approximate a single component mixture, all property ratios are set to unity and the initial mass fraction  $\chi _{A0,i}$ to
 $0.5$. This effectively mimics a pure fluid – an equal mixture of two identical components. A domain length of
 $r_{\infty } = 2$ is used with the total number of elements
 $N_{r,tot} = 200$. Grid convergence is demonstrated in figure 9 where the total number of nodes is refined to
 $N_{r,tot} = 400$ and
 $N_{r,tot} = 2000$, with the same independent solutions obtained using all meshes.
Snapshots of (a) interface profile,  $h$, (b) total evaporative flux,
 $J$, of a droplet with
 $\chi _{A0,i} = 0.5$ with the remaining dimensionless properties given in table 5. All property ratios set to unity, resembling a pure mixture. The domain length,
 $r_{\infty }$, is 2 and the number of nodes (
 $N_{r,tot}$) is increased from 200 to 400 to 2000, demonstrating grid independence of the solution.

Figure 10 shows the contact line position,  $r_c$, and apex height,
 $h(0,t)$, for two values of the Knudsen number;
 $K = 10^{-3}$ and
 $K = 0.1$. As expected, the results from our pseudo-single component model agree well with the solutions of Karapetsas et al. (Reference Karapetsas, Sáenz, Sefiane, Valluri and Matar2010) (symbols overlaying the dashed lines). Oscillations at the apex are observed at early times when
 $t < 10^{-1}$ due to inertia at
 $Re=5$. Calculated from dimensional properties,
 $K \approx 10^{-3}$, however, the evaporation rate can be controlled by increasing
 $K$ which effectively decreases the heat transfer rate and evaporation across the interface. Figure 10 shows that increasing
 $K$ to
 $0.1$ prolongs the droplet lifetime resulting in a longer spreading time and maximum droplet radius before evaporation takes over and the contact line begins to recede.
Comparison of the current model (dashed lines) with the pure fluid model of Karapetsas et al. (Reference Karapetsas, Sáenz, Sefiane, Valluri and Matar2010) (shown by symbols) for  $K=10^{-3}$ and 0.1, (a) shows the position of the contact line over time and (b) the height of the droplet apex over time;
 $\chi _{A0,i} = 0.5$ with all property ratios set to unity, resembling a pure mixture. The remaining dimensionless properties are
 $\varepsilon = 0.2$,
 $Re = 5$,
 $Pr = 10$,
 $Ma = 10^{-2}$,
 $Pe = 25$,
 $E = 10^{-3}$,
 $\delta = 10^{-5}$ and
 $\mathcal {A} = 10^{-4}$.

5.1.2. Pure water droplet
We now introduce the parameters used in modelling an ethanol–water droplet. We begin by assuming a temperature difference between the substrate and air,  ${\rm \Delta} \hat {T}$, of
 $45\,^{\circ }$C. All droplets have an initial volume of
 $1\ \mathrm {\mu }$l and an initial aspect ratio of 0.2. Dimensionless numbers and property ratios are calculated from the physical properties of each component given in table 1, and listed in table 5. The droplets we consider are assumed to be small and very thin, meaning, surface tension is the dominating force. Thus, we focus on the Stokes flow limit and we also set
 $Pe=5$ such that
 $\varepsilon ^2 Pe \approx 1$, as required by our theory. This will also help suppression of the interfacial oscillations seen in figure 10 for most cases. The Péclet number indicates the rate of mass diffusion in the droplet; high numbers indicate slow diffusive component transport. Mass transport is intimately tied to the rate of evaporation, something that is relatively fast in our one-sided model due to the assumption of a phase-transition limited evaporation over a diffusion limited approach.
Typical dimensionless base parameters for an ethanol–water mixture.

The parameters  $\mathcal {A}$ and
 $\delta$ are set to
 $10^{-4}$ and
 $10^{-5}$, respectively, and we assume both components have equal latent heats (
 $\varLambda = 1$). This sets the precursor thickness (
 $h_\infty$) to
 $10^{-3}$, corresponding to 1/1000th of the initial apex height of the droplet. The precursor layer in our model will be thicker than in experiments which are wildly regarded to be in the submicron range around 100 Å (de Gennes Reference de Gennes1985; Bonn et al. Reference Bonn, Eggers, Indekeu, Meunier and Rolley2009). If we assume the
 $1\ \mathrm {\mu }$l droplets from our experiment are initially deposited (however momentarily) as a perfect spherical cap, the initial apex height will be approximately 3/4 mm. A precursor thickness of 100 Å will therefore be around 1/75 000th of the initial apex height, making the precursor layer in our model almost two orders of magnitude larger. We are forced into the compromise of
 $h_\infty = 10^{-3}$ because an overly thin precursor layer results in a very large disjoining pressure in our model, causing the problem to become numerically stiff and convergence hard to achieve. Decreasing either
 $\mathcal {A}$ or
 $\delta$ individually by an order of magnitude (resulting in
 $h_\infty \approx 5\times 10^{-4}$) has a very minor effect on the solution. Lastly, for simplicity, we also assume a uniform thermal conductivity throughout the droplet, meaning
 $k_R = 1$. The remaining dimensionless number and property ratios are left as the directly calculated quantities from the liquid component properties given in table 1.
Before considering a binary ethanol–water droplet, we first study the spreading and evaporation behaviour of a pure water droplet to serve as a reference case. A pure water droplet corresponds to the dimensionless properties in table 5, with  $\chi _{A0,i} = 0$. Figure 11 details the evolution of the interface profile, surface tension and total evaporative flux along
 $r$ via snapshots in time as the droplet evaporates. The interface begins with a scaled dimensionless height and radius of 1. At early times, the droplet spreads outwards as the forces at the contact line come into balance. By
 $t = 5$, evaporation takes over and the contact line slowly recedes with the droplet retaining a spherical cap shape over the remaining lifetime until dry-out at
 $t \approx 50$. The heated substrate causes the droplet to always be warmest at the contact line due to the reduced thickness of the liquid. It is evident that throughout the droplet lifetime, maximum evaporation occurs at the warm contact line – see figure 11(c), where the vapour pressure is highest. The minimum liquid temperature is always located at the droplet apex. In the absence of solutal Marangoni effects, this is also the location of highest surface tension. Figure 11(b) shows that a positive surface tension gradient between the contact line and apex is maintained throughout the droplet lifetime. Thermal Marangoni stresses therefore drive the liquid from the contact line towards the apex, limiting spreading in the early stages and causing the spherical cap to be retained as evaporation takes over and the contact line recedes. This behaviour is in line with the findings in other similar theoretical and experimental works (Ehrhard & Davis Reference Ehrhard and Davis1991; Ehrhard Reference Ehrhard1993), and with the mechanisms described by Deegan et al. (Reference Deegan, Bakajin, Dupont, Huber, Nagel and Witten2000) and Hu & Larson (Reference Hu and Larson2006).
Snapshots of (a) interface profile,  $h$, (b) surface tension,
 $\sigma$, and (c) total evaporative flux,
 $J$, of a pure water droplet over its lifetime. Dimensionless parameters are those given in table 5 with
 $\chi _{A0,i} = 0$.

5.2. Binary mixture droplet behaviour
We now gradually increase the initial mass fraction of ethanol ( $\chi _{A0,i}$) in the droplet and examine the effects this has on the spreading behaviour and total lifetime. The parameters used are again those in table 5. Specifically, we look at five cases:
 $\chi _{A0,i} = 0.00,\ 0.10,\ 0.25,\ 0.50,\ 0.75$. Figure 12 shows the position of the contact line, apex height along with the total evaporative flux and mass fraction of ethanol at the apex versus time. Beginning by again considering a pure water droplet, figure 12(a) shows that pure water sees a modest initial spreading followed by a steady recession. After the initial stages, the height also decreases steadily – see figure 12(b) – and evaporation from the apex is modest until the final stages before dry-out – figure 12(c). Introducing ethanol into the droplet, we see that increasing
 $\chi _{A0,i}$ enhances the droplet spreading and increases the maximum position of the contact line. In all cases, the enhanced spreading is accompanied with a rapid droplet in apex height. Droplet lifetime is reduced as
 $\chi _{A0,i}$ increases owing both to the increased volatility of the mixture and the decreased droplet thickness due to enhanced spreading.
Profiles of (a) contact line position, (b) apex height, (c) apex mass flux and (d) apex mass fraction throughout droplet lifetime for varying initial mass fraction of MVC,  $\chi _{A0,i}$. Dimensionless parameters are given in table 5 with only
 $\chi _{A0,i}$ altered in each dataset.

For  $\chi _{A0,i} = 0.10$, we see that once a maximum radius is reached, the droplet begins to retract, accompanied by a regain in apex height to a position similar to the pure water droplet. Closer inspection of figure 12(d) reveals that contact line retraction coincides with depletion of
 $\chi _{A0}$ at the apex and, hence, in the rest of the droplet. A similar behaviour is displayed by
 $\chi _{A0,i} = 0.25$, with a greater initial spreading and maximum radius followed by a smaller retracted radius due to the larger proportion of evaporated ethanol leaving less droplet mass once depleted. Beyond this, with droplets constituting mainly water, evaporation then proceeds in the same way as the pure water droplet until dry-out.
5.2.1. Mechanisms governing contact line motion
In both of these cases, enhanced spreading is driven by the preferential evaporation of ethanol from the contact line. This leaves an ethanol depleted (water rich) region at the contact line with higher surface tension than the bulk droplet. Induced by solutal Marangoni stresses, liquid flows towards the freely moving contact line, causing it to spread further outwards. Spreading continues until ethanol is depleted at which point solutal Marangoni stresses are eliminated. With the absence of ethanol, there is no longer any solutal Marangoni stress and the surface tension gradient is reversed with only thermal Marangoni stress present in the pure liquid. Surface tension now becomes highest in the coldest region of the droplet. On our heated substrate this corresponds to the thickest area of liquid, in these cases the apex. Flow is now directed away from the contact line towards the apex, driven now by thermal Marangoni stresses. The further the droplet has spread and deformed from its equilibrium shape, the further it must contract to regain this profile. With greater spreading at higher initial ethanol concentrations, this explains the rapid recession of the contact line and increase in height for  $\chi _{A0,i} = 0.25$ over
 $\chi _{A0,i} = 0.10$ (see figure 11a). It is clear that thermal and solutal Marangoni stresses are in competition with solutal effects dominating the initial stages and thermal effects the latter. We will look at these in more detail to follow.
In the concentrations discussed previously, a significant amount of water remains after ethanol depletion, causing retraction and return to a spherical cap shape. With higher initial ethanol, this is not the case and droplets remain in a flattened shape throughout their lifetime. Contact line recession in these binary mixtures is caused by both the inward driven Marangoni flow and mass loss from the droplet as it evaporates. Increasing initial ethanol from  $\chi _{A0,i} = 0.50$ to
 $\chi _{A0,i} = 0.75$, the droplet spreads by a greater amount – reaching a larger maximum radius. This is explained by the increased maximum surface tension gradient between the apex and the contact line for larger
 $\chi _{A0,i}$. Figure 13 shows the change of surface tension along
 $r$ at the early time of
 $t = 0.25$ for the full range of concentrations considered. A positive surface tension gradient between the apex and contact line is clearly seen to increase with
 $\chi _{A0,i}$. A greater maximum spreading radius also results in a thinner droplet which is subject to higher temperatures and, hence, more rapid evaporation rate. Figure 12(c) shows that there is always higher evaporative flux from the apex for higher initial ethanol concentration. This is due in part to the increased proportion of volatile ethanol but also to the decreased thickness causing a warmer interface and greater evaporation rate for any given mixture as well as the larger radius leading to an increased effective interfacial area for evaporation.
Rate of change of surface tension along  $r$ for all initial ethanol concentrations considered at
 $t = 0.25$. Unless otherwise stated, dimensionless parameters are those given in table 5.

Taking a closer look at the influence of initial ethanol concentration on the spreading rate, figure 14 plots radius growth versus time on a logarithmic scale for the data shown in figure 12. As we know, the spreading behaviour of wetting droplets tends to obey a power law growth of radius in time,  $r \propto t^n$, where
 $n$ is the spreading exponent. Therefore, the gradient of the radii plotted in figure 14 will give the spreading exponents for each
 $\chi _{A0,i}$. Note that similar values of
 $n$ can be found for the retraction rate. We can see from figure 12 that as we increase the initial ethanol concentration, the line growth gradients and hence spreading exponents approach values of unity, moving into the realms of superspreading liquids such as droplets laden with trisiloxane surfactants (Rafaï et al. Reference Rafaï, Sarker, Bergeron, Meunier and Bonn2002; Karapetsas et al. Reference Karapetsas, Craster and Matar2011; Theodorakis et al. Reference Theodorakis, Müller, Craster and Matar2015).

Table 6 gives the precise values for the linear fit. As with the experimental values (see table 3),  $n_1$ gives the first spreading coefficient until the first breakpoint in time,
 $b_1$, where the gradient shifts to
 $n_2$ until time
 $b_2$ and so on until dry-out. We see that for pure water,
 $\chi _{A0,i} = 0.00$, there is an initial contact line adjustment with rapid spreading at early times where
 $n_1 = 0.6$. This value is close to the reported value by Winkels et al. (Reference Winkels, Weijs, Eddi and Snoeijer2012)
 $n = 0.55$ and within the range of the experimental error. The spreading exponent soon slows and settles at
 $n_2 = 0.11$, close to Tanner's law as expected for pure liquids (Cazabat & Cohen Stuart Reference Cazabat and Cohen Stuart1986; Chen Reference Chen1988; Chen & Wada Reference Chen and Wada1989). After time
 $b_3 = 0.78$, an exponent close to zero,
 $n_3 = 0.02$, shows a region where forces at the contact line are largely balanced and is effectively stationary before evaporation taking over and the droplet receding at increasing rates from
 $n_4$ to
 $n_8$. The majority of the retraction time,
 $t = 20.83\text {--}34.24$, is conducted at exponent
 $n_6 = -0.50$. This is similar to retraction rates reported by Cachile et al. (Reference Cachile, Be and Cazabat2002a,Reference Cachile, Benichou, Poulard and Cazabatb) as well as Poulard, Bénichou & Cazabat (Reference Poulard, Bénichou and Cazabat2003). The increasing retraction rate is explained by the shrinkage in droplet height from mass loss as it evaporates. As previously discussed, the reduced droplet thickness gives rise to greater evaporation rates since the droplet is heated more by the substrate.
Predicted spreading exponents,  $n$, and corresponding breakpoints in time,
 $b$, for increasing initial concentrations of ethanol,
 $\chi _{A0,i}$.

To reveal more information about the flow field, we decompose the averaged velocity at the interface,  $u$, into three distinct components:
 \begin{equation} u = u_{tg} + u_{cg} + u_{ca}. \end{equation}
These are the three mechanisms that can drive movement and spreading of the contact line:  $u_{tg}$ is the thermocapillary velocity, where surface tension gradients arising from temperature variations drive the fluid motion;
 $u_{cg}$ is the solutocapillary velocity, where flow is driven by a surface tension gradient sustained by an uneven mixture concentration; and
 $u_{ca}$ is the capillary velocity, sustained by the capillary pressure over the interface. By decomposing the bulk velocity into these three contributions, we can gain insight into the driving forces governing the spreading behaviour. It can be shown that for the limiting case of
 $Re=0$, the decomposed velocities at the interface are expressed as
 \begin{gather} u_{ca} = - \frac{h^2} {2 \mu} \frac{\partial p}{\partial r}, \end{gather}
 \begin{gather}u_{cg} = \left[\frac{\partial \chi_{A0}}{\partial r} - \sigma_R \frac{\partial \chi_{A0}}{\partial r} - Ma T_s \frac{\partial \chi_{A0}}{\partial r} ( 1 - \gamma_R ) \right]\frac{h}{\mu Ma}, \end{gather}
 \begin{gather}u_{tg} = \left[-\frac{\partial T_s}{\partial r} \chi_{A0} - \frac{\partial T_s}{\partial r} \gamma_R(1-\chi_{A0})\right] \frac{h}{\mu}. \end{gather}
The roles of these components will be discussed in detail for various cases in the following sections.
5.2.2. Low initial ethanol concentration
Figure 15 shows the evolution of interface position, surface tension and ethanol mass fraction along  $r$ for an ethanol–water droplet with
 $\chi _{A0,i} = 0.10$. The interface profile, figure 15(a), indicates that the droplet spreads significantly between
 $t = 0.05$ and
 $t = 0.35$ with a significant droplet in apex height of 0.3. From table 6 we can see that
 $n_2$ rises to 0.15 with the increased spreading rate lasting for longer times until
 $b_2 = 1.03$. It must be noted that for
 $\chi _{A0,i} = 0.25$,
 $n_2 = 0.19$ until
 $b_2 = 1.90$. This trend was also seen by Guéna et al. (Reference Guéna, Poulard and Cazabat2007) when increasing concentration of the more volatile alkane. Figure 15(b) reveals that the surface tension gradient between the apex and contact line increases during this period with figure 15(c) showing increased depletion of ethanol closer to the contact line. Spreading continues until
 $t = 1$ and by
 $t = 3$, the droplet begins to recede as thermal Marangoni effects start to dominate. The apex height increases from
 $t = 1$ as thermal Marangoni stress pulls liquid towards the centre. Inspection of figure 15(c) shows that ethanol is still present within the droplet in small amounts (
 $\chi _{A0} < 0.02$). If we compare the breakpoint time
 $b_2$ signifying the end of the spreading regime with figure 12(d) showing apex ethanol mass fraction, we see that ethanol is not totally depleted within the droplet until
 $t = 10$ in both cases. This suggests that a residual amount of ethanol remains in the droplet well into the recession regime. By the next snapshot, at
 $t = 20$, ethanol is totally depleted in the droplet and evaporation now proceeds relatively slowly with the interface retaining a spherical cap shape. We can see in figure 15(b) that surface tension at later times is always higher at the apex, however, the magnitude of the surface tension gradient is significantly smaller than the reverse gradient present at early times due to concentration effects.
Snapshots of (a) interface profile, (b) surface tension and (c) concentration of component  $A$ for an ethanol–water droplet with
 $\chi _{A0,i} = 0.10$. Dimensionless parameters are those given in table 5.

We now examine the decomposed interface velocities of these time snapshots in figure 16. A positive value indicates velocity directed towards the contact line while a negative value shows velocity directed towards the centre. Capillary velocity,  $u_{ca}$, resulting from interface curvature is predictably large and positive at the contact line as the droplet profile transitions into the precursor layer while becoming negative towards the centre due to reverse curvature. Figure 16(a) shows the movement of
 $u_{ca}$ over time with the spreading and recession of the contact line. The solutocapillary velocity,
 $u_{cg}$, in figure 16(b) displays a clear trend. It is positive at all times, driving liquid towards the contact line and decays over time;
 $u_{cg}$ is largest at the earliest time of
 $t =0.05$ when the concentration gradient between the apex and contact line is also at its greatest. The strength of the outward solutocapillary velocity gradually decreases as
 $\chi _{A0}$ evaporates until beyond
 $t = 3.00$ where it decays completely – coinciding with total depletion of
 $\chi _{A0}$. Figure 16(c) tracks the development of the theromocapillary velocity,
 $u_{tg}$, which is negative at all times. Again, this is in line with the work of Ajaev (Reference Ajaev2005) and Ehrhard & Davis (Reference Ehrhard and Davis1991) by demonstrating that thermocapillary force is partly responsible (aside from evaporative cooling and heat transfer from the substrate) for forcing the fluid inwards towards the droplet centre. The largest magnitude of
 $u_{tg}$ is always located at the contact line, becoming more negative the thinner the film becomes, corresponding to a warmer region.
Snapshots of decomposed surface velocities for an ethanol–water droplet with  $\chi _{A0,i} = 0.10$ over its lifetime. (a) Capillary velocity, (b) solutocapillary velocity, (c) thermocapillary velocity. Dimensionless parameters are those given in table 5.

Examining further the balance between thermal and solutal Marangoni stresses, we turn our attention to figure 17 which illustrates the combined Marangoni velocity profiles at times  $t = 1$,
 $t = 3$ and
 $t = 20$, along with the interface profile. The droplet radius is largest at
 $t = 1$ before beginning to recede at
 $t = 3$. Figure 17(a) shows a net negative (inward) Marangoni velocity in the vicinity of the contact line with a net positive (outward) velocity in the droplet interior. As time proceeds,
 $u_{cg}$ diminishes in strength and so this action combined with the constant inward flow of
 $u_{tg}$ halts the movement of the contact line. By
 $t = 3$,
 $\chi _{A0}$ is sufficiently depleted that there is only a weak outward combined Marangoni velocity in the bulk droplet with the overwhelming velocity directed inwards from the contact line. By
 $t = 20$, the combined Marangoni velocity throughout the whole droplet profile is negative and directed inwards with the absence of any solutal effects.
Interface profile and corresponding combined Marangoni velocity (solutal and thermal) for an ethanol–water droplet with  $\chi _{A0,i}=0.10$. Other dimensionless parameters are those given in table 5. (a)
 $t = 1.00$, (b)
 $t = 3.00$, (c)
 $t = 20.00$.

5.2.3. High initial ethanol concentration
When the initial ethanol concentration is increased to  $\chi _{A0,i} = 0.50$, the evolution of the droplet profile becomes more complex. In figure 18 we again examine the evolution of the interface position, surface tension and mass fraction of ethanol. With figures 19 and 20 we explore the decomposed velocities in more detail. It is clear from figure 18(a) that evolution of the interface is different from
 $\chi _{A0,i} = 0.10$ in figure 15. From
 $t = 0.05$ to
 $t = 3.00$, the droplet spreads rapidly to a pancake shape with the formation of a ridge of liquid preceding the contact line. This is similar to the ridge formed in the spreading of trisiloxane-laden surfactant droplets (Rafaï et al. Reference Rafaï, Sarker, Bergeron, Meunier and Bonn2002; Karapetsas et al. Reference Karapetsas, Craster and Matar2011) and results from the rapid rate of spreading. Table 6 shows that the first spreading exponent
 $n_2$ is now significantly higher at 0.67 with the rate progressively decreasing to
 $n_3 = 0.36$ and
 $n_4 = 0.16$ (closer to Tanner's law) before the contact line retracts. This is due to the decreasing concentration gradient between the contact line and apex as ethanol evaporates and solutal Marangoni stresses weaken. Figure 18 reveals that before
 $t = 3$, surface tension is always largest towards the contact line, specifically at the apex of the ridge. The contact line can be seen retracting from
 $t = 5$ onwards while the flat plane in the droplet interior trapped by the ridge gradually decreases in height. Notice that at
 $t = 9$, the droplet centre has reached dry-out, however, the ridge at the contact line still remains. Extrapolated in the azimuthal plane to three dimensions, film dry-out leaves a torus shaped ring of liquid. This is analogous to the ring observed in the experiments conducted by Guéna et al. (Reference Guéna, Poulard and Cazabat2007) on droplets of alkane mixtures evaporating from isothermal substrates. Figure 18(c) confirms that all ethanol (component
 $A$) is depleted from the droplet by
 $t = 7.00$ and so it can be concluded that the ridge consists entirely of water (component
 $B$). Similar behaviour is also seen at
 $\chi _{A0,i} = 0.75$ (not shown), however, with a greater initial rate of
 $n_2 = 0.89$ and the emergence of three further distinct linear spreading regimes:
 $n_3 = 0.51$,
 $n_4 = 0.27$ and
 $n_5 = 0.11$. Overall retraction exponents decrease with increasing
 $\chi _{A0,i}$. As will be explained later, this is owing to the increased solutal Marangoni outward force acting against inward thermal Marangoni stresses.
Snapshots of (a) interface profile, (b) surface tension and (c) concentration of component  $A$ along the interface for an ethanol–water droplet with
 $\chi _{A0,i} = 0.50$. Dimensionless parameters are those given in table 5.

Snapshots of decomposed surface velocities for an ethanol–water droplet with  $\chi _{A0,i} = 0.50$ over its lifetime. (a) Capillary velocity, (b) solutocapillary velocity, (c) thermocapillary velocity. Dimensionless parameters are those given in table 5.

Interface profile and corresponding combined Marangoni velocity (solutal and thermal) for an ethanol–water droplet with  $\chi _{A0,i}=0.50$. Other dimensionless parameters are those given in table 5. (a)
 $t = 1.00$, (b)
 $t = 3.00$, (c)
 $t = 7.00$.

In figure 19(a) we see that  $u_{ca}$ is larger than the
 $\chi _{A0,i} = 0.10$ case at early times. Here
 $u_{ca}$ is largest at the contact line at all times, even during ridge formation. A similar trend is displayed in solutocapillary velocity as before, the key difference being that the magnitude of
 $u_{cg}$ is around four times larger when
 $\chi _{A0,i} = 0.50$ over
 $\chi _{A0,i} = 0.10$. This is expected due to the higher concentration gradient between the apex and contact line. It also appears from figure 19(b) that outward flow from
 $u_{cg}$ is negligible at
 $t = 3.00$ and this is the time at which retraction begins. The thermocapillary velocities in figure 19 show an altogether more interesting trend. Before ridge formation,
 $u_{tg}$ is of the same direction and magnitude as the
 $\chi _{A0,i} = 0.10$ case – around 0.5 directed inwards toward the droplet centre. However, as the droplet flattens and the ridge forms, a positive
 $u_{tg}$ begins to emerge on the left-hand side of the ridge. This velocity pushes fluid from the bulk droplet outwards toward the ridge while there is simultaneously a negative
 $u_{tg}$ on the right-hand side of the ridge pushing fluid inward. Physically, this means that liquid from both sides is flowing towards the ridge, sustaining its formation. As liquid flows from the thin plane on the left-hand side to feed the ridge, the removal of liquid from the thin layer causes a dimple in the interface profile to form adjacent to the ridge. This can be seen by examining
 $h$ in figure 18(a) from
 $t = 5.00$ to
 $t = 7.00$ to
 $t = 9.00$ where the ridge is shown steadily receding while the interior dries out. The reduced thickness of the interface in this region causes the liquid to be heated to a greater temperature and, hence, produces a larger surface tension gradient between the bottom of the dimple and the apex of the ridge. This then results in a stronger thermocapillary velocity from the dimple to the ridge which can be seen clearly in figure 19(c). Therefore, it appears that the initial ridge is formed due to solutocapillarity inducing very rapid spreading of the contact line. Once formed, the ridge is sustained by thermocapillarity providing a steady flow of fluid to the apex.
Finally, let us consider the combined actions of the solutal and thermal Marangoni velocities at key points in the  $\chi _{A0,i} = 0.50$ droplet lifetime. Figure 20(a) shows the interface profile and combined Marangoni velocity at
 $t = 1$ while the droplet is still firmly in the spreading regime. Figure 20(b) considers
 $t = 3.00$ when the maximum radius is reached and (c) shows the droplet well into the recession regime at
 $t = 7.00$, with the liquid film on the left-hand side of the ridge still present but close to dry-out. At
 $t = 1$, velocity is overwhelmingly directed towards the contact line with a small inward velocity at the contact line itself where liquid is warmest. Inward velocity at the contact line grows by
 $t = 3$ while outward velocity declines as ethanol evaporates. By
 $t = 7.00$, there is a clear inward Marangoni velocity from the right-hand side of the ridge as the droplet contact line recedes. The dimple in the interface profile on the left-hand side of the ridge is also visible. At the minimum point of the dimple, there is a positive and negative velocity on either side (the right- and left-hand side, respectively). This means that fluid from the dimple is driven both outwards towards the ridge at the contact line and inward towards the centre. The mechanism sustains ridge formation even after spreading has finished and only water remains in the droplet. The simultaneously decreasing dimple depth increases the strength of the Marangoni flow while intimately leading to dry-out in the interior before the contact line ridge completely evaporates.
6. Parametric analysis
As reported by Guéna et al. (Reference Guéna, Poulard and Cazabat2007), the spreading of small binary mixture sessile droplets is a complex process governed by a delicate interplay between evaporation, surface tension gradients, mass diffusion, hydrodynamic flow and capillary forces. An explicit advantage of our model over experiments is the ability to alter specific dimensionless numbers while keeping other properties constant, allowing us to assess the impact of each mechanism individually. We now briefly examine the effect of changing the magnitude of  $E$,
 $K$,
 $Ma$,
 $\sigma _R$,
 $Pe$ and
 $Re$ on the solution for
 $\chi _{A0,i} = 0.50$.
6.1. Evaporation number
Increasing evaporation number,  $E$, increases the volatility of both components in the mixture and is hence analogous to increasing the substrate temperature in an experimental scenario. In figure 21 we examine the effect of increasing and then decreasing
 $E$ by one order of magnitude over the base case value of
 $E = 2.66\times 10^{-4}$ given in table 5. Increasing
 $E$ to
 $2.66\times 10^{-3}$ simultaneously reduces spreading extent and droplet lifetime as evaporation rate of both liquids becomes larger. Decreasing
 $E$ to
 $2.66\times 10^{-5}$ (analogous to lowering the substrate temperature) has the opposite effect. With evaporation now weaker, the droplet spreads to a larger maximum radius where it remains stationary for a period before retraction. These trends are similarly reflected in the profiles of evaporative flux and ethanol mass fraction as the droplet apex shown in figures 21(c) and 21(d), respectively. We see a similar trend here as we do in our experimental findings when substrate temperature is varied – see § 4.5.
Profiles of (a) contact line position, (b) apex height, (c) apex mass flux and (d) apex mass fraction throughout the lifetime of a  $\chi _{A0,i} = 0.50$ droplet with varying evaporation number,
 $E$. Unless otherwise stated, dimensionless parameters are those given in table 5.

6.2. Knudsen number
The Knudsen number,  $K$, measures the degree of non-equilibrium at the evaporating interface. Increasing
 $K$ decreases the heat transfer rate across the interface, causing the mixture to evaporate more slowly, hence having the opposite effect to increasing
 $E$. This is shown in figure 22 where we double and half the base case value of
 $K=8.55\times 10^{-4}$ from table 5. Figure 22(c) clearly illustrates that as
 $K$ is increased, the total evaporative flux at the drop apex decreases, slowing contact line retraction and extending the lifetime of the droplet.
Profiles of (a) contact line position, (b) apex height, (c) apex mass flux and (d) apex mass fraction throughout the lifetime of a  $\chi _{A0,i} = 0.50$ droplet with varying Knudsen number,
 $K$. Unless otherwise stated, dimensionless parameters are those given in table 5.

6.3. Marangoni number
The Marangoni number controls the strength of thermal Marangoni forces and, hence, the thermocapillary velocity,  $u_{tg}$. We progressively decrease the base case value of
 $Ma = 1.64\times 10^{-1}$ to
 $9.12\times 10^{-2}$ and then
 $1.84\times 10^{-2}$, gradually weakening the thermal Marangoni stress. We see from figure 23 that reducing
 $Ma$ increases the spreading rate and maximum droplet radius. This can be explained by the reduction of inward velocity
 $u_{tg}$ which provides opposition to spreading. Droplets that spread further are thinner films leading to greater evaporative flux – see figures 23(b) and 23(c). This ultimately leads to a shorter droplet lifetime at lower
 $Ma$.
Profiles of (a) contact line position, (b) apex height, (c) apex mass flux and (d) apex mass fraction throughout the lifetime of a  $\chi _{A0,i} = 0.50$ droplet with varying Marangoni number,
 $Ma$. Unless otherwise stated, dimensionless parameters are those given in table 5.

6.4. Surface tension ratio
By increasing the surface tension ratio,  $\sigma _R$, we can strengthen solutal Marangoni forces in the droplet. Larger
 $\sigma _R$ means the surface tension of the LVC is increased relative to the MVC. When
 $\chi _{A0,i} = 0.50$, as in figure 24, the concentration induced surface tension gradient becomes larger as
 $\sigma _R$ increases. The larger surface tension gradient will amplify the outward solutocapillary velocity,
 $u_{cg}$, with liquid being more strongly drawn toward the contact line. Similar to cases with lowered Marangoni numbers, the increased spreading results in a thinner droplet subject to higher evaporative fluxes, hence resulting in shorter lifetimes.
Profiles of (a) contact line position, (b) apex height, (c) apex mass flux and (d) apex mass fraction throughout the lifetime of a  $\chi _{A0,i} = 0.50$ droplet with varying surface tension ratio,
 $\sigma _R$. Unless otherwise stated, dimensionless parameters are those given in table 5.

6.5. Péclet number
The mass diffusion is controlled by the Péclet number, with smaller values signifying more rapid diffusion of the MVC, ethanol in our case. By default, the base value in table 5 is set to  $Pe = 5$. In figure 25 we increase and decrease this by an order of magnitude. Decreasing to
 $Pe = 0.5$ causes ethanol to rapidly diffuse out of the droplet, being depleted by
 $t = 2$, see figure 25(d). Contact line spreading is abruptly halted as solutal Marangoni stresses cease and the droplet begins to retract. With limited spreading, the droplet remains relatively thick with a spherical cap profile. Only water is present after
 $t = 2$ and so evaporation is predictably slow compared to superspreading cases. Increasing
 $Pe$ to 50 means ethanol is retained in the droplet for longer times. In this case it has the effect of maintaining the surface tension gradient from apex to contact line as well as the volatility of the mixture. We can see from figure 25(d) that ethanol is present in large concentrations at the apex until dry-out, suggesting it is also present in large concentration throughout the rest of the droplet. It is the retention of ethanol that results in higher evaporation rates over the interface and ultimately leads to faster evaporation and a shorter lifetime than the base case of
 $Pe = 5$.
Profiles of (a) contact line position, (b) apex height, (c) apex mass flux and (d) apex mass fraction throughout the lifetime of a  $\chi _{A0,i} = 0.50$ droplet with varying Pélet number,
 $Pe$. Unless otherwise stated, dimensionless parameters are those given in table 5.

6.6. Reynolds number
Finally, we consider the effect of hydrodynamic flow by introducing inertia via the Reynolds number. As we have already shown in figure 10, a non-zero  $Re$ introduces oscillations in the interface profile near the apex at early times. The effect is found to be more dramatic in the binary ethanol–water droplet. In figure 26 the Reynolds number is increased from
 $Re = 0$ to
 $Re = 3$. Figure 26(a) indicates that this has little effect on the position of the contact line, however, the stronger hydrodynamic flow increases both the amplitude and frequency of the apex interface oscillations seen in figure 26(b). Closer inspection of the evaporative flux and mass fraction in figure 26(c) and 26(d), respectively, reveal similar oscillations in these fields, also increasing in amplitude and frequency with
 $Re$.
Profiles of (a) contact line position, (b) apex height, (c) apex mass flux and (d) apex mass fraction throughout the lifetime of a  $\chi _{A0,i} = 0.50$ droplet with varying Reynolds number,
 $Re$. Unless otherwise stated, dimensionless parameters are those given in table 5.

6.7. Comparison with experiments
Given the nature of our one-sided model defined in § 2, we do not attempt a direct comparison to our experimental results presented in § 4. The lifetimes of experimental droplets are several orders of magnitude longer than our one-sided model predicts once a re-dimensionalisation is performed, although we could mitigate this somewhat by controlling  $E$ and
 $K$, as shown in §§ 6.1 and 6.2. Evaporation could also be suppressed in our model by selecting a smaller accommodation coefficient in the Hertz–Knudsen expression, although this is not considered in the present study. The discrepancy between droplet lifetimes is not unexpected considering we use an accommodation coefficient of unity in our model while the experiments are performed under atmospheric air where, even at high substrate temperatures, diffusion of the vapour will play some role in evaporation. There are also additional effects of evaporative cooling and poor conductivity from the glass substrate in our experiments not accounted for in the model. Regardless, in their respective time frames, similar spreading rates (the same order of magnitude or closer) are predicted between the model and experiments, indicating that our one-sided model is sufficient to capture the main flow phenomena. The formation of a contact line ridge by our model at
 $\chi _{A0} = 0.50$ is very likely indicative of the beginning of the ‘octopi’ patterns observed in the experiments at the same initial ethanol concentration. An obvious extension of this work would be to examine the effects of introducing significantly smaller accommodation coefficients to the evaporation model, likely providing a more favourable comparison to our experiments.
7. Conclusions
In surface tension dominated flows, whether they be planar layers of sessile droplets, the addition of a second miscible component introduces solutal Marangoni stress which can compete with or enhance the already present thermal Marangoni stress. With liquids comprising of binary mixtures being a promising candidate for many modern micro cooling systems, it is essential these influences are understood. We have developed a one-sided model under the lubrication approximation to study the spreading and subsequent evaporation of volatile binary droplets consisting of an ethanol–water type mixtures deposited on a heated substrate. We considered specifically flat (low contact angle) droplets, assumed to be very thin such that their radius is much larger than their height. Droplets are released into a precursor film, resulting in a freely moving effective contact line. Additionally, we conducted an experimental investigation into ethanol–water droplets deposited on heated borosilicate glass substrates with a hydrophilic coating to encourage spreading, similar to the conditions in our numerical model. An apparatus was designed to capture the droplets from above in an aerial viewpoint and a detection algorithm written to measure the position of the contact line during spreading and recession.
Experimentally, we investigated  $1\ \mathrm {\mu }$l volumes of ethanol–water droplets comprising 11 wt.%, 25 wt.% and 50 wt.% initial ethanol concentration. The effect of increasing substrate temperature for 30
 $^{\circ }$C to 50
 $^{\circ }$C to 70
 $^{\circ }$C on droplets comprising 50 wt.% initial ethanol was also considered. We found that in all cases increasing the initial ethanol concentration, and, hence, the magnitude of solutal Marangoni stresses, enhanced droplet spreading. This led to faster spreading rates while reducing the length of the spreading phase, resulting in a slightly reduced maximum droplet radius and shorter overall droplet lifetime. When initial ethanol concentration reached 50 wt.%, a contact line instability emerges in the form of advancing fingers in an ‘octopi’ arrangement accompanied by a second instability showing spoke-like patterns arranged radially over the interface. Instabilities persist at all substrate temperatures for an initial ethanol concentration of 50 wt.%. The enhanced spreading rates cause the droplet interior to dry out before the contact line, leaving a ring where the contact line instability was previously present. The measured spreading rates closely match those predicted by our one-sided model in their respective time frames. The formation of the contact line ridge we observed in 50 wt.% initial ethanol droplets preceding instability is also predicted by our model at the same concentration.
From a theoretical point of view, we have developed a numerical model and examined in detail the effect of increasing the initial ethanol mass fraction in a binary ethanol–water droplet. We demonstrated the delicate interplay between solutal effects driving the droplet outwards and the competing thermal Marangoni stress encouraging the contact line to contract inward. With increasing strength of solutal Marangoni stress spreading rates, in some cases, were found to be compatible to those of superspreading surfactants such as trisiloxanes. In these cases, a ridge in the interface profile is formed ahead of the contact line, causing a thicker rim of liquid at the droplet edge rich in the less volatile component. This results in the droplet interior drying out before the edge, leaving the ridge to remain in the final stages of evaporation. This behaviour is similar to that seen in the alkane mixtures studied by Guéna et al. (Reference Guéna, Poulard and Cazabat2007). We observed the same qualitative behaviour from our experiments. We then went on to conduct a parametric study, investigating the effects of other important parameters significantly affecting droplet behaviour. These included the evaporation rate (via  $E$ and
 $K$), thermal Marangoni stress (via
 $Ma$), solutal Marangoni stress (via
 $\sigma _R$), mass diffusion (via
 $Pe$) and inertial effects (via
 $Re$). Although we do not attempt a direct experimental comparison due to the one-sided nature of our model, similar spreading rates are shared between the model and experimental result, suggesting that our one-sided model is sufficient to capture the main flow phenomena.
Acknowledgements
The authors gratefully acknowledge the support received from ThermaSMART project of European Commission (grant no. EC-H2020-RISE-ThermaSMART-778104). GK acknowledges the support received by the SPREAD project of Hellenic Foundation for Research and Innovation and General Secretariat for Research and Technology (grant no. 792).
Declaration of interests
The authors report no conflict of interest.


 Open access

