Historically, statistical models for forecasting the outcome of midterm elections to the United States House of Representatives have not been particularly successful (Jones and Cuzán Reference Jones and Cuzán2006). However, in what may have been a breakthrough, most models correctly predicted that the Democrats would re-emerge as the majority party in 2006 (Cuzán Reference Cuzán2007). One successful model was estimated using 46 elections, beginning with 1914 (only the second time that 435 representatives, the present number, were elected). The model was relatively simple, making use of national-level variables only (Cuzán and Bundrick Reference Cuzán and Bundrick2006). Using a similar model, I generated a forecast for the 2010 midterm election.
THE SYSTEM TO BE MODELED
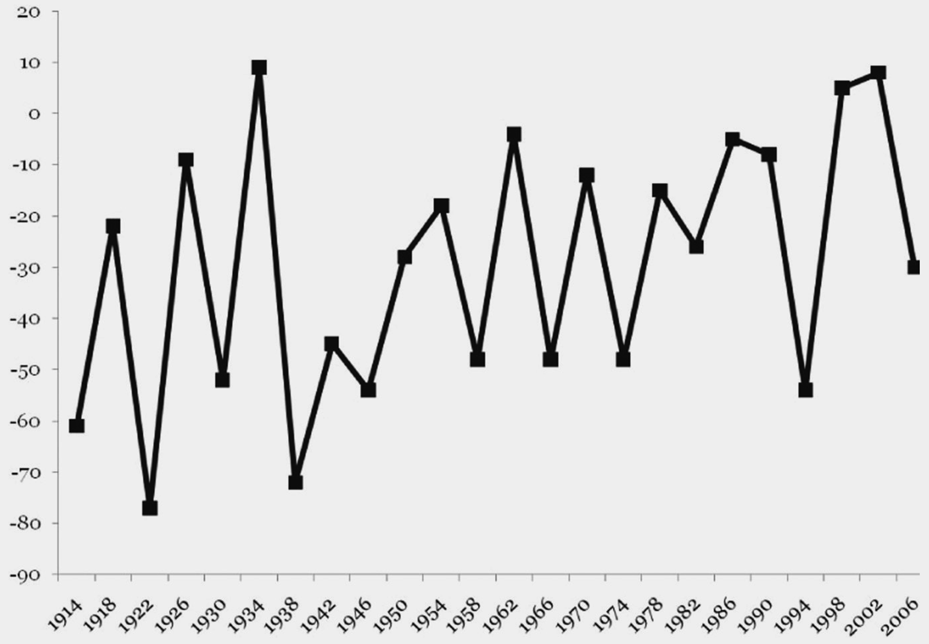
As is well known, the party of the president, the incumbent, almost always incurs a net loss of House seats in midterm elections. Since 1914, on average, the incumbent party has lost 30 seats in the midterms, although there is a good deal of variation around that number (SD = 26). As figure 1 shows, in 14 elections, the incumbents lost no more than the average; in six of those elections, the damage was limited to half that many; and in three elections, the incumbents actually gained seats, with exceptions occurring in 1934 (+9), 1998 (+5), and 2002 (+8). In most of the remaining 10 cases, the incumbent party's losses were greater than 40 seats, costing them control of the House four times (1930, 1946, 1954, and 1994).Footnote 1 If history represents actual odds, the ratio of one type of outcome to the other is 7 to 5. The big question for 2010 is: will the almost inevitable contraction in representation that the Democrats will experience in 2010 be contained, or will it be large, drastically reducing their majority or even causing Nancy Pelosi to surrender the Speaker's gavel to a Republican? To answer that question, I present an account of past outcomes with a general model. After assembling a set of causal or at least predictive factors, I take up the eponymous question.
Outcomes of Midterm Elections, 1914–2006

MODEL BUILDING
A structural model of the number of seats won by the incumbents serves as the point of departure. This model is built in steps. First, the following simple equation is estimated:

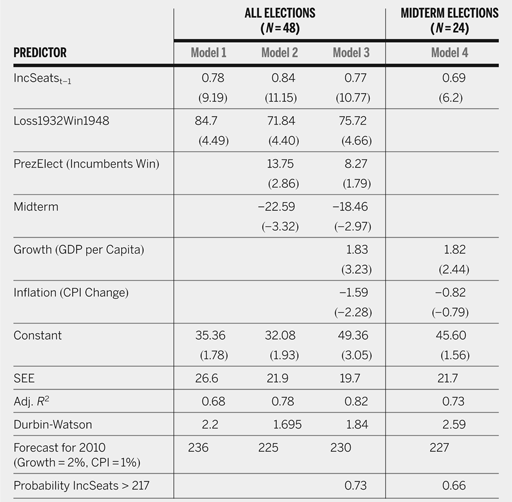
That is, the number of seats won by the president's party is calculated as a simple function of two variables. The first is the result of congressional elections lagged one two-year term. The second is a dummy variable for controlling two outliers, both of which fall in presidential election years. In the 1932 election, the Republicans lost 101 seats, the largest on record. By contrast, in 1948, the Democrats netted 75 seats, by far the biggest gain in the series. To appreciate the exceptional nature of these outcomes, consider that the average change of seats is −16 (SD = 33) across all elections, and −2 (SD = 34) across presidential elections only. The second largest loss occurred in 1938 (−72) and the second largest gain in 1964 (+36). To control for those extraordinary elections, Loss1932Gain1948 takes the value of −1 in the earlier year, 1 in the latter year, and 0 in all other years. The results of estimating this model appear in the first column of table 1. Model 1 accounts for two-thirds of the variance in the dependent variable; its standard error is 27 seats. This simple model yields a naïve point forecast of 236 seats for the incumbents in this year's midterm election, producing a net loss of 21 seats.
Estimating the Number of House Seats Won by the President's Party, 1914–2008

Sources: For seats: Office of the Clerk, U.S. House of Representatives; for GDP growth: Johnston and Williamson (Reference Johnston and Williamson2008); for CPI: Bureau of Labor Statistics. Values in parentheses are t-statistics.
Next, additional variables previously shown to have some effect on House elections (Jacobson Reference Jacobson1987; Erikson, MacKuen, and Stimson Reference Erikson, MacKuen and Stimson2002) are serially incorporated into the model. Model 2 adds two categorical variables. One is PrezElect. It indicates whether the incumbent party is returned to the White House in a presidential election year, scored 1 if the party is reelected, and −1 if it is defeated. (In a midterm election year, the variable takes the value of 0.) The other variable is Midterm, marked 1 if it is a midterm election and 0 if it is a presidential election. Observe that winning another term in the White House on average yields 27 new members from the president's party. (Since the variable ranges from −1 to 1, the coefficient has to be multiplied by two to compute its impact on seats.) This is called the “coattails effect” (Jacobson Reference Jacobson1987, 150). On the other hand, a midterm election typically costs the incumbents about 23 seats. This model forecasts that the Democrats will win 225 seats, for a net loss of 32.
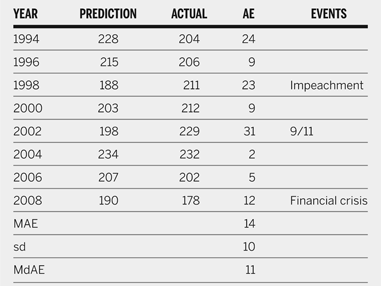
Next, in the referendum tradition pioneered by Kramer (Reference Kramer1971), the annual growth in real GDP per capita and the yearly change in the consumer price index (CPI) are incorporated into Model 3. These variables exert contrasting effects of approximately the same magnitude. With every percent point increase, one adds while the other subtracts approximately two seats from the incumbent total. Inclusion of these variables shaves off more than one-third from the coefficient of PrezElect. This effect reflects the well-established correlation between economic performance and presidential reelection and supports Jacobson's observation that the coattail effects “are erratic and usually modest” (Jacobson Reference Jacobson1987, 50). Model 3 accounts for over 80% of the variance in the dependent variable, with an SEE of 20 seats. Finally, the far-right column of table 1 displays a model estimated using midterm elections only (Model 4). Note that in this model, the effect of economic growth holds up fairly well, but the effect for inflation shrinks. Table 2 displays the performance of Model 3 in one-step-ahead forecasts, starting with the 1994 midterm election. The mean absolute error (MAE) of the forecasts is 14 seats, and the median absolute error (MdAE) is 11 seats. However, in three (1994, 1998, and 2002) of the eight cases, the absolute error was large. Two of those errors were incurred in atypical elections, when the incumbents gained rather than lost seats, and may be accounted for by extraordinary events—respectively, the backlash against the impeachment of President Clinton and the rallying effect of September 11. On the other hand, there is no obvious event that one can single out as a suspect in 1994, President Clinton's first midterm election, an electoral debacle for the Democrats that cost them control of both chambers of Congress for the first time in four decades.
One-Step-Ahead Forecasts, 1994–2008

FORECAST FOR 2010
For the purpose of generating a forecast for 2010, it is assumed that for this year, (1) real per capita GDP grows 2% and (2) inflation is limited to 1%. I arrived at these assumptions by surveying collections of economic forecasts (see, e.g., Pearson Reference Pearson2010 and Izzo Reference Izzo2010). The bottom row of table 1 displays the number of seats won by the Democrats that is obtained by injecting these economic inputs into Models 3 and 4. These numbers are 230 and 227, respectively, producing a loss of between 27 and 30 seats—about average for a midterm election. Since a loss of 40 seats is required for a party turnover, the Democrats are expected to retain their majority. The probability that they will do so is 0.73 with Model 3 and 0.66 with Model 4. Still, those probabilities mean that the chances of the GOP assuming control of the House are not trivial—between one in three and one in four. Also, recall that historically, 40% of midterm elections (10 out of 24 cases) have resulted in a loss by the incumbent party of 50 seats or more. In sum, although the model forecasts lean against it, a change in party control cannot be dismissed tout court.
DISCUSSION
The foregoing analysis suggests that when it comes to the race for control of the House of Representatives, the Democrats have the edge. They stand to lose 11% to 12% of their representation, which is average for a midterm election (M = 12%, SD = 9). That number would not be enough to dislodge Nancy Pelosi from the Speaker's chair. However, there is a nontrivial chance that 40 or more of their members will be defeated in November, an outcome that would reduce them to minority status. To evaluate that possibility in historical perspective, two previous midterm elections, both the first of a new president, will serve as reference points, although neither ultimately involved a party turnover.
In 1982, the Republicans—who two years earlier had elected Ronald Reagan president without capturing the House—lost 26 seats, or 14% of their membership. The state of the economy was a salient issue at that time, as it is this year. Its effect is incorporated into Models 3 and 4. If the Democrats lose the same share of their membership this year that the Republicans did in 1982, their representation would shrink by 36 seats. They would still retain control, although just barely, with a mere three seats to spare. The 1966 election provides another benchmark. That year, the economy experienced vigorous growth (5.3%), while inflation, though accelerating, was still somewhat contained (2.85%). Nevertheless, the Democrats lost 48 seats (16% of their membership). Other influences, which are not incorporated into any of the models in table 1, may well account for the beating that the Democrats took at the polls that year, including a backlash against the “Great Society” program.Footnote 2 Similarly, as may be gathered from surveys showing that a majority of respondents either disapprove of President Obama's performance on health care or favor repeal of the health care legislation enacted earlier this year,Footnote 3 it appears that, on balance, the Democrats' progressive program is encountering a negative public reception. If their losses in percent terms match those of 1966, their numbers will be reduced to 216, two seats short of a majority.
Summing up, according to the statistical analysis displayed in table 1, Models 3 and 4, the Democrats are forecast to lose 27 to 30 seats in November, staving off the Republican attempt to retake control. However, also according to those models, there is one chance in three or four that the Democrats will lose at least 40 seats, which would reduce them to minority status. In fact, the historical distribution of incumbent midterm losses displayed in figure 1 suggests that the odds of such an outcome occurring are around two in five. This should make the Democrats nervous—and stoke Republican hopes.
In conclusion, whether the House of Representatives undergoes a party turnover in November is contingent on some combination of random disturbances and systemic factors not included in any of the models in table 1, such as the aforementioned conservative reaction to liberal legislation, all of which are swept into the error term.Footnote 4 Hence, the answer to this article's eponymous question is an emphatic “maybe.”