



1. Introduction
Kolmogorov’s transport equation for the second-order moment of the longitudinal velocity increment
 ${\rm\Delta}u_{1}$
(Kolmogorov Reference Kolmogorov1941a
), derived from the Navier–Stokes equation, is given by (using homogeneity and isotropy)
 $$\begin{eqnarray}-\overline{({\rm\Delta}u_{1})^{3}}+6{\it\nu}\frac{\partial }{\partial r}\overline{({\rm\Delta}u_{1})^{2}}=\frac{4}{5}\overline{{\it\epsilon}}_{iso}r,\end{eqnarray}$$
with
 ${\rm\Delta}u_{1}(r)=u_{1}(x+r)-u_{1}(r)$
, where
 $u_{i}\;(i=1,2,3)$
are the velocity fluctuations in the
 $x$
,
 $y$
and
 $z$
directions, respectively. In this paper,
 $u_{1}$
,
 $u_{2}$
and
 $u_{3}$
will be used interchangeably with
 $u$
,
 $v$
and
 $w$
; similarly for
 $x_{1}$
,
 $x_{2}$
and
 $x_{3}$
and
 $x$
,
 $y$
,
 $z$
. The first term in (1.1) is the third-order structure function, while the second term represents the viscous effect. The term on the right-hand side of (1.1) is proportional to the isotropic mean energy dissipation rate
 $\overline{{\it\epsilon}}_{iso}$
(
 $=15{\it\nu}\overline{(\partial u_{1}/\partial x_{1})^{2}}$
,
 ${\it\nu}$
is the fluid kinematic viscosity) and balances the sum of the other terms. This equation is of fundamental importance since it is an equilibrium equation between second- and third-order moments and represents a mean turbulent energy balance for each scale,
 $r$
, when the Reynolds number is sufficiently large and
 $r$
is small compared with the integral length scale. In small to moderate Reynolds number flows, this equation is usually not satisfied except perhaps at small
 $r$
since (1.1) does not contain any large-scale term. Additional terms
 $I_{q}(r)$
reflecting the influence of the large scales, which may differ from flow to flow, need to be added to (1.1). For example, for decaying homogeneous and isotropic turbulence (HIT), (1.1) becomes (e.g. Danaila et al.
Reference Danaila, Anselmet, Zhou and Antonia1999; Antonia et al.
Reference Antonia, Zhou, Danaila and Anselmet2000; Danaila, Antonia & Burattini Reference Danaila, Antonia and Burattini2004; Antonia & Burattini Reference Antonia and Burattini2006)
 $$\begin{eqnarray}-\frac{3}{r^{4}}\int _{0}^{r}s^{4}\left[U\frac{\partial \overline{({\rm\Delta}u_{1})^{2}}}{\partial x}\right]\,\text{d}s-\overline{({\rm\Delta}u_{1})^{3}}+6{\it\nu}\frac{\partial }{\partial r}\overline{({\rm\Delta}u_{1})^{2}}=\frac{4}{5}\overline{{\it\epsilon}}_{iso}r,\end{eqnarray}$$
where
 $-(3/r^{4})\int _{0}^{r}s^{4}[U(\partial \overline{({\rm\Delta}u_{1})^{2}}/\partial x)]\,\text{d}s$
(
 $\equiv I_{q}$
) represents a (large scale) streamwise advection term. In (1.2),
 $s$
is a dummy variable, identifiable with the separation along
 $x$
; and
 $U$
is the (constant) mean velocity in the
 $x$
direction.
More importantly, in the limit
 $r\rightarrow 0$
, and selecting terms of order
 $r^{3}$
, (1.2) reduces to the transport equation for
 $\overline{{\it\epsilon}}_{iso}$
, viz.
 $$\begin{eqnarray}-U\frac{\text{d}\overline{{\it\epsilon}}_{iso}}{\text{d}x}=\frac{7}{3\sqrt{15}}\frac{{\overline{{\it\epsilon}}_{iso}}^{3/2}}{{\it\nu}^{1/2}}\left[S+2\frac{G}{R_{{\it\lambda}}}\right]\end{eqnarray}$$
in decaying grid turbulence. This equation was first written and tested by Batchelor & Townsend (Reference Batchelor and Townsend1947) and recently analysed in detail by Djenidi & Antonia (Reference Djenidi and Antonia2014) using direct numerical simulations.
In (1.3),
 $S$
(
 ${<}0$
) is the skewness of
 $\partial u_{1}/\partial x_{1}$
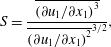 $$\begin{eqnarray}S=\frac{\overline{(\partial u_{1}/\partial x_{1})^{3}}}{\overline{(\partial u_{1}/\partial x_{1})^{2}}^{3/2}},\end{eqnarray}$$
 $G$
is the non-dimensional enstrophy destruction coefficient of
 $\overline{{\it\epsilon}}_{iso}$
 $$\begin{eqnarray}G=\overline{u_{1}^{2}}\frac{\overline{(\partial ^{2}u_{1}/\partial x_{1}^{2})^{2}}}{\overline{(\partial u_{1}/\partial x_{1})^{2}}^{2}},\end{eqnarray}$$
and
 $R_{{\it\lambda}}$
is the Taylor microscale Reynolds number
 $$\begin{eqnarray}R_{{\it\lambda}}=\frac{\overline{u^{2}}^{1/2}{\it\lambda}}{{\it\nu}},\end{eqnarray}$$
where the Taylor microscale
 ${\it\lambda}$
is defined as the ratio
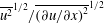 $\overline{u^{2}}^{1/2}/\overline{(\partial u/\partial x)^{2}}^{1/2}$
. If a power-law decay rate for
 $\overline{u^{2}}$
is assumed for grid turbulence, viz.
 $\overline{u^{2}}\sim x^{-n}$
, then (1.3) can be rewritten as (e.g. Thiesset, Antonia & Danaila Reference Thiesset, Antonia and Danaila2013)
 $$\begin{eqnarray}\frac{90}{7(1+2R)}\left(\frac{n+1}{n}\right)\frac{1}{R_{{\it\lambda}}}=\frac{C}{R_{{\it\lambda}}}=S+2\frac{G}{R_{{\it\lambda}}},\end{eqnarray}$$
with
 $C=(90/(7(1+2R)))((n+1)/n)$
and
 $R=\overline{v^{2}}/\overline{u^{2}}$
.
Along the axis in the far field of an axisymmetric jet flow where the flow satisfies self-preservation,
 $I_{q}(r)$
is given by (Burattini, Antonia & Danaila Reference Burattini, Antonia and Danaila2005; Thiesset et al.
Reference Thiesset, Antonia and Danaila2013)
 $$\begin{eqnarray}I_{q}(r)=-\frac{3}{r^{4}}\int _{0}^{r}s^{4}\left[U\frac{\partial \overline{({\rm\Delta}u_{1})^{2}}}{\partial x}+2(\overline{({\rm\Delta}u_{1})^{2}}-\overline{({\rm\Delta}u_{2})^{2}})\frac{\partial U}{\partial x}\right]\,\text{d}s,\end{eqnarray}$$
where the mean velocity
 $U\sim x^{-1}$
. At small
 $r$
, (1.8) reduces to (Thiesset et al.
Reference Thiesset, Antonia and Danaila2013)
 $$\begin{eqnarray}I_{q}=-U\frac{\partial \bar{{\it\epsilon}}_{iso}}{\partial x}+2\bar{{\it\epsilon}}_{iso}\frac{\partial U}{\partial x}.\end{eqnarray}$$
Thus the transport equation for
 $\overline{{\it\epsilon}}_{iso}$
can be written as
 $$\begin{eqnarray}-U\frac{\partial \bar{{\it\epsilon}}_{iso}}{\partial x}+2\bar{{\it\epsilon}}_{iso}\frac{\partial U}{\partial x}=\frac{7}{3\sqrt{15}}\frac{{\overline{{\it\epsilon}}_{iso}}^{3/2}}{{\it\nu}^{1/2}}\left[S+2\frac{G}{R_{{\it\lambda}}}\right],\end{eqnarray}$$
which can be rewritten in the form
 $$\begin{eqnarray}\frac{90}{7(2+R)}\frac{1}{R_{{\it\lambda}}}=\frac{C}{R_{{\it\lambda}}}=S+2\frac{G}{R_{{\it\lambda}}},\end{eqnarray}$$
with
 $C=90/(7(2+R))$
.
For stationary forced periodic box turbulence (SFPBT), the forcing is usually concentrated at very low wavenumbers (i.e. very large scales). For example, the large scale forcing term as used by Fukayama et al. (Reference Fukayama, Oyamada, Nakano, Gotoh and Yamamoto2000) is
 $$\begin{eqnarray}I_{q}(r)={\textstyle \frac{2}{35}}{\it\epsilon}_{in}(k_{e}r)^{2}r,\end{eqnarray}$$
where
 ${\it\epsilon}_{in}$
is the energy input rate due to external random forces concentrated at a wavenumber
 $k\simeq k_{e}$
.
One expects that for SFPBT, where the forcing is usually concentrated at very low wavenumbers, the magnitude of
 $C$
should be much smaller than for decaying turbulence or flows where forcing is spread over a range of wavenumbers. For example, the estimated ratio of the large scale forcing term to
 $S$
for the SFPBT of Fukayama et al. (Reference Fukayama, Oyamada, Nakano, Gotoh and Yamamoto2000) is approximately 0.016 at
 $R_{{\it\lambda}}=70$
(estimated from their figure 5) at small separations, while it is several orders of magnitude at
 $R_{{\it\lambda}}=460$
for the SFPBT of Gotoh, Fukayama & Nakano (Reference Gotoh, Fukayama and Nakano2002). In this case,
 $C\simeq 0$
, so that
 $$\begin{eqnarray}\frac{C}{R_{{\it\lambda}}}=S+2\frac{G}{R_{{\it\lambda}}}\simeq 0.\end{eqnarray}$$
Equations (1.7), (1.11) and (1.13) represent, in essence, a constraint on how
 $S$
varies with
 $R_{{\it\lambda}}$
in different flows. Since the ratio
 $G/R_{{\it\lambda}}$
approaches a constant relatively rapidly with increasing
 $R_{{\it\lambda}}$
(evidence for this was collected by Lee et al. (Reference Lee, Djenidi, Antonia and Danaila2013)), and the terms on the left-hand sides of (1.7), (1.11) and (1.13) must eventually vanish, the latter three equations imply that the magnitude of
 $S$
should become constant at sufficiently large
 $R_{{\it\lambda}}$
; for SFPBT,
 $S$
may become constant at a relatively small
 $R_{{\it\lambda}}$
. Such an expectation follows almost naturally from Antonia & Burattini (Reference Antonia and Burattini2006) who examined how the
 $4/5$
law (Kolmogorov Reference Kolmogorov1941a
) is approached with and without forcing.
This is consistent with
 $K41$
and the predictions of Qian (Reference Qian1994), but in contradiction with the modified similarity hypothesis of Kolmogorov (Reference Kolmogorov1962) or
 $K62$
. This latter hypothesis has spawned tremendous interest in how the normalised high-order moments of
 $\partial u_{1}/\partial x_{1}$
vary with
 $R_{{\it\lambda}}$
(e.g. Van Atta & Antonia Reference Van Atta and Antonia1980; Sreenivasan & Antonia Reference Sreenivasan and Antonia1997; Davidson Reference Davidson2004; Wyngaard Reference Wyngaard2010).
The present paper aims to provide some insight into the transport equation for
 $\overline{{\it\epsilon}}_{iso}$
along the axis in the far wake of a circular cylinder where self-preservation is satisfied to a close approximation. The far-wake has received significant attention both with respect to the type and degree of organisation of the large scale motion, but also with the characteristics of the small scale motion (e.g. Antonia & Browne Reference Antonia and Browne1986; Antonia et al.
Reference Antonia, Browne, Bisset and Fulachier1987; Browne, Antonia & Shah Reference Browne, Antonia and Shah1987; Antonia, Browne & Shah Reference Antonia, Browne and Shah1988; Bisset, Antonia & Britz Reference Bisset, Antonia and Britz1990a
; Bisset, Antonia & Browne Reference Bisset, Antonia and Browne1990b
; Brown & Roshko Reference Brown and Roshko2012). According to Danaila et al. (Reference Danaila, Anselmet, Zhou and Antonia2001), the large scale forcing term
 $I_{q}(r)$
on the axis of a plane far-wake is given by
 $$\begin{eqnarray}I_{q}(r)=-\frac{3}{r^{4}}\int _{0}^{r}s^{4}\left[U\frac{\partial \overline{({\rm\Delta}u_{1})^{2}}}{\partial x}\right]\,\text{d}s+\frac{6}{r^{4}}\int _{0}^{r}s^{4}\left[-\frac{\partial \overline{u_{2}({\rm\Delta}u_{1})^{2}}}{\partial y}\right]\,\text{d}s.\end{eqnarray}$$
The first and second terms on the right-hand side of (1.14) are the large scale forcing terms which arise from the turbulent transport of
 $\overline{({\rm\Delta}u_{1})^{2}}$
by the mean velocity
 $U$
and the lateral velocity fluctuation
 $u_{2}$
. This is different to grid turbulence (1.2), the axisymmetric jet flow along the axis (1.8) and SFPBT (1.12), thus implying that the physics associated with the transport of
 $\overline{{\it\epsilon}}_{iso}$
may differ in each flow. One then expects that the manner in which
 $S$
approaches a constant as
 $R_{{\it\lambda}}$
increases may differ from flow to flow. By considering the limit at small separations of the two-point energy budget equation, a transport equation for
 $\overline{{\it\epsilon}}_{iso}$
can be obtained. The dependence of
 $S$
on
 $R_{{\it\lambda}}$
which ensues from this equation can then be compared with measured values of
 $S$
.
This paper is structured as follows. In § 2, we derive the transport equation for
 $\overline{{\it\epsilon}}_{iso}$
which yields a relation between
 $S$
,
 $G$
and
 $R_{{\it\lambda}}$
(shown in § 3). Details associated with the measurements are described in § 4. Experimental support for this relation is discussed in § 5. The implication, based on this relation, for the dependence of
 $S$
on
 $R_{{\it\lambda}}$
when the ratio
 $G/R_{{\it\lambda}}$
is approximately constant is also given in § 5. We also discuss this implication in the context of the modified similarity hypothesis of
 $K62$
. The way in which
 $S+2G/R_{{\it\lambda}}$
approaches zero as
 $R_{{\it\lambda}}$
increases is compared with that in other flows, namely decaying grid turbulence, along the axis in the far field of an axisymmetric jet and SFPBT. Conclusions are given in § 6.
2. Transport equation for
 $\overline{{\it\epsilon}}_{iso}$
on the centreline of the far-wake

According to Danaila et al. (Reference Danaila, Anselmet, Zhou and Antonia2001), the isotropic form of the scale-by-scale energy budget equation on the axis of a plane far-wake is given by
 $$\begin{eqnarray}\displaystyle & & \displaystyle -\frac{3}{r^{4}}\int _{0}^{r}s^{4}\left[U\frac{\partial \overline{({\rm\Delta}u_{1})^{2}}}{\partial x}\right]\,\text{d}s+\frac{6}{r^{4}}\int _{0}^{r}s^{4}\left[-\frac{\partial \overline{u_{2}({\rm\Delta}u_{1})^{2}}}{\partial y}\right]\,\text{d}s-\overline{({\rm\Delta}u_{1})^{3}}\nonumber\\ \displaystyle & & \displaystyle \quad +\,6{\it\nu}\frac{\partial }{\partial r}\overline{({\rm\Delta}u_{1})^{2}}=\frac{4}{5}\overline{{\it\epsilon}}_{iso}r.\end{eqnarray}$$
Using a Taylor series expansion about
 $r=0$
,
 $\overline{({\rm\Delta}u_{1})^{2}}$
can be approximated by
 $$\begin{eqnarray}\overline{({\rm\Delta}u_{1})^{2}}\approx \overline{\left(\frac{\partial u_{1}}{\partial x}\right)^{2}}r^{2}-\frac{1}{12}\overline{\left(\frac{\partial ^{2}u_{1}}{\partial x^{2}}\right)^{2}}r^{4}+O(r^{6}),\end{eqnarray}$$
while
 $$\begin{eqnarray}\lim _{r\rightarrow 0}\frac{3}{r^{4}}\int _{0}^{r}s^{4}\left[U\frac{\partial \overline{({\rm\Delta}u_{1})^{2}}}{\partial x}\right]\,\text{d}s=\frac{1}{35}U\frac{\text{d}\overline{{\it\epsilon}}_{iso}}{\text{d}x}r^{3},\end{eqnarray}$$
and
 $$\begin{eqnarray}\displaystyle \lim _{r\rightarrow 0}\frac{6}{r^{4}}\int _{0}^{r}s^{4}\left[\frac{\partial \overline{u_{2}({\rm\Delta}u_{1})^{2}}}{\partial y}\right]\,\text{d}s & = & \displaystyle \lim _{r\rightarrow 0}\frac{6}{r^{4}}\int _{0}^{r}s^{4}\left[\frac{\partial \overline{u_{2}\left(\displaystyle \frac{\partial u_{1}}{\partial x}\right)^{2}r^{2}}}{\partial y}\right]\,\text{d}s\nonumber\\ \displaystyle & = & \displaystyle \frac{6}{7}\frac{\partial \overline{\left[u_{2}\left(\displaystyle \frac{\partial u_{1}}{\partial x}\right)^{2}\right]}}{\partial y}r^{3}.\end{eqnarray}$$
We recall that the instantaneous energy dissipation rate
 ${\it\epsilon}$
is given by (e.g. Hinze Reference Hinze1975)
 $$\begin{eqnarray}\displaystyle {\it\epsilon} & = & \displaystyle {\it\nu}\left(\frac{\partial u_{i}}{\partial x_{j}}+\frac{\partial u_{j}}{\partial x_{i}}\right)\frac{\partial u_{j}}{\partial x_{i}}\nonumber\\ \displaystyle & = & \displaystyle {\it\nu}\left\{2\left(\frac{\partial u_{1}}{\partial x_{1}}\right)^{2}+\left(\frac{\partial u_{2}}{\partial x_{1}}\right)^{2}+\left(\frac{\partial u_{3}}{\partial x_{1}}\right)^{2}+\left(\frac{\partial u_{1}}{\partial x_{2}}\right)^{2}\right.\nonumber\\ \displaystyle & & \displaystyle +\,2\left(\frac{\partial u_{2}}{\partial x_{2}}\right)^{2}+\left(\frac{\partial u_{3}}{\partial x_{2}}\right)^{2}+\left(\frac{\partial u_{1}}{\partial x_{3}}\right)^{2}+\left(\frac{\partial u_{2}}{\partial x_{3}}\right)^{2}+2\left(\frac{\partial u_{3}}{\partial x_{3}}\right)^{2}\nonumber\\ \displaystyle & & \displaystyle +\,2\left.\left(\frac{\partial u_{1}}{\partial x_{2}}\right)\left(\frac{\partial u_{2}}{\partial x_{1}}\right)+2\left(\frac{\partial u_{1}}{\partial x_{3}}\right)\left(\frac{\partial u_{3}}{\partial x_{1}}\right)+2\left(\frac{\partial u_{2}}{\partial x_{3}}\right)\left(\frac{\partial u_{3}}{\partial x_{2}}\right)\right\}.\end{eqnarray}$$
Equation (2.4) can be rewritten as follows
 $$\begin{eqnarray}\frac{6}{7}\frac{\partial \overline{\left[u_{2}\left(\displaystyle \frac{\partial u_{1}}{\partial x_{1}}\right)^{2}\right]}}{\partial x_{2}}r^{3}=\frac{3}{7{\it\nu}}\frac{\partial \overline{\left[2{\it\nu}u_{2}\left(\displaystyle \frac{\partial u_{1}}{\partial x_{1}}\right)^{2}\right]}}{\partial x_{2}}r^{3}=\frac{3}{7{\it\nu}}\frac{\partial \overline{u_{2}{\it\epsilon}_{1}}}{\partial x_{2}}r^{3},\end{eqnarray}$$
where
 ${\it\epsilon}_{1}=2{\it\nu}(\partial u_{1}/\partial x_{1})^{2}$
is only one component of the instantaneous energy dissipation rate
 ${\it\epsilon}$
.
After substituting (2.3), (2.2), (2.4) and (2.6) in (2.1), replacing
 $\lim _{r\rightarrow 0}\overline{({\rm\Delta}u_{1})^{3}}$
by
 $\overline{(\partial u_{1}/\partial x_{1})^{3}}r^{3}$
and equating terms in
 $r^{3}$
, we obtain
 $$\begin{eqnarray}-\frac{1}{35{\it\nu}}U\frac{\partial \overline{{\it\epsilon}}_{iso}}{\partial x}-\frac{3}{7{\it\nu}}\frac{\partial \overline{u_{2}{\it\epsilon}_{1}}}{\partial y}=\overline{\left(\frac{\partial u_{1}}{\partial x}\right)^{3}}+2{\it\nu}\overline{\left(\frac{\partial ^{2}u_{1}}{\partial x^{2}}\right)^{2}},\end{eqnarray}$$
which can be recast in the form
 $$\begin{eqnarray}\underbrace{\left.-\frac{1}{35{\it\nu}}U\frac{\partial \bar{{\it\epsilon}}_{iso}}{\partial x}\right/\left[\frac{\bar{{\it\epsilon}}_{iso}^{3/2}}{(15{\it\nu})^{3/2}}\right]}_{Advection}\underbrace{-\frac{3}{7{\it\nu}}\left.\frac{\partial \overline{u_{2}{\it\epsilon}_{1}}}{\partial y}\right/\left[\frac{\bar{{\it\epsilon}}_{iso}^{3/2}}{(15{\it\nu})^{3/2}}\right]}_{Diffusion}=S+2\frac{G}{R_{{\it\lambda}}}.\end{eqnarray}$$
Equation (2.8) is the transport equation for
 $\overline{{\it\epsilon}}_{iso}$
on the centreline of a far-wake. Note that it differs from the transport equation of
 $\overline{{\it\epsilon}}_{iso}$
in grid turbulence since, in addition to the streamwise advection term for
 $\overline{{\it\epsilon}}_{iso}$
on the left-hand side of (2.8), a cross-flow transport term for
 $\overline{{\it\epsilon}}_{iso}$
also contributes to the imbalance between
 $S$
and
 $2G/R_{{\it\lambda}}$
.
3. A relation for
$S$
,
$G$
and
$R_{{\it\lambda}}$
on the centreline of the far-wake


Following the same procedure as Thiesset, Antonia & Djenidi (Reference Thiesset, Antonia and Djenidi2014), Tang et al. (Reference Tang, Antonia, Djenidi and Zhou2015b
) applied a self-preservation analysis to the scale-by-scale energy budget equation and showed that in the far-wake of a cylinder the evolution of
 $\overline{{\it\epsilon}}_{iso}$
can be written as
 $$\begin{eqnarray}\frac{\overline{{\it\epsilon}}_{iso}d}{U_{\infty }^{3}}=A_{u}^{2}R_{{\it\epsilon}}(1+2R)\left(\frac{x}{d}-\frac{x_{0}}{d}\right)^{-2},\end{eqnarray}$$
where
 $x_{0}$
is the effective flow origin;
 $R=\overline{u_{2}^{2}}/\overline{u_{1}^{2}}$
which represents a measure of large scale anisotropy; the approximation
 $u_{2}^{2}=u_{3}^{2}$
, supported by the measurements on the centreline of the far wake (Hao et al.
Reference Hao, Zhou, Chua and Yu2008), was used;
 $A_{u}$
is the power-law prefactor for
 $\overline{u^{2}}^{1/2}$
, i.e.
 $$\begin{eqnarray}\frac{\overline{u^{2}}}{U_{\infty }^{2}}=A_{u}^{2}\left(\frac{x-x_{0}}{d}\right)^{-1};\end{eqnarray}$$
and
 $R_{{\it\epsilon}}$
is the ratio of the isotropic mean energy dissipation rate to the full mean energy dissipation rate, viz.
 $R_{{\it\epsilon}}=\bar{{\it\epsilon}}_{iso}/\bar{{\it\epsilon}}$
. Tang et al. (Reference Tang, Antonia, Djenidi and Zhou2015b
) also showed that the relation between
 $R_{d}$
and
 $R_{{\it\lambda}}$
is given by
 $$\begin{eqnarray}\frac{R_{{\it\lambda}}}{{R_{d}}^{1/2}}=\left[\frac{15A_{u}^{2}}{(1+2R)R_{{\it\epsilon}}}\right]^{1/2}.\end{eqnarray}$$
Equations (3.1) and (3.3) have been tested by Tang et al. (Reference Tang, Antonia, Djenidi and Zhou2015b ) and found to be well supported by measurements in the far-wake. With regard to the advection term in (2.8), we obtain, after substituting (3.1) and (3.3) into the advection term on the left-hand side of equation (2.8)
 $$\begin{eqnarray}\left.-\frac{1}{35{\it\nu}}U\frac{\partial \bar{{\it\epsilon}}_{iso}}{\partial x}\right/\left[\frac{\bar{{\it\epsilon}}_{iso}^{3/2}}{(15{\it\nu})^{3/2}}\right]=\frac{90}{7(1+2R)R_{{\it\epsilon}}R_{{\it\lambda}}}=\frac{C_{a}}{R_{{\it\lambda}}},\end{eqnarray}$$
where
 $C_{a}$
is given by
 $$\begin{eqnarray}C_{a}=\frac{90}{7(1+2R)R_{{\it\epsilon}}}.\end{eqnarray}$$
With regard to the diffusion term, figure 1 shows the distribution of
 $-(3/7{\it\nu})\overline{u_{2}{\it\epsilon}_{1}}$
, as a function of
 $y/L_{0}$
, obtained with a one-component vorticity probe (a detailed description of the probe and measurements is given in Lefeuvre et al. (Reference Lefeuvre, Djenidi, Antonia and Zhou2014);
 $R_{d}$
is 1400 and the corresponding
 $R_{{\it\lambda}}$
is approximately 40 on the centreline), where three different measurements of
 $u_{1}$
are made simultaneously with
 $u_{2}$
at each
 $y$
location. Each point shown in figure 1 is an average of three values, as obtained from three different hot wires. Interestingly, the distribution of
 $-(3/7{\it\nu})\overline{u_{2}{\it\epsilon}_{1}}$
is similar to that of
 $\overline{u_{2}u_{i}^{2}}$
(Browne et al.
Reference Browne, Antonia and Shah1987; Lefeuvre et al.
Reference Lefeuvre, Djenidi, Antonia and Zhou2014) suggesting that the diffusion of
 $\overline{q^{2}}$
(i.e. large scales) by
 $u_{2}$
has the same characteristics as the diffusion of
 ${\it\epsilon}_{1}$
(i.e. small scales) by
 $u_{2}$
. The diffusion term on the left-hand side of (2.8) is obtained by applying a seventh-order polynomial fit to the distribution of
 $-(3/7{\it\nu})\overline{u_{2}{\it\epsilon}_{1}}$
over the range
 $y/L_{0}=-0.2{-}2$
, and then normalising the slope of the fitted curve at
 $y/L_{0}=0$
with
 $\overline{{\it\epsilon}}_{iso}$
(at the centreline) and
 ${\it\nu}$
. Its magnitude on the centreline is 0.047. Since the present far-wake satisfies self-preservation to a close approximation (Tang et al.
Reference Tang, Antonia, Djenidi and Zhou2015b
), the diffusion term in (2.8) should behave as the advection term in (3.4) (
 $C_{a}/R_{{\it\lambda}}$
) but with a different constant (
 $C_{d}$
), viz.
 $$\begin{eqnarray}\left.-\frac{3}{7{\it\nu}}\frac{\partial \overline{u_{2}{\it\epsilon}_{1}}}{\partial x_{2}}\right/\left[\frac{\bar{{\it\epsilon}}_{iso}^{3/2}}{(15{\it\nu})^{3/2}}\right]=\frac{C_{d}}{R_{{\it\lambda}}},\end{eqnarray}$$
where
 $C_{d}=1.9$
(estimated at
 $R_{{\it\lambda}}=40$
, viz.
 $C_{d}/R_{{\it\lambda}}=0.047$
).
Distribution of
 $-(3/7{\it\nu})\overline{u_{2}{\it\epsilon}_{1}}$
with
 $y/L_{0}$
at
 $x/d=240$
and
 $R_{d}=1400$
(
 $R_{{\it\lambda}}=40$
on the flow centreline). The solid curve is a seventh-order polynomial fit. The horizontal dashed line corresponds to
 $\overline{u_{2}{\it\epsilon}_{1}}=0$
.

Thus, (2.8) can finally be rewritten as
 $$\begin{eqnarray}S+2\frac{G}{R_{{\it\lambda}}}=\frac{C}{R_{{\it\lambda}}},\end{eqnarray}$$
where
 $C=C_{a}+C_{d}$
. While expressions (3.5) and (3.6) show that
 $C$
is Reynolds number independent, it is possible that its numerical value depends on the cylinder geometry, which affects the large-scale motion (see also Tang et al. (Reference Tang, Antonia, Djenidi, Abe, Zhou, Danaila and Zhou2015a
) who discussed the constancy of
 $C$
and its dependence on the initial conditions).
Equation (3.7) is a relation between
 $S$
,
 $G$
,
 $R_{{\it\lambda}}$
and
 $C$
(constant) on the centreline of the far-wake. The first objective in deriving (3.7) is to assess the way
 $S+2G/R_{{\it\lambda}}$
approaches zero along the centreline of the far-wake as
 $R_{{\it\lambda}}$
increases, and to compare this approach with those observed in three other flows: decaying HIT, the axis of a turbulent round jet and SFPBT. As noted in the Introduction, since the ratio
 $G/R_{{\it\lambda}}$
approaches a constant relatively rapidly with increasing
 $R_{{\it\lambda}}$
, and the term on the right-hand side of (3.7) must eventually vanish,
 $S$
should become constant at sufficiently large
 $R_{{\it\lambda}}$
. This will be addressed in detail in § 5.
4. Experimental details
Experiments have been carried out in a non-return blower-type wind tunnel with a square cross section (350
 $\times$
350 mm) of 2.4 m in length. The inclination of the bottom wall of the working section was adjusted in order to maintain a zero streamwise pressure gradient. The wake is generated by a cylinder (
 $d=3$
, 6 or 12.6 mm), which was installed horizontally in the mid-plane and spanned the full width of the working section (figure 2). It is located 10 cm downstream of the exit plane of the contraction. This resulted in a maximum blockage of approximately 3.6 % and an aspect ratio of 28 when the bigger cylinder (
 $d=12.6~\text{mm}$
) was used. Several values of the Reynolds number
 $R_{d}=U_{\infty }d/{\it\nu}$
, based on the free-stream velocity
 $U_{\infty }$
, and the diameter of the cylinder
 $d$
, are used: 600, 1000, 2000, 3000, 4000, 5880 and 8900. The corresponding Taylor microscale Reynolds number
 $R_{{\it\lambda}}=u^{\prime }{\it\lambda}/{\it\nu}$
, based on the Taylor microscale
 ${\it\lambda}$
and
 $u^{\prime }$
, the r.m.s. of the streamwise velocity fluctuation, ranged from 23 to 123 in the far-wake. The measurement locations were at
 $x/d>170$
for all cases.
Schematic arrangement and coordinate axis.

Ratio
 $l_{w}/{\it\eta}$
. The horizontal line corresponds to
 $l_{w}/{\it\eta}=1$
. ▫,
 $R_{d}=600$
; ○, 1000; ▪, 2000; ▴, 3000; ♦, 4000; ●, 5880; ▾, 8900. Blue and red symbols correspond to
 ${\it\eta}=({\it\nu}^{3}/\overline{{\it\epsilon}}_{iso})^{1/4}$
and
 ${\it\eta}=({\it\nu}^{3}/\overline{{\it\epsilon}}_{spec})^{1/4}$
respectively. Note that for
 $R_{d}=600$
, 1000 and 2000,
 $d=3~\text{mm}$
; for
 $R_{d}=3000$
and 4000
 $d=6~\text{mm}$
; and for
 $R_{d}=5880$
and 8900
 $d=12.6~\text{mm}$
.

The Wollaston (Pt–10 %Rh) hot wires (diameter
 $d_{w}=2.5~{\rm\mu}\text{m}$
) used for the measurements are etched to an active length of approximately
 $l_{w}=0.5~\text{mm}$
. The length to diameter ratio of the wires is typically 200. In the far-wake, the ratio
 $l_{w}/{\it\eta}$
(
 ${\it\eta}=({\it\nu}^{3}/\overline{{\it\epsilon}}_{iso})^{1/4}$
is the Kolmogorov length scale) is smaller than 1 for
 $R_{d}=600$
and 1000 (see figure 3) and smaller than 2 for
 $R_{d}=2000$
, 3000, 4000, 5880 and 8900. Figure 3 shows the variations of
 $l_{w}/{\it\eta}$
(an indicator of the spatial resolution of the wire) calculated with the measured energy dissipation rate
 $\overline{{\it\epsilon}}_{spec}$
and the energy dissipation rate,
 $\overline{{\it\epsilon}}_{spec}$
, estimated from the spectral chart method of Djenidi & Antonia (Reference Djenidi and Antonia2012). The ratio
 $l_{w}/{\it\eta}$
, when
 ${\it\eta}$
is calculated using
 $\overline{{\it\epsilon}}_{spec}$
, is systematically greater than that based on
 $\overline{{\it\epsilon}}_{iso}$
, but only by about 10 % at most. The ratio
 $(l_{w}/{\it\eta}_{iso})/(l_{w}/{\it\eta}_{spec})=({\it\eta}_{spec}/{\it\eta}_{iso})=(\overline{{\it\epsilon}}_{iso}/\overline{{\it\epsilon}}_{spec})^{1/4}$
, reflects the variation of
 $(\overline{{\it\epsilon}}_{iso}/\overline{{\it\epsilon}}_{spec})$
observed in figure 7 below. Browne et al. (Reference Browne, Antonia and Shah1987), who measured all components of
 $\overline{{\it\epsilon}}$
in the far wake, also observed a difference of approximately 30 % between
 $\overline{{\it\epsilon}}$
and
 $\overline{{\it\epsilon}}_{iso}$
and showed that only
 $\overline{{\it\epsilon}}$
provided a satisfactory closure of the one-point energy budget. This gives us confidence that the values of
 $\overline{{\it\epsilon}}_{spec}$
must be very close to the actual energy dissipation rates. To determine whether or not the probe resolution can affect the estimate of
 $\overline{{\it\epsilon}}_{iso}$
we show in figure 4 the distributions of
 $(k_{1}l_{w})^{2}{\it\phi}_{u}(k_{1}l_{w})$
at
 $R_{d}=2000$
, which is the worst case scenario in the context of probe resolution. We normalized the spectra by
 $l_{w}$
because it is a fixed and accurately known quantity. It can be seen that the contributions to
 $\overline{{\it\epsilon}}_{iso}$
from wavenumbers
 $k_{1}l_{w}\geqslant 1$
(
 $k_{1}l_{w}=1$
corresponds approximately to
 $k_{1}{\it\eta}=0.5$
and is the worst case) are small for all
 $x/d$
, and become smaller as
 $x/d$
increases. This is confirmed by the ratio
 $\int _{1}^{\infty }(k_{1}l_{w})^{2}{\it\phi}_{u}(k_{1}l_{w})\,\text{d}(k_{1}l_{w})/\int _{0}^{1}(k_{1}l_{w})^{2}{\it\phi}_{u}(k_{1}l_{w})\,\text{d}(k_{1}l_{w})$
, which quantifies the relative contributions from
 $k_{1}l_{w}\geqslant 1$
and
 $k_{1}l_{w}\leqslant 1$
to
 $\overline{{\it\epsilon}}_{iso}$
. This ratio decreases from 13 % to 2 % as
 $x/d$
increases from approximately 200 to 600. For the measurements at smaller
 $R_{d}$
, the situation only improves. This provides further confidence in the estimate of
 $\overline{{\it\epsilon}}_{iso}$
. In the next section we discuss further the difference between
 $\overline{{\it\epsilon}}_{iso}$
and
 $\overline{{\it\epsilon}}_{spec}$
. The hot wires are operated with constant-temperature anemometers at an overheat ratio of 1.5. The output signals from the anemometers were passed through buck and gain circuits and low-pass filtered (the cutoff frequency
 $f_{c}$
, which was in the range 800–8000 Hz depending on the transverse position of the probe and
 $R_{d}$
). The filter cutoff frequency
 $f_{c}$
was set at approximately
 $1.4f_{{\it\eta}}$
(
 $f_{{\it\eta}}=U/2{\rm\pi}{\it\eta}$
is the Kolmogorov frequency). This is large enough to prevent any signal attenuation, even at the largest Reynolds number considered here. Further, since the major contribution to
 $\overline{{\it\epsilon}}_{iso}$
(at least 90 %) is provided by
 $k_{1}{\it\eta}\leqslant 0.5$
, it is most unlikely that our estimates of
 $\overline{{\it\epsilon}}_{iso}$
have been affected by the present cutoff frequency of the filter. The signal is then digitized into a personal computer using a 12 bit analog-to-digital (A–D) converter at a sampling frequency
 $({\approx}2f_{c})$
in the range 1600–16 000 Hz. The record duration, which varied between 100 and 140 s, is sufficient for the second- and third-order moments to converge according to the criteria proposed by Anselmet et al. (Reference Anselmet, Gagne, Hopfinger and Antonia1984) and Camussi & Guj (Reference Camussi and Guj1995).
Distributions of
 $(k_{1}l_{w})^{2}{\it\phi}_{u}(k_{1})$
at
 $R_{d}=2000$
.

5. Results
5.1. Estimates of
$R$
,
$R_{{\it\epsilon}}$
, and
$G$


The expression for the advection term, (3.4), contains two ratios:
 $R$
and
 $R_{{\it\epsilon}}$
. Before testing (3.7), the choices of
 $R$
and
 $R_{{\it\epsilon}}$
require some discussion. For
 $R_{d}=2000$
, Hao et al. (Reference Hao, Zhou, Chua and Yu2008) showed that both
 $\overline{u_{1}^{2}}/\overline{u_{2}^{2}}$
and
 $\overline{u_{1}^{2}}/\overline{u_{3}^{2}}$
are approximately 1.4 (i.e.
 $R=0.71$
) on the centreline in the far-wake of a circular cylinder. Antonia & Browne (Reference Antonia and Browne1986) and Zhou, Antonia & Tsang (Reference Zhou, Antonia and Tsang1998, Reference Zhou, Antonia and Tsang1999) found that the Reynolds stresses (
 $\overline{u_{1}^{2}}$
,
 $\overline{u_{2}^{2}}$
, and
 $\overline{u_{1}u_{2}}$
) in the far-wake collapsed reasonably well over the range
 $R_{d}=1170{-}2800$
when plotted after normalizing by the maximum velocity defect and the wake half-width. A value of
 $R$
close to 0.71 was also obtained by Zhou et al. (Reference Zhou, Antonia and Tsang1998, Reference Zhou, Antonia and Tsang1999) at
 $R_{d}=9700$
.
Streamwise variation in
 $R_{{\it\lambda}}$
on the flow centreline.
 $R_{d}=600$
, ○;
 $R_{d}=1000$
, ▫;
 $R_{d}=2000$
, ♢;
 $R_{d}=4000$
, ▵. The horizontal dashed lines indicate the mean values of the present data at each
 $R_{d}$
.

Distributions of the Kolmogorov-normalized one-dimensional longitudinal velocity spectrum and the integrand of
 $2G/R_{{\it\lambda}}$
, (5.2). (a) Normalization by
 $\bar{{\it\epsilon}}_{iso}$
and
 ${\it\nu}$
; (b) normalization by
 $\bar{{\it\epsilon}}_{spec}$
and
 ${\it\nu}$
. The black dashed curve corresponds to the DNS velocity spectrum on the centreline of a fully developed channel flow (Abe, Antonia & Kawamura Reference Abe, Antonia and Kawamura2009).
 $R_{d}=600$
, 1000, 2000, 3000, 4000, 5880 and 8900; the arrow indicates the direction
 $R_{{\it\lambda}}$
increases. (c,d) Show
 $k_{1}^{\ast 4}{\it\phi}_{u}^{\ast }(k_{1}^{\ast })$
, which correspond to the spectra in (a,b) respectively.

Tang et al. (Reference Tang, Antonia, Djenidi and Zhou2015b
) showed that the flow in the far-wake satisfies complete self-preservation to a close approximation. This hinges on
 $R_{{\it\lambda}}$
remaining constant with respect to
 $x$
. Figure 5 shows that
 $R_{{\it\lambda}}$
is indeed constant along the centreline of the far-wake for any given value of
 $R_{d}$
(note that for
 $R_{d}=4000$
, a bigger cylinder is used, see figure 2). This is further confirmed by the distributions of
 ${\it\phi}_{u}^{\ast }(k_{1}^{\ast })$
(
 ${\it\phi}_{u}^{\ast }(k_{1}^{\ast })$
is the one-dimensional spectral density of
 $u$
, defined such that
 $\int _{0}^{\infty }{\it\phi}_{u}(k_{1})\,\text{d}k_{1}=\overline{u^{2}}$
), normalized by
 $\bar{{\it\epsilon}}_{iso}$
and
 ${\it\nu}$
, at all
 $R_{d}$
as shown in figure 6(a). For a fixed
 $R_{d}$
, all spectra of
 $u$
along the
 $x$
axis in the far-wake collapse almost perfectly (this is not shown here; such a plot can be found in Tang et al. (Reference Tang, Antonia, Djenidi and Zhou2015b
)) irrespective of the combination of velocity and length scales used for normalizing
 ${\it\phi}_{u}$
, e.g. Kolmogorov velocity scale (
 $u_{K}=({\it\nu}\overline{{\it\epsilon}}_{iso})^{1/4}$
) and
 ${\it\eta}$
,
 $u^{\prime }$
and
 ${\it\lambda}$
or
 $U_{d}$
and
 $L_{0}$
. When
 $R_{d}$
is varied, the Kolmogorov-normalized spectra of
 $u$
in the far-wake region do not collapse over the low wavenumber range (figure 6
a), which is not surprising. However, the collapse is not perfect in the dissipative range; this is mainly because
 $\bar{{\it\epsilon}}_{iso}$
has been used in figure 6(a), the actual
 $\bar{{\it\epsilon}}$
not being known. This imperfect collapse is not easily discernible on the log–log scales of figure 6(a). It is however quite evident when
 $k_{1}^{\ast 4}{\it\phi}_{u}^{\ast }(k_{1}^{\ast })$
is plotted against
 $k_{1}^{\ast }$
on a linear scale, as in figure 6(c). The distributions in
 $k_{1}^{\ast 4}{\it\phi}_{u}^{\ast }(k_{1}^{\ast })$
(figure 6
c) show an unmistakable systematic decrease as
 $R_{d}$
(or
 $R_{{\it\lambda}}$
) increases. In an attempt to obtain more accurate values of the energy dissipation rate, the spectral chart method of Djenidi & Antonia (Reference Djenidi and Antonia2012) has been applied to the present spectra, when plotted in the form
 ${\it\phi}_{u}(f)$
versus
 $f$
. The ‘new’ estimates of
 $\bar{{\it\epsilon}}$
are denoted by
 $\bar{{\it\epsilon}}_{spec}$
. In essence, these values ensure that there is collapse in the upper part of the dissipative range, as illustrated in figure 6(b) (the corresponding distributions of
 $k_{1}^{\ast 4}{\it\phi}_{u}^{\ast }(k_{1}^{\ast })$
are shown in figure 6
d). Since this collapse has a solid analytical underpinning (we recall here that the assumption of local isotropy (LI) was relaxed in Antonia, Djenidi & Danaila (Reference Antonia, Djenidi and Danaila2014) to an assumption of local axisymmetry)
 $\bar{{\it\epsilon}}_{spec}$
should be very close to the true value of
 $\bar{{\it\epsilon}}$
. Whilst the collapse in figure 6(b,d) may seem contrived, the values of
 $\bar{{\it\epsilon}}_{spec}$
provided by the spectral method are in fact quite plausible, as will be seen below, and are supported by experimental estimates of
 $\bar{{\it\epsilon}}$
in the far-wake. Estimated values of the ratio
 $R_{{\it\epsilon}}=\bar{{\it\epsilon}}_{iso}/\bar{{\it\epsilon}}_{spec}$
, where
 $\bar{{\it\epsilon}}_{iso}$
is inferred from measured values of
 $\overline{(\partial u/\partial x)^{2}}$
and
 $\bar{{\it\epsilon}}_{spec}$
is estimated via the spectral chart, are shown in figure 7. Antonia & Browne (Reference Antonia and Browne1986) and Browne et al. (Reference Browne, Antonia and Shah1987) measured all components of
 $\overline{{\it\epsilon}}$
at
 $R_{d}=1170$
and were able to close the one-point energy budget, at least indirectly (the pressure term was not measured but was inferred by difference; its integration across the wake yielded a value close to zero). They found that
 $R_{{\it\epsilon}}=0.7$
, i.e. a significant difference between
 $\bar{{\it\epsilon}}_{iso}$
and
 $\bar{{\it\epsilon}}$
. Also included is the analytical estimate of Tang et al. (Reference Tang, Antonia, Djenidi and Zhou2015b
) for
 $R_{d}=2000$
and the estimates by Champagne (Reference Champagne1978) for
 $R_{{\it\lambda}}=138$
and 182, respectively. All these data are in reasonable agreement with each other.
 $R_{{\it\epsilon}}$
is expected to approach the value of one at sufficiently large
 $R_{{\it\lambda}}$
, which is consistent with figure 7. For
 $R_{{\it\lambda}}\geqslant 130$
,
 $R_{{\it\epsilon}}\simeq 1.0$
. We recall that (2.1) was obtained along the axis in the far-wake with the assumption of LI. Figure 7 shows that this assumption becomes more tenable as
 $R_{{\it\lambda}}$
increases. The departure from LI is approximately 10 % at
 $R_{{\it\lambda}}\simeq 100$
and LI, at least in the context of
 $\bar{{\it\epsilon}}\simeq \bar{{\it\epsilon}}_{iso}$
, seems to be satisfied adequately for
 $R_{{\it\lambda}}\geqslant 130$
. When testing (3.7), a polynomial fit to the distribution of
 $R_{{\it\epsilon}}$
is used, i.e.
 $R_{{\it\epsilon}}=f(R_{{\it\lambda}})$
, which is also shown in figure 7.
Variation of
 $R_{{\it\epsilon}}=\bar{{\it\epsilon}}_{iso}/\bar{{\it\epsilon}}_{spec}$
with
 $R_{{\it\lambda}}$
. ●, present data;
 $\times$
, Tang et al. (Reference Tang, Antonia, Djenidi and Zhou2015b
); ▪, Browne et al. (Reference Browne, Antonia and Shah1987); ✩, Champagne (Reference Champagne1978). The solid curve is a polynomial fit to all the data.

To estimate
 $G$
, a uniform treatment was applied to the measured distributions of
 ${\it\phi}_{u}^{\ast }(k_{1}^{\ast })$
(figure 6
b) primarily to avoid the effects of noise contamination and possible inadequate spatial resolution of the hot wire. It can be seen from figure 6(b) that, for
 $k_{1}^{\ast }>0.7{-}1$
(depending on
 $R_{{\it\lambda}}$
), the spectra are affected by high-frequency noise. Nevertheless, all the measured and DNS spectra collapse well in the range of
 $k_{1}^{\ast }<0.7{-}1$
. The measured spectrum beyond
 $k_{1}^{\ast }\approx 0.7{-}1$
(the precise value depends on
 $R_{{\it\lambda}}$
) was ignored and a suitable fit to the well resolved DNS data (see figure 6
b,d) was applied to the lower end of the dissipation range before extrapolating to a value of
 $k_{1}^{\ast }$
of 2. The robustness of the collapse of the spectra at sufficiently large
 $k_{1}^{\ast }$
underpins the extrapolation used here for estimating
 $G$
. There is now ample experimental, numerical and theoretical evidence that a significant portion of the Kolmogorov normalized spectrum beyond
 $k_{1}^{\ast }\approx 0.5$
is universal (see for example Antonia et al. (Reference Antonia, Djenidi and Danaila2014)) which justifies the extrapolation of the spectrum in the dissipative range (details of the procedure are given in Tang et al. (Reference Tang, Antonia, Djenidi, Abe, Zhou, Danaila and Zhou2015a
), see also Lee et al. (Reference Lee, Djenidi, Antonia and Danaila2013), and are not repeated here).
The term
 $G$
, defined by (1.5), can be rewritten as
 $$\begin{eqnarray}G=\frac{\overline{u_{1}^{\ast 2}}\overline{(\partial ^{2}u_{1}^{\ast }/\partial x_{1}^{\ast 2})^{2}}}{\overline{(\partial u_{1}^{\ast }/\partial x_{1}^{\ast })^{2}}^{2}},\end{eqnarray}$$
where the asterisk denotes normalization by the Kolmogorov scales. If LI holds, so that
 $\overline{{\it\epsilon}}=\overline{{\it\epsilon}}_{iso}$
, (5.1) can be rewritten as
 $$\begin{eqnarray}\frac{2G}{R_{{\it\lambda}}}=2\times 15^{3/2}\int _{0}^{\infty }{k_{1}^{\ast }}^{4}{\it\phi}_{u}^{\ast }(k_{1}^{\ast })\,\text{d}k_{1}^{\ast }.\end{eqnarray}$$
However, if there is a departure from LI, then
 $2G/R_{{\it\lambda}}$
should be estimated using
 $$\begin{eqnarray}\frac{2G}{R_{{\it\lambda}}}=2{\it\nu}\frac{\displaystyle \int _{0}^{\infty }{k_{1}}^{4}{\it\phi}_{u}(k_{1})\,\text{d}k_{1}}{\left[\displaystyle \int _{0}^{\infty }{k_{1}}^{2}{\it\phi}_{u}(k_{1})\,\text{d}k_{1}\right]^{3/2}}.\end{eqnarray}$$
As seen earlier, there are departures from LI for
 $R_{{\it\lambda}}\leqslant 130$
along the centreline of the far-wake. Here, we estimate
 $2G/R_{{\it\lambda}}$
from (5.3) after extrapolation of
 ${\it\phi}_{u}^{\ast }(k_{1}^{\ast })$
(figure 6
b) and converting
 ${\it\phi}_{u}^{\ast }(k_{1}^{\ast })$
to
 ${\it\phi}_{u}(k_{1})$
. As an example, two sets of values
 $2G/R_{{\it\lambda}}$
(
 $R_{d}=1000$
and 2000) are shown in figure 8. Also shown are the corresponding values of
 $S$
at these two
 $R_{d}$
. It is clear that both
 $2G/R_{{\it\lambda}}$
and
 $S$
are constant in the far-wake since the flow satisfies complete self-preservation quite closely. Thus, for the present data, each value of
 $2G/R_{{\it\lambda}}$
and
 $S$
, (also
 $S+2G/R_{{\it\lambda}}$
), shown hereafter is an average of values measured at several
 $x$
locations (
 ${\geqslant}170d$
) since they do not vary (see figure 8) with
 $x$
. For
 $R_{d}=5880$
and 8900, measurements were made at only one location (see figure 3).
Variation of
 $2G/R_{{\it\lambda}}$
and
 $S$
with
 $x/d$
for
 $R_{d}=1000$
(pink) and 2000 (blue). The horizontal dashed line indicates the mean value for each of the plotted quantities.

5.2. Boundedness of
$S$

Estimates of
 $2G/R_{{\it\lambda}}$
for the present flow are shown in figure 9. Also included in figure 9 are estimates inferred from measured spectra along the axis of a pipe by Rosenberg et al. (Reference Rosenberg, Hultmark, Vallikivi, Bailey and Smits2013) and the active grid turbulence investigated by Larssen & Devenport (Reference Larssen and Devenport2011). Both sets of measurements were carried out over a relatively large range of
 $R_{{\it\lambda}}$
. Antonia et al. (Reference Antonia, Tang, Djenidi and Danaila2015) and Tang et al. (Reference Tang, Antonia, Djenidi, Abe, Zhou, Danaila and Zhou2015a
) showed that
 $2G/R_{{\it\lambda}}$
is very nearly constant (
 ${\approx}0.52$
) for
 $R_{{\it\lambda}}\geqslant 70$
in various flows such as along the axis of a pipe, grid turbulence and along the centreline of the channel, while the constancy of
 $2G/R_{{\it\lambda}}$
is achieved at smaller
 $R_{{\it\lambda}}$
in SFPBT. For the present flow along the centreline of the far-wake, the approach appears to become slower (
 $R_{{\it\lambda}}\geqslant 100$
) than the other flows considered by Antonia et al. (Reference Antonia, Tang, Djenidi and Danaila2015) and Tang et al. (Reference Tang, Antonia, Djenidi, Abe, Zhou, Danaila and Zhou2015a
), possibly due to the departure from LI along the centreline of the far-wake.
Dependence of
 $2G/R_{{\it\lambda}}$
on
 $R_{{\it\lambda}}$
along the centreline of the far-wake: ○, present data; ▿, Lefeuvre et al. (Reference Lefeuvre, Djenidi, Antonia and Zhou2014) (
 $R_{{\it\lambda}}=40$
); ✩, Champagne (Reference Champagne1978). Estimates from Larssen & Devenport (Reference Larssen and Devenport2011) (▿) and Rosenberg et al. (Reference Rosenberg, Hultmark, Vallikivi, Bailey and Smits2013) (♢) are also shown for the purpose of comparison.

Antonia et al. (Reference Antonia, Tang, Djenidi and Danaila2015) and Tang et al. (Reference Tang, Antonia, Djenidi, Abe, Zhou, Danaila and Zhou2015a
) showed that
 $-S$
should approach a universal constant when
 $R_{{\it\lambda}}$
is sufficiently large, but the way this constant is approached depends on the flow and, for a given flow, is likely to depend on the initial conditions. For example, the approach is slow in grid turbulence and along the centreline of a channel but rapid along the axis of a round jet. The values of
 $-S$
for the present flow are shown in figure 10 as a function of
 $R_{{\it\lambda}}$
. Also included are the data of Antonia, Zhou & Romano (Reference Antonia, Zhou and Romano2002) measured at
 $x/d=70$
of a circular cylinder. For reference, the analytical prediction of Qian (Reference Qian1994) (green curve) are shown, whereas the data for other flows, such as grid turbulence, the centreline of a channel and the axis of a round jet are not shown since they have been discussed in detail by Antonia et al. (Reference Antonia, Tang, Djenidi and Danaila2015) and Tang et al. (Reference Tang, Antonia, Djenidi, Abe, Zhou, Danaila and Zhou2015a
). As noted by Antonia et al. (Reference Antonia, Tang, Djenidi and Danaila2015) and Tang et al. (Reference Tang, Antonia, Djenidi, Abe, Zhou, Danaila and Zhou2015a
), the magnitude of
 $S$
should be virtually constant in SFPBT; the value of 0.52 is in good agreement with the analytical prediction of Qian (Reference Qian1994). For the self-preserving cylinder wake data,
 $-S$
decreases initially as
 $R_{{\it\lambda}}$
increases between 20 and 40. For
 $R_{{\it\lambda}}>40$
,
 $-S$
starts to increase slowly up to
 $R_{{\it\lambda}}\simeq 100$
and somewhat more rapidly beyond
 $R_{{\it\lambda}}=100$
. The main message of figure 10 is that the magnitude of
 $S$
and its variation with
 $R_{{\it\lambda}}$
differs between the two flows. More importantly, the distribution of
 $S$
, estimated from
 $S=C/R_{{\it\lambda}}-2G/R_{{\it\lambda}}$
after assuming
 $2G/R_{{\it\lambda}}=\text{const.}$
(
 ${\approx}0.52$
for
 $R_{{\it\lambda}}>90$
) is reasonably well supported by the present two data points (
 $R_{{\it\lambda}}=94$
and 124) as well as the data of Champagne (Reference Champagne1978) at
 $x/d=299$
, and Antonia et al. (Reference Antonia, Zhou and Romano2002) at
 $x/d=70$
. Interestingly, the behaviour of
 $S$
with
 $R_{{\it\lambda}}$
is reminiscent of that observed in decaying HIT (Tavoularis, Bennett & Corrsin Reference Tavoularis, Bennett and Corrsin1978; Mansour & Wray Reference Mansour and Wray1994). It was found as
 $R_{{\it\lambda}}$
increases from very low values,
 $-S$
first increases, reaches a local maximum, decreases and increases again. There is no explanation yet for this behaviour.
Dependence of
 $-S$
on
 $R_{{\it\lambda}}$
along the centreline of the far-wake: ○, present data; ▵, Browne et al. (Reference Browne, Antonia and Shah1987); ▿, Lefeuvre et al. (Reference Lefeuvre, Djenidi, Antonia and Zhou2014); ✩, Champagne (Reference Champagne1978). For reference, the prediction of Qian (Reference Qian1994) (green curve) and the data for SFPBT are shown. Also included are the data of Antonia et al. (Reference Antonia, Zhou and Romano2002) measured at
 $x/d=70$
of a circular cylinder (
 $\bullet$
). The pink curve is inferred from
 $S=C/R_{{\it\lambda}}-2G/R_{{\it\lambda}}$
by assuming
 $2G/R_{{\it\lambda}}=\text{const.}$
(
 ${\approx}0.52$
for
 $R_{{\it\lambda}}>90$
) on the centreline of the far-wake.

Dependence of
 $S+2G/R_{{\it\lambda}}$
on
 $R_{{\it\lambda}}$
along the centreline of the far-wake: ○; present data; ▿, Lefeuvre et al. (Reference Lefeuvre, Djenidi, Antonia and Zhou2014); ✩, Champagne (Reference Champagne1978); four curves (pink solid, black solid, dash-dotted and dotted curves), inferred from (3.7) (
 $C$
is flow-dependent), correspond to the centreline of the far-wake, grid turbulence, the axis of a round jet and SFPBT, respectively.

Figure 11 shows
 $S+2G/R_{{\it\lambda}}$
versus
 $R_{{\it\lambda}}$
in different flows. In this figure, the 4 curves (pink solid, black solid, dash-dotted and dotted curves) inferred from (3.7), where
 $C$
is a flow-dependent constant as noted in the Introduction, correspond to the centreline of a self-preserving cylinder wake, grid turbulence, the axis of a round jet and SFPBT, respectively. Symbols are the experimental data for the present wake. It can be seen from this figure that, along the centreline of the wake, the approach is reasonably well supported by the experimental data. The further following comments can be made on the basis of the results in figures 9–11: (i) due to the fundamental constraint of the mean transport equation for
 $\overline{{\it\epsilon}}_{iso}$
for the flow along the wake centreline,
 $S+2G/R_{{\it\lambda}}$
approaches its stationary state (
 $S+2G/R_{{\it\lambda}}=0$
) along a path which is different from that in other flows. The approach is slow for the present flow and rapid along the axis of a round jet; (ii) since the term
 $C/R_{{\it\lambda}}$
should become negligible at sufficiently large
 $R_{{\it\lambda}}$
for the present flow,
 $-S$
cannot grow unboundedly as
 $R_{{\it\lambda}}$
increases since
 $2G/R_{{\it\lambda}}$
approaches a constant relatively rapidly with increasing
 $R_{{\it\lambda}}$
(figure 9). This is consistent with
 $K41$
and the prediction of Qian (Reference Qian1994). It is also consistent with the predictions of Tennekes (Reference Tennekes1968) based on a vortex tube model and the heuristic model of Saffman (Reference Saffman1970). Further, it does not contravene Ishihara’s expectation (Ishihara et al.
Reference Ishihara, Kaneda, Yokokawa, Itakura and Uno2007) that ‘as
 $R_{{\it\lambda}}\rightarrow \infty$
,
 $-S$
approaches a constant independent of
 $R_{{\it\lambda}}$
but the approach may be slow’. We should also finally note that for the forced flow between counter-rotating disks (Tabeling et al.
Reference Tabeling, Zocchi, Belin, Maurer and Willaime1996; Belin et al.
Reference Belin, Maurer, Tabeling and Willaime1997),
 $-S$
is practically constant (
 ${\approx}0.50$
) over the range
 $170\leqslant R_{{\it\lambda}}\leqslant 2000$
notwithstanding a transition at
 $R_{{\it\lambda}}\approx 700$
; these data are not shown in figure 10 as they have been discussed in some detail in Antonia et al. (Reference Antonia, Tang, Djenidi and Danaila2015). It is not however consistent with
 $K62$
or the predictions from lognormal and fractal models, (e.g. Frisch, Sulem & Nelkin Reference Frisch, Sulem and Nelkin1978; Van Atta & Antonia Reference Van Atta and Antonia1980; Frisch Reference Frisch1996; Sreenivasan & Antonia Reference Sreenivasan and Antonia1997; Davidson Reference Davidson2004; Wyngaard Reference Wyngaard2010). Strictly, predictions from
 $K62$
, as with
 $K41$
, should be tested at very large
 $R_{{\it\lambda}}$
, and under conditions for which LI holds. Unfortunately, this has not been the case since laboratory data, typically obtained in the range
 $40<R_{{\it\lambda}}<1000$
, have been used. For these data, the finite Reynolds number effect, which is intimately linked to the dependency of
 $C$
on the flow, cannot be ignored. Nor can the departure from LI be completely dismissed. High
 $R_{{\it\lambda}}$
atmospheric surface layer (ASL) data have also been used in conjunction with laboratory data for testing
 $K62$
. Indeed, these data have been instrumental in the context of providing support for
 $K62$
. As noted in Antonia et al. (Reference Antonia, Tang, Djenidi and Danaila2015), we cannot however be certain that the ASL data, which were mostly obtained in relatively close proximity to the ground or ocean surface, have not been adversely affected by this proximity.
Finally, it is worthwhile mentioning that the present analysis, which can be applied to other flows, has repercussions for turbulence modelling. For example, Thiesset et al. (Reference Thiesset, Antonia and Djenidi2014), who applied the analysis to the axis of a turbulent round jet, discussed how new insights can be gained, and in particular, how some turbulence models can be improved. For example, they showed how (
 $S+2G/R_{{\it\lambda}}=C/R_{{\it\lambda}}$
) can be used to determine the important model constant
 $C_{{\it\epsilon}2}$
used in the
 $k{-}{\it\epsilon}$
model; they showed that
 $C_{{\it\epsilon}2}=7/8$
on the axis of the turbulent round jet and
 $(n+1)/n$
in decaying grid turbulence. We can repeat the same analysis of Thiesset et al. (Reference Thiesset, Antonia and Djenidi2014) to obtain an expression for
 $C_{{\it\epsilon}2}$
. We can write (2.8) as
 $$\begin{eqnarray}-U\frac{\partial \overline{{\it\epsilon}}_{iso}}{\partial x}-\frac{3}{7{\it\nu}}\frac{\partial \overline{u_{2}{\it\epsilon}_{1}}}{\partial x_{2}}=C_{{\it\epsilon}2}\frac{{\it\epsilon}_{iso}^{2}}{k}\frac{1}{R_{{\it\epsilon}}^{2}},\end{eqnarray}$$
which, after trivial manipulation, leads to
 $$\begin{eqnarray}C_{{\it\epsilon}2}={\textstyle \frac{7}{90}}R_{{\it\epsilon}}^{2}(1+2R)(SR_{{\it\lambda}}+2G).\end{eqnarray}$$
Combining (3.4), (3.6) and (3.7) into the above expression yields
 $$\begin{eqnarray}C_{{\it\epsilon}2}=R_{{\it\epsilon}}+{\textstyle \frac{7}{90}}C_{d}R_{{\it\epsilon}}^{2}(1+2R).\end{eqnarray}$$
If one assumes,
 $R_{{\it\epsilon}}=1$
(as expected at large
 $R_{{\it\lambda}}$
) and
 $R=0.71$
(as measured by Hao et al. (Reference Hao, Zhou, Chua and Yu2008)), one then obtains
 $C_{{\it\epsilon}2}=1.36$
along the centreline of the far-wake. As anticipated, this value differs from both those obtained in decaying grid turbulence and along the axis of a turbulent round jet.
6. Conclusions and concluding discussion
The transport equation for the isotropic turbulent energy dissipation rate
 $\overline{{\it\epsilon}}_{iso}$
along the centreline in the far-wake of a circular cylinder is derived by applying the limit at small separation to the two-point energy budget equation. It is found that the imbalance between the production and the destruction of
 $\overline{{\it\epsilon}}_{iso}$
, respectively due to vortex stretching and viscosity, is governed by both the streamwise advection and the lateral turbulent diffusion (the former contributes more to the budget than the latter). This imbalance is intrinsically different from that in other flows, e.g. grid turbulence, and along the centreline of a fully developed channel flow, where either the streamwise advection or the lateral turbulent diffusion of
 $\overline{{\it\epsilon}}_{iso}$
governs the imbalance. It is also different from that in SFPBT where, by definition, the production of
 $\overline{{\it\epsilon}}_{iso}$
is equal to the destruction of
 $\overline{{\it\epsilon}}_{iso}$
.
As pointed out by Antonia et al. (Reference Antonia, Tang, Djenidi and Danaila2015) and Tang et al. (Reference Tang, Antonia, Djenidi, Abe, Zhou, Danaila and Zhou2015a
), the different types of imbalance represent different constraints on the relation between the skewness of the longitudinal velocity derivative
 $S$
and the enstrophy destruction coefficient
 $G$
in different flows, i.e.
 $S+2G/R_{{\it\lambda}}$
approaches the asymptotic state differently in different flows even though
 $S+2G/R_{{\it\lambda}}\propto R_{{\it\lambda}}^{-1}$
in each case. For example, the approach to zero is slow for the present flow and rapid along the axis of a round jet. This difference reflects, in essence, the different physical processes involved at large scales in the energy budget for these two cases. Along the axis of an axisymmetric jet,
 $\overline{{\it\epsilon}}$
is balanced by the advection of
 $\overline{q^{2}}$
along
 $x$
and a small contribution from production terms associated with the normal Reynolds stresses. On the centreline of the far-wake,
 $\overline{{\it\epsilon}}$
is balanced by the advection of
 $\overline{q^{2}}$
along
 $x$
and an almost equal contribution from the diffusion of
 $\overline{q^{2}}$
due to
 $v$
(i.e. the ratio of the advection term to diffusion term is approximately one). The same physical processes remain at play in the (small scale) budget of
 $\overline{{\it\epsilon}}_{iso}$
while the advection term contributes more to the budget than the diffusion term. Since figure 9 indicates that
 $2G/R_{{\it\lambda}}$
becomes constant at relatively small
 $R_{{\it\lambda}}$
, the combination of figures 9 and 11 suggests that
 $S$
should become constant in the far-wake at a sufficiently large
 $R_{{\it\lambda}}$
, which is strongly supported by figure 10. It should be noted that, for any given flow, there is evidence that
 $S$
may also depend on initial conditions as reflected for example by the difference in
 $S$
between different simulations or between simulations and experiments along the centreline of a fully developed channel flow (Tang et al.
Reference Tang, Antonia, Djenidi, Abe, Zhou, Danaila and Zhou2015a
).
It is clear that figures 9–11 have major implications in the context of testing predictions ensuing from
 $K41$
and
 $K62$
. All previous investigations have included laboratory data for
 $S$
obtained in a number of flows over the same range of
 $R_{{\it\lambda}}$
as in figure 10 without recognising the different types of large scale inhomogeneity that are present in different flows. This is tantamount to ignoring the different finite Reynolds number effects that exist in the different flows. Consequently, previous work which advocates a unique power-law dependence
 $|S|\sim R_{{\it\lambda}}^{{\it\alpha}}$
(
 ${\it\alpha}>0$
) must be shrouded with ambiguity and hence treated with caution. However, since complete self-preservation is satisfied, to quite a close approximation, in the far-wake,
 $S$
,
 $2G/R_{{\it\lambda}}$
, and
 $R_{{\it\lambda}}$
do not vary with
 $x$
, thus removing any ambiguity when plotting
 $S+2G/R_{{\it\lambda}}$
versus
 $R_{{\it\lambda}}$
in the far-wake. The main message conveyed by figures 9–11 is that
 $S$
is most likely to be bounded in the far-wake, provided the effect of the Reynolds number is negligible. This result is in conflict with
 $K62$
but is in agreement with
 $K41$
. It is important to stress that
 $K62$
is based solely on phenomenological arguments which, in view of the present results, seems to conflict with the self-preservation constraints imposed on the Navier–Stokes equations. Clearly, further work will be needed both to confirm the present result and assess if the
 $R_{{\it\lambda}}$
dependence of higher order moments of
 $\partial u/\partial x$
, e.g. the flatness factor (
 $F=\overline{(\partial u/\partial x)^{4}}/\overline{(\partial u/\partial x)^{2}}^{2}$
) are, like
 $S$
, also bounded at sufficiently large
 $R_{{\it\lambda}}$
, once the appropriate constraint derived from the N–S equations is established. Such a possibility was anticipated by Qian (Reference Qian1986).
Acknowledgement
The financial support by the Australian Research Council is acknowledged.



