Implications
This study represents a contribution to reducing nitrogen excretion from pig slurry, which is achieved by decreasing the protein levels within the range of values used in the current production systems. Even the reduction of protein level in small ranges, from 10 to 20 g/kg, leads to a reduction of environmental pollution in real terms.
Introduction
The intensification of pig production has raised concerns about its potential to cause pollution. As a consequence, nutrition and pig management have been examined as a possible means of reducing environmental pollution and of contributing to more sustainable pig production. In a review of the potential impacts of diet modification to reduce odour production from swine slurry, Sutton et al. (Reference Sutton, Kephart, Verstegen, Cahn and Hobbs1999) pointed nitrogen (N), ammonia (NH3) and volatile fatty acids (VFA) as among the most important components, and dietary crude protein (CP) as being one of the most important sources of environmental pollution from pig slurry. There is growing interest in the manipulation of dietary CP as a means of reducing N excretion and NH3 losses from pig production. About 60% to 70% of the N from the diet fed to the pigs is excreted in the faeces and urine. N excreted in faeces is mainly present in the form of proteins, of dietary or endogenous origin, which are less susceptible to rapid decomposition, whereas the N excreted in urine is mainly in the form of urea, which is easily converted into ammonium and carbonate by urease enzyme (Van der Peet-Schwering et al., Reference Van der Peet-Schwering, Aarnink, Rom and Dourmad1999). Furthermore, previous research has indicated that reducing the concentration of dietary CP and supplementing with essential amino acids could reduce environmental pollution without influencing the animal growth rate. Thus, O'Connell et al. (Reference O'Connell, Callan and O'Doherty2006) observed that the excretion of N, NH3 and VFA could be reduced if dietary protein levels were lowered from 22% to 16%. Similarly, Hayes et al. (Reference Hayes, Leek, Curran, Dodd, Carton, Beattie and O'Doherty2004), Portejoie et al. (Reference Portejoie, Dourmad, Martinez and Lebreton2004) and Le et al. (Reference Le, Aarnink and Jongbloed2009) observed that NH3 emissions from pig manure can be reduced by decreasing dietary CP from 22% to 13%, from 20% to 12% and from 18% to 12%, respectively. The above-mentioned experiments used much contrasted dietary CP levels, and therefore generated greater differences in N excretion values. Legislation can help to achieve a better balance in nutrient input and output, and the European Commission has made great efforts to ensure the sustainable growth of the livestock sector by proposing the Best Available Technique (BAT) Reference Document (BREF) for intensive agriculture (BREF, 2003). This suggests a range of CP values for inclusion in the feed of growing and finishing pigs (150 to 170 g CP/kg and 140 to 150 g CP/kg, respectively) in order to reduce environmental pollution. The aim of this research was to investigate the influence of three different feeding programmes with different concentrations of dietary CP (closer to the recommendations of the BREF) on the N balance, NH3 emission and other pollutant characteristics of pig slurry.
Material and methods
Diets
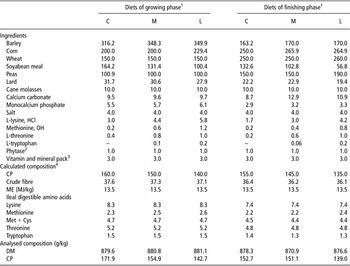
Three feeding programmes with different CP levels were compared in this experiment during the two phases: growing and finishing. A control diet (C) was formulated according to the CP standards recommended by the Spanish Foundation for the Development of Animal Nutrition (FEDNA, 2006), with 160 and 155 g CP/kg for the growing and finishing phase, respectively, and two experimental diets with 10 (medium-level diet, M) and 20 g CP/kg (low-level diet, L), less than the control for both phases. This resulted in the formulation of six experimental diets. The composition calculated and analysed are shown in Table 1. The protein level of the M and L diets were close to the minimum value recommended by BREF (2003). Diets were formulated to be isoenergetic (13.5 MJ of ME/kg; ME, metabolisable energy) and to make the digestible lysine : ME ratio similar in all the diets, for each phase. The diets were formulated in ‘ideal protein’ according to the recommendations of FEDNA (2006), using commercially available feed-used amino acids.
Ingredient composition and analysed chemical composition of the experimental diets in growing and finishing phases (g/kg as fed)

ME = metabolisable energy; Met + Cys = methionine + cystine; DM = dry matter.
1Diets: C: control diet, diet with higher protein content, M: diet with medium protein content, L: diet with low protein content.
2Setnazyme phytase, 500 FTU/kg. Finase® Pc, AB Enzymes GmbH, Germany.
3The mineral and vitamin premix provided (per kilogram diet): 8000 IU vitamin A, 1100 IU vitamin D3, 25 IU vitamin E, 1 mg vitamin K3, 1 mg vitamin B1, 3 mg vitamin B2, 1 mg vitamin B6, 0.02 mg vitamin B12, 17.5 g nicotinic acid, 10 mg pantothenic acid, 0.08 mg biotin, 0.02 mg folic acid, 50 mg choline, 50 mg Mn, 0.5 mg I, 90 mg Zn, 10 mg Cu, 90 mg Fe and 0.3 mg Se.
4According to the Fundación Española para el Desarrollo de la Nutrición Animal (FEDNA) (2003).
Animals and experimental design
In total 16 barrows (progeny of Large White × Landrace) were used in this experiment. Eight animals were given the growing diets and eight were given the finishing diets. Each growing diet was rotated three times. All pigs rotated through all the diets, resulting in a total of eight observations for each diet. The pigs received the diets randomly. In this phase, pigs had an initial average body weight (BW) of 50 ± 4.8 kg. For the finishing diets the same design was followed but the pigs had an initial BW of 88 ± 5.7 kg. All pigs were housed individually in an environmentally controlled room, in metabolism cages that allowed the feed intake (FI) to be monitored and the separate collection of urine and faeces. Room temperature was kept at 20°C. Once daily, all the pigs were fed 2.4 times the energy requirement for maintenance, which was assumed to be 0.44 MJ of ME/kg of metabolic weight (BW0.75; National Research Council, NRC, 1998). Water was available to the pigs ad libitum via nipple drinkers.
N balance and NH3 emission study
In each rotation, an adaptation period of 5 days (0 to 5 days), which allowed the pigs to become accustomed to the cages and their new diets, was followed by a collection period, which included a 5-day period (6 to 10 days) for determination of the N balance and a 2-day period (11 to 12 days) for the collection of slurry to measure of NH3 emission.
To determine the N balance (from 6 to 10 days), the faeces of each individual pig were collected once a day, weighed and frozen (−20°C). At the end of the collection period the faeces of each animal were homogenised for analysis. Urine was collected once a day in a plastic container and 50 ml of sulphuric acid (25% H2SO4) was added to lower the pH to avoid N volatilisation and microbial growth. The urine was filtered through a mesh to remove any hair or contaminants, weighed and the volume was recorded. A 5% aliquot (daily) was taken and frozen at −20°C until analysis.
For the NH3 emission study, faeces and urine on days 11 and 12 were collected. The excreta were stored separately in sealed containers at 4°C. After the last collection, the urine and faeces samples of each animal were mixed and homogenised for slurry preparation. The pH and total N were measured, and 700 g were used for the study of NH3-N emission in vitro and 100 g frozen for later analysis of VFA. The slurry samples of a rotation were incubated simultaneously, a total of three runs per phase, eight incubations in vitro per protein level and phase.
NH3 emission from the slurry was determined in vitro in a laboratory at 20°C over a period of 240 h, using an adaptation of the method described by Canh et al. (Reference Canh, Aarnink, Schutte, Sutton, Langhourt and Verstegen1998a). The slurry was placed in a vessel connected to an air pump with an airflow that was proportioned to the quantity of slurry used/exposed area. Moreover, each vessel was connected to two impingers (NH3 trap), which contained about 100 ml of a 0.1N H2SO4 solution. The first impinger was replaced at 24, 48, 96, 144, 192 and 240 h, and the second impinger was replaced at 96 and 240 h. NH3 emission from each sample was compared between the different dietary treatments, using the quantity volatilised from 0 to 96 h, 96 to 240 h and 0 to 240 h. Samples of slurry were collected from all vessels at 240 h for analysis.
Laboratory analysis
Diets, fresh faeces, urine and slurry were analysed at 0 h by the Kjeldahl N technique according to the Association of Official Analytical Chemists (AOAC, 1990). The CP of the feed was estimated as N × 6.25.
For the NH3 emission study, the concentration of ammonia-nitrogen (NH3-N) contained in each impinger was determined as indicated by Prochnow et al. (Reference Prochnow, Kiehl, Pismel and Corrente1995).
At 0 and 240 h, the pH of the slurry was evaluated using a pH meter GLP21 (CRISON®, Barcelona, Spain) and slurry samples were analysed for acetic, propionic, isobutyric, butyric, isovaleric and valeric acids by gas chromatography, as described Madrid et al. (Reference Madrid, Megías and Hernández1999), using 3-methyl-n-valeric acid as an internal standard (Pierce et al., Reference Pierce, Sweeney, Callan, Byrne, McCarthy and O'Doherty2006). In addition, at 240 h electrical conductivity (EC; Conductivity meter 524 CRISON®), NH4-N (Peters et al., Reference Peters, Combs, Hoskins, Jarman, Kovar, Watson, Wolf and Wolf2003), total solids (TS), volatile solids (VS) and chemical oxygen demand (COD) were evaluated according to the standard methods for the examination of water and wastewater (American Public Health Association (APHA), American Water Works Association (AWWA) and Water Pollution Control Federation (WPCF), 1985). Biochemical oxygen demand (BOD in 5 days (BOD5)) was evaluated by Standing Committee of Analysis (DOE methods, 1989).
Statistical analysis
Each individual pig was the experimental unit. Data of the N balance, NH3 emission and slurry characteristics in the growing and finishing phase were analysed within each phase by analysis of variance (ANOVA) using GLM procedure of Statistical Package for the Social Sciences (SPSS, 1997) software with the following model:

where yijk is the dependent variable; μ is the general mean; Di is the permanent effect of dietary CP level, with three levels (control, medium and low); Aj is the random permanent effect of the animal; b is the regression coefficient; FI is the feed intake used as covariate; (FIijk−FI…) is the difference between the FI of each observation and the average covariate and e ijk is the experimental error.
In addition, data were subjected to ANOVA using the GLM procedure of SPSS (1997) software with the following model:

where yijk is the dependent variable; μ is the general mean; Di is the permanent effect of dietary CP level, with three levels (control, medium and low); Pj is the permanent effect of the phase, with two levels (growing and finishing); (DP)ij is the interaction between dietary CP level and phase and eijk is the experimental error.
When significant differences among treatment means were found, the least significant differences test was determined (Snedecor and Cochran, Reference Snedecor and Cochran1980). Linear and quadratic effects of CP concentration were examined. All statements of significance are based on a P < 0.05.
Results and discussion
N balance study
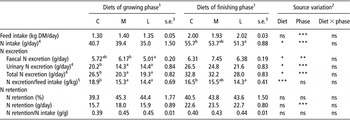
The effects of dietary CP concentration on the N balances in the growing and finishing phases are presented in Table 2. The analysed protein differed slightly from that calculated (Table 1). In the growing diets the difference in CP content between the C and L diet was 29.3 g/kg. These differences meant that the urinary and total N excretion in the C diet in the growing phase were higher (P < 0.01) than in the L diet. In the finishing phase, the difference in CP content of C and L diet was 13.7 g/kg and reductions in the N intake and N excretion/FI were observed (P < 0.05).
Effect of CP concentration of the diet on nitrogen (N) balance in the growing and finishing phase in pigs

DM = dry matter.
1Diets: C: control diet, diet with higher protein content, M: diet with medium protein content, L: diet with low protein content.
2Probability of significance: ns: P > 0.05; *P < 0.05; **P < 0.01; ***P < 0.001.
3Standard error of the mean, n = 8 replicates per treatment.
4,5Linear effect of CP concentration for diet factor (P < 0.05) and (P < 0.001), respectively.
a,bMeans within the same row followed by different letters were significantly different (P < 0.05).
In addition, the reduction of dietary CP resulted in a linear reduction urinary N excretion (P < 0.05), total N excretion (P < 0.05) and N excretion/FI (P < 0.001). The starting hypothesis of this research was that by lowering dietary CP, close to the recommendations of BREF and within the normal range of commercial values, N excretion should be reduced. We found that decreasing the protein level of feeding programmes by 9.30 or 21.45 g/kg was sufficient to reduce (P < 0.05) the N intake in the fattening period (48.2, 46.6 and 43.2 g N/day for C, M and L diet, respectively) and to linearly reduce (P < 0.05) the total N excretion in slurry (29.2, 25.7 and 24.1 g N/day for C, M and L diet, respectively). The average reduction of dietary protein in diet M was 9.30 g/kg, which lowered total N excretion by 11.8%, whereas the average reduction in diet L was 21.4 g/kg, which decreased total N excretion by 17.3% throughout the fattening period. Similar results were also obtained by Canh et al. (Reference Canh, Aarnink, Schutte, Sutton, Langhourt and Verstegen1998a), who described a reduction in total N excretion of 36% when dietary CP was reduced by 40 g/kg, implying a reduction of 9% for every 10 g/kg dietary CP. In our study, the reduction in total N excretion was mainly due to a linear (P < 0.05) reduction in urinary N excretion (23.2, 18.9 and 18.4 for C, M and L diets, respectively). This result agrees with previous studies, which showed that reducing dietary CP reduces total N excretion primarily due to lower N excretion in urine (Canh et al., Reference Canh, Aarnink, Schutte, Sutton, Langhourt and Verstegen1998a; Portejoie et al., Reference Portejoie, Dourmad, Martinez and Lebreton2004; O'Shea et al., Reference O'Shea, Lynch, Lynch, Callan and O'Doherty2009). However, these authors compared diets with higher CP values and ranges: Canh et al. (Reference Canh, Aarnink, Schutte, Sutton, Langhourt and Verstegen1998a) from 165 to 125 g/kg, Portejoie et al. (Reference Portejoie, Dourmad, Martinez and Lebreton2004), from 200 to 120 g/kg and O'Shea et al. (Reference O'Shea, Lynch, Lynch, Callan and O'Doherty2009), from 200 to 150 g/kg, which would imply an over-supply of protein. Pfeiffer et al. (Reference Pfeiffer, Henkel, Verstegen and Philipczyk1995) observed a strong correlation between protein intake and N excretion in urine, and reported protein over-supply, as well as an amino acid imbalance, as possible reasons for high amounts of urea N.
In this study, the fattening phase affected the parameters studied. The slurry from pigs in the finishing phase had more faecal N (P < 0.01), urinary N (P < 0.001) and total N (P < 0.001) than slurry from pigs in the growing phase. The efficiency of protein utilisation by pigs depends on the dietary composition and the physiological status or the growing stage of the animals. The development of feeding programmes that fit the needs and utilisation of N according to the growth status of the pig is a key strategy for minimising N excretion (Dourmad and Jondreville, Reference Dourmad and Jondreville2007). In a study conducted throughout fattening, Latimier and Dourmad (Reference Latimier and Dourmad1993) observed about a 10% reduction in N in pig slurry when different diets were used during the growing and finishing periods, compared with feeding the same diet during both periods. In this study, the excretory pattern of N was clearly affected by the growing stage of the pigs. During the finishing phase, there was greater N intake than in the growing phase (53.64 v. 38.41 g/day, P < 0.001), and total N excretion and N retention were higher (P < 0.001) than in the growing phase, resulting in a similar N retention/N intake ratio for both phase (0.42 and 0.43 for finishing and growing, respectively, P > 0.05). Other studies have shown that the percentage of N retention is inversely related to dietary CP level in the diet when there is an excess of protein or an amino acid imbalance. Thus, Canh et al. (Reference Canh, Aarnink, Schutte, Sutton, Langhourt and Verstegen1998a) showed that the percentage of N retention increased from 39.1% to 42.4% when dietary CP decreased from 165 to 145 g/kg. Similarly, O'Shea et al. (Reference O'Shea, Lynch, Lynch, Callan and O'Doherty2009) observed that the percentage of N retention increased from 39.5% to 53.2% when dietary CP decreased from 200 to 150 g/kg. In this study, the N retention/N intake ratio was similar in the growing and finishing phases. This suggests that the amount of protein in these diets, as well as the amount of amino acids, were close to the requirements of the animals in both phases. In this sense, Dourmad and Jondreville (Reference Dourmad and Jondreville2007) highlighted the importance of feeding strategies that are as close as possible to the maximal attainable reduction in N excretion. This could be based on multiphase feeding combined with a perfect balance between essential amino acids and optimisation of the supply of non-essential amino acids, even by using computerised blend feeding systems, which would allow diet composition to be adapted on a daily or weekly basis.
In vitro NH3 emission
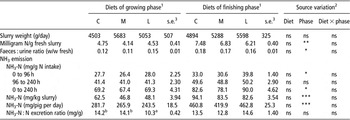
The effects of dietary CP levels on slurry weight, its N concentration and in vitro NH3 emission in the growing and finishing phases are shown in Table 3. Neither dietary CP nor animal effect affected (P > 0.05) the slurry weight. In this research, the water was available ad libitum and its consumption was not monitored individually. Other studies have shown that lowering dietary CP reduced water consumption (Pfeiffer et al., Reference Pfeiffer, Henkel, Verstegen and Philipczyk1995) and, consequently, the amount of manure per animal (Portejoie et al., Reference Portejoie, Dourmad, Martinez and Lebreton2004). However, the first authors used diets with a CP content between 145 and 250 g/kg, and the second between 120 and 200 g/kg, which is much higher than the levels used here.
Effect of CP of the diet on nitrogen (N) content of fresh slurry and in vitro ammonia (NH3) emission in the growing and finishing phase in pigs

1Diets: C: Control diet, diet with higher protein content, M: diet with medium protein content, L: diet with low protein content.
2Probability of significance: ns: P > 0.05; *P < 0.05; **P < 0.01; ***P < 0.001.
3Standard error of the mean, n = 8 replicates per treatment.
a,bMeans within the same row followed by different letters were significantly different (P < 0.05).
In addition, in our study dietary CP did not affect the amount of N on slurry or the faeces : urine ratio. However, the slurry of pigs in the growing phase contained a lower amount of N than that of pigs in the finishing phase (4.47 v. 6.84 mg N/g fresh slurry, P < 0.01).
During slurry storage, NH3-N emission was affected (P < 0.05) by the phase and not by dietary CP (P > 0.05). By the end of 240 h of storage, the slurry of pigs in the growing phase emitted less NH3-N than the slurry of pigs in the finishing phase (68.6 v. 83.5 mg/g N intake, 52.5 v. 86.6 mg/kg fresh slurry and 263.7 v. 447.8 mg/pig per day). In addition, in the growing phase, the NH3-N : N excretion ratio was lower in the diets containing the lower CP level.
It is well documented that N excreted via urine is mainly in the form of urea, which is easily hydrolysed and catalysed by the urease present in faeces to NH3 (Van der Peet-Schwering et al., Reference Van der Peet-Schwering, Aarnink, Rom and Dourmad1999). Reductions in NH3 emission through diet modification have been reported. Previous research has shown that a decrease in the feed CP significantly decreases the excretion of NH3 in pig slurry. Portejoie et al. (Reference Portejoie, Dourmad, Martinez and Lebreton2004) reported reductions in NH3 emission, measured in vitro, of 76% for fresh slurry when dietary CP was reduced from 200 to 120 g/kg, and similar results were obtained in vitro by Le et al. (Reference Le, Aarnink, Jongbloed, van der Peet-Schwering, Ogink and Verstegen2008), who reported that lowering dietary CP from 180 to 120 g/kg decreased NH3 emission from the slurry by 62.4%. In addition, after measuring NH3 in the air exhausted from pens using Dräger tubes, Leek et al. (Reference Leek, Hayes, Curran, Callan, Beattie, Dodd and O'Doherty2007) concluded that NH3 emission was linearly related with CP concentration after decreasing dietary CP from 210 to 130 g/kg. In this in vitro study, dietary CP had no effect on NH3 emission during the 240 h of storage. The other authors worked with much larger ranges of dietary CP (60 to 80 g CP/kg), whereas in our diets, the maximum difference between CP content was 29 g/kg in the growing and 13 g/kg in the finishing phase. Only, in the growing phase was there a reduction in NH3 emission: 22.9% in terms of milligram per kilogram slurry and 13% when measured as milligram per pig per day. In an in vitro study with diets containing 150, 120, 90 and 60 g CP/kg and using Gastec NH3 detector tubes (Kanagana, Japan) to measure NH3 in the headspace air, Otto et al. (Reference Otto, Yokoyama, Hengemuehle, Bermuth, van Kempen and Trottier2003a) found that NH3 emission decreased by approximately 16% for each percentage point of CP reduction from 150 to 90 g/kg. However, no such decrease was observed when the protein decreased from 90 to 60 g/kg. Their conclusion, then, was that the reduction in NH3 emission was linear with a decrease in dietary protein only over a certain range of dietary CP intake in which N utilisation would not have been maximised. However, these same authors, in other study (Otto et al., Reference Otto, Yokoyama, Ku, Ames and Trottier2003b), observed a reduction in total N excretion when dietary CP was reduced from 90 to 60 g/kg but mainly due to the reduction in faecal N; thus, the impact on NH3 emission was minimal.
On the other hand, in this research, the slurry of pigs in the growing phase emitted a lower amount of N than that from the slurry of pigs in the finishing phase (4.47 v. 6.84 mg N/g fresh slurry, respectively), resulting in higher NH3 emission in the second phase. Leek et al. (Reference Leek, Hayes, Curran, Callan, Beattie, Dodd and O'Doherty2007) showed that NH3 emission was significantly correlated with the total Kjeldahl N concentration of slurry and, although NH3 emission was linearly related with CP concentration in the feed, when the total Kjeldahl N content of manure was included in the regression analysis the accuracy of the prediction increased. This suggests that total N of manure should be considered when assessing the impact of CP concentration on NH3 emission.
Composition of the slurry
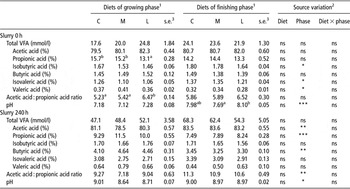
The effect of dietary CP level on the VFA concentrations and pH of slurry in the growing and finishing phases after 0 and 240 h of storage are presented in Table 4. The CP level had no significant effect (P > 0.05) on these parameters, except on propionic acid in the growing phase (P < 0.001) and pH in the finishing phase (P < 0.05), both at 0 h. However, the phase had an effect on the proportions of the different acids. At 0 h in the growing phase, there was a lower proportion of isobutyric acid (P < 0.05) and isovaleric acid (P < 0.05) and a higher proportion of valeric acid (P < 0.05) than in the finishing phase. At 240 h in the growing phase, there was lower proportion of acetic acid (P < 0.01) but a higher proportion of propionic (P < 0.001) and butyric acids (P < 0.01) than in the finishing phase.
Effect of CP concentration of the diet on in vitro VFA production and pH of slurry in the growing and finishing phase at 0 and 240 h of storage

VFA = volatile fatty acid.
1Diets: C: control diet, diet with higher protein content, M: diet with medium protein content, L: diet with low protein content.
2Probability of significance: ns: P > 0.05; *P < 0.05; **P < 0.01; ***P < 0.001.
3Standard error of the mean, n=8 replicates per treatment.
a,bMeans within the same row followed by different letters were significantly different (P < 0.05).
In slurry, VFA, especially branched-chain acids, are caused in part by deamination of amino acids by anaerobic bacteria in the gastrointestinal tract and faeces (Mackie et al., Reference Mackie, Stroot and Varel1998). Hence, reducing dietary CP concentrations and providing amino acids should reduce the availability of substrates for bacterial fermentation. Le et al. (Reference Le, Aarnink, Jongbloed, van der Peet-Schwering, Ogink and Verstegen2008 and Reference Le, Aarnink and Jongbloed2009) reported that the total VFA concentration increased when dietary CP increased, which was attributed to the high level of branched-chain acids in total VFA in the slurry, as these VFA are produced by protein fermentation. However, in our study, the total production of VFA in slurry samples was not affected by the concentration of dietary CP. These results agree with others (Kerr et al., Reference Kerr, Ziemer, Trabue, Crouse and Parkin2006; O'Shea et al., Reference O'Shea, Lynch, Lynch, Callan and O'Doherty2009) in which no changes in the total VFA concentration in pig slurry were observed when dietary CP levels were reduced from 145 to 125 g/kg or from 200 to 150 g/kg, respectively. Others studies showed an increase in VFA following a reduction in dietary CP concentration, in a corn and soyabean meal based diet (low in CP), which was attributed to the increased proportion of corn, resulting in more soluble carbohydrates becoming available to the intestinal microflora (Otto et al., Reference Otto, Yokoyama, Hengemuehle, Bermuth, van Kempen and Trottier2003a).
The production of VFA by microbial fermentation depends on many factors as well as on CP levels, including microbial community structure, gut epithelial cell turnover, pH, carbohydrate composition and the degree of slurry dilution (Kerr et al., Reference Kerr, Ziemer, Trabue, Crouse and Parkin2006).
In this research, the VFA pool was largely dominated by the short straight-chain VFA such as acetic, propionic and butyric acids, which comprise over 91% of total VFA in the slurry, whereas branched-chain VFA, such as isovaleric and isobutyric acids, contributed minimally, confirming the findings of O'Connell et al. (Reference O'Connell, Callan and O'Doherty2006), Pierce et al. (Reference Pierce, Sweeney, Callan, Byrne, McCarthy and O'Doherty2006), Lynch et al. (Reference Lynch, Callan and O'Doherty2009) and O'Shea et al. (Reference O'Shea, Lynch, Lynch, Callan and O'Doherty2009). However, when the VFA were studied according to the phase of fattening, branched-chain acids (isobutyric and isovaleric) showed higher levels in the finishing phase at 0 h. The finishing pigs ingested more N than that of growing pigs, resulting in a greater amount of N in the slurry at 0 h (Table 3), which would mean more substrates for protein fermentation. When the composition at 240 h was analysed, the total VFA level was higher than at 0 h, which agrees with the results obtained in vitro by Canh et al. (Reference Canh, Aarnink, Verstegen and Schrama1998b) and O'Shea et al. (Reference O'Shea, Lynch, Lynch, Callan and O'Doherty2009), who stored the slurry under conditions similar to ours. These conditions could reproduce the conditions of the two environments that occur under real conditions in the pit of a typical farm (Møller et al., Reference Møller, Sommer and Ahring2004; Gilarranz et al., Reference Gilarranz, Massana, Sánchez and Moragues2007): an aerobic environment at the surface and an anaerobic environment in depth, where fermentation processes can continue, producing VFA. Furthermore, we observed a higher level of acetic and lower level of propionic acid in the finishing phase than in the growing phase, (higher acetic : propionic ratio in the finishing phase). However, the acetic : propionic ratio was not influenced by dietary CP. A similar result was obtained by Lynch et al. (Reference Lynch, Callan and O'Doherty2009), who found no differences in the acetic : propionic ratios obtained in slurry from pigs fed with different amounts of CP (200 and 160 g/kg).
In addition, the pH was higher during the finishing phase at 0 h (7.19 in growing v. 7.92 in finishing phase, P < 0.001) and at 240 h (8.78 in the growing v. 8.98 in the finishing phase, P < 0.05). This increase in pH of the slurry in the finishing phase could be responsible for the higher NH3 emission (Table 3). Canh et al. (Reference Canh, Aarnink, Verstegen and Schrama1998b) observed that the pattern of slurry pH during 7 days ran parallel to the pattern of NH3 emission and that NH3 emission was strongly affected by the pH of the slurry. The increase in slurry pH is of great importance for NH3 volatilisation from pig slurry (Sommer and Husted, Reference Sommer and Husted1995); this relationship exists because slurry pH determines the balance between volatile NH3 and non-volatile ammonium. At high pH values, this balance turns towards NH3, favouring NH3 emission. Thus, our results are consistent with those of Canh et al. (Reference Canh, Aarnink, Verstegen and Schrama1998b) who pointed to greater NH3 emission, higher amounts of N and higher pH values in slurry during the finishing phase.
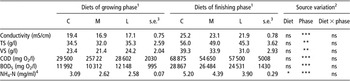
The effects of dietary CP concentration on the pollutant characteristics (EC, TS, VS, COD, BOD5 and NH4-N) of the slurry at 240 h in the growing and finishing phases are shown in Table 5. The dietary CP concentration had no effect (P > 0.05) on pollutant characteristics of slurry except on NH4-N. As the dietary CP concentration decreased, the NH4-N in the slurry decreased linearly (P < 0.05), which is in agreement with the findings of Canh et al. (Reference Canh, Aarnink, Schutte, Sutton, Langhourt and Verstegen1998a) and Le et al. (Reference Le, Aarnink, Jongbloed, van der Peet-Schwering, Ogink and Verstegen2008 and Reference Le, Aarnink and Jongbloed2009). This last mentioned paper, Le et al. (Reference Le, Aarnink and Jongbloed2009) showed that reducing dietary CP from 150 to 120 g/kg decreased the ammonium concentration in finishing pig slurry by 23.8%, and the total N concentration by 27.4%. In our study, a similar effect was noticed during the whole fattening period. A reduction of CP in the diet of nine or 21 g/kg resulted in a decrease in slurry NH4-N of 20.3% and 28.4% respectively, at 240 h.
Effect of dietary CP concentration on EC, TS, VS, COD, BOD5 and NH4-N of slurry at 240 h in the growing and finishing phase

EC = electrical conductivity; TS = total solids; VS = volatile solids; BOD5 = biochemical oxygen demand; COD = chemical oxygen demand.
1Diets: C: control diet, diet with higher protein content, M: diet with medium protein content, L: diet with low protein content.
2Probability of significance: ns: P > 0.05; *P < 0.05; **P < 0.01; ***P < 0.001.
3Standard error of the mean, n=8 replicates per treatment.
4Linear effect of CP concentration (P < 0.05).
The slurry from pigs in the growing phase had a lower EC (P < 0.001), TS (P < 0.01), VS (P < 0.01), COD (P < 0.001), BOD5 (P < 0.001) and NH4-N (P < 0.001) than the slurry from pigs in the finishing phase.
Owing to the emphasis given to N emission and its possible environmental impact, and because of the general interest the presumed pollutant capacity of pig slurry, numerous studies have been developed to predict the nutrient concentration of pig slurry, including its EC, which can provide an estimate of the ionic concentration of the slurry. Previous studies have noticed a positive relationship between EC and the NH3-N concentration, (Provolo and Martínez-Suller, Reference Provolo and Martínez-Suller2007), and between EC and total and VS in the slurry (Suresh et al., Reference Suresh, Choi, Oh and Moon2009). The results obtained for the pollutant characteristics of the slurry in our study are similar to those obtained previously in pig slurries from different European countries by Scotford et al. (Reference Scotford, Cumby, White, Carton, Lorenz, Hatterman and Provolo1998) and from the Mediterranean area by Moral et al. (Reference Moral, Perez-Murcia, Perez-Espinosa, Moreno-Caselles, Paredes and Rufete2008). These last authors showed that the slurries of finishing pigs has a higher EC and organic load (BOD5 and COD) than those of other production stages, such as gestating, farrowing and weaning. This would mean a higher concentration of nutrients in slurry from finishing pigs and therefore a greater potential for environmental contamination.
In conclusion, this study has shown that by reducing dietary protein concentration in a narrow range and using levels close to BREF recommendations, while supplementing the diet with the amount essential amino acids that fulfil the animals’ requirements, urinary N and total N excretion is reduced in the slurry of growing-finishing pigs. The pig slurry in the finishing phase is potentially more harmful to the environment than that of pigs in the growing phase, because of its higher concentration of TS, VS, COD, BOD5 and NH4-N.