Implications
Loss of farm animal genetic diversity was on the rise during the last 50 years, as the spread of a few highly developed breeds started to threaten the existence of well-adapted local breeds either by cross-breeding or by substitution. For more than 30% of the livestock breeds the situation is unknown, and 36% of known sheep breeds are endangered or extinct. Marginal and transitional areas with harsh environment, often used for low-input sheep farming, are predominantly the ones affected. Genetic variability is important for the sustainable use and development of native sheep populations.
Introduction
In addition to natural geographical isolation at the indented eastern Adriatic coastline and karst of Bosnia and Herzegovina, the history of the autochthonous sheep populations of this region includes important political and economical changes that have taken place in this dynamic area: changes of the borders, management practices such as horizontal and vertical transhumance, and controlled and uncontrolled crossbreeding. The sheep chosen for this study are the local populations from Croatia and from Bosnia and Herzegovina. They are crucial for the preservation of the genetic diversity in this geographic region, as they are either numerous in the current overall livestock production, or predominant in the sheep production of a specific micro region. The studied populations are of pramenka type, which is the Bosnian, Croatian and Serbian name descriptive for open fleece of sheep breeds with mixed wool, included in the Zackel/Valachian phyletic sheep group (Draganescu and Grosu, Reference Draganescu and Grosu2010). In Croatia, about 80% of the 630 000 registered breeding sheep are individuals representing one of the nine autochthonous breeds, predominately reared in low-input production systems. We chose eight breeds representing almost exclusively the sheep production of the Mediterranean part of Croatia: Istrian sheep (IST), Krk island sheep (KRK), Rab island sheep (RAB), Cres island sheep (CRE), Lika pramenka sheep (LIK), Pag island sheep (PAG), Dalmatian pramenka (DAL) and Dubrovnik ruda sheep population (RUD). Additional four multipurpose pramenka breeds included in this study graze more than 50% of the total agricultural areas in low-input highland systems of Bosnia and Herzegovina, and are currently stable at about one million sheep: Kupres pramenka (KUP), Vlasic/Travnik/Dubska pramenka (VLA), Privor pramenka (PRI) and Hum/Stolac pramenka (STO) sheep.
The high level of phenotypic diversity within the studied breeds (Böhm, Reference Böhm2004) and the large phenotypic differences among different breeds studied here (Posavi et al., Reference Posavi, Ernoić, Ozimec and Poljak2003; Brka et al., Reference Brka, Muhamedagić, Ivanković, Vegara, Rahmanović, Dokso and Zečević2007) suggest high levels of genetic diversity within populations and high levels of genetic differentiation among them. Differentiation and neutral nuclear diversity studies are scarce and have been reported only in a limited number of these pramenka populations (Bradic et al., Reference Bradic, Pavic and Mioc2003; Lawson Handley et al., Reference Lawson Handley, Byrne, Santucci, Townsend, Taylor, Bruford and Hewitt2007; Ćinkulov et al., Reference Ćinkulov, Popovski, Porcu, Tanaskovska, Hodžić, Bytyqi, Mehmeti, Margeta, Djedović, Hoda, Trailović, Brka, Marković, Važić, Vegara, Olsaker and Kantanen2008) using different sets of markers, which makes comparison of results between breeds and with other breeds difficult (Food and Agriculture Organization of the United Nations, 2011). Ancestral origin using mtDNA and Y chromosome data has also been investigated in Pramenka sheep (Bradic et al., Reference Bradic, Mioc, Pavic and Barac2005; Ivanković et al., Reference Ivanković, Dovč, Kavar, Caput, Mioč, Pavić, Štuhec and Leto2005; Ferencakovic et al., Reference Ferencakovic, Curik, Royo, Pérez-Pardal, Cubric-Curik, Fernández, Álvarez, Kostelic, Sprem, Krapinec and Goyache2013). Assessment of genetic diversity using nuclear data for setting the conservation priorities is a standardized method for estimating the genetic diversity of different ruminant populations in many countries (Baumung et al., Reference Baumung, Simianer and Hoffmann2004; Ligda et al., Reference Ligda, Altarayrah and Georgoudis2009; Barreta et al., Reference Barreta, Iñiguez, Saavedra, Romero, Callisaya, Echalar, Gutiérrez-Gil and Arranz2012). Therefore, in this study, we report on the pramenka breeds from Croatian and from Bosnia and Herzegovina breeds using nuclear microsatellite markers, with the aim of assessing the current status of the genetic diversity and differentiation of the considered breeds, revealing the genetic variability that exists within and among them, while also comprehensively exploring the genetic structure of the studied sample.
Material and methods
Sampling and DNA extraction
A total of 341 blood samples were collected for the 12 breeds (Supplementary Figure S1), with 20 to 33 unrelated animals sampled from each breed (Supplementary Table S1). One of the 12 sample groups was obtained from a reproductively isolated population of Istrian sheep in Slovenia. Blood Genomic DNA Kit was used to extract DNA from the whole blood samples (GenEltueTM; Sigma-Aldrich®, St. Louis, MO, USA). For the initial selection of 30 markers, four different PCR-multiplex reactions were optimized using fluorescent-labelled primers and hot-start polymerase (JumpStart™ REDTaq® ReadyMix™; Sigma-Aldrich®, St. Louis, MO, USA). Twenty of the markers had been selected from the sheep diversity list recommended by Food and Agriculture Organization of the United Nations (FAO, 2011). The remaining 10 markers had previously shown good features for multiplexing. Diluted PCR products were processed in a 16-capillary electrophoresis ABI3130XL Genetic Analyser, with two of the PCR-multiplex reactions being combined into a single multi-loading mix (Supplementary Table S2). Electropherograms from the loading panels were analysed automatically using GeneMapper® software (AB, CA). Two of the markers had more than 5% of missing genotypes and were excluded from further analysis. Genetic diversity parameters were estimated for the remaining 28 microsatellite loci.
Data analysis
Allele frequency, the number of alleles (A), observed heterozygosity (Ho) and heterozygosity expected (He) under the Hardy-Weinberg (HW) equilibrium assumption across the populations and the markers were calculated using the GENETIX 4.04 software (Belkhir et al., Reference Belkhir, Borsa, Chikhi, Raufaste and Bonhomme2002). Locus-wise deviations of the markers from HW equilibrium across the populations were tested by means of the GENEPOP 4.1.3 software package (Raymond and Rousset, Reference Raymond and Rousset1995) and the method of Guo and Thompson (Reference Guo and Thompson1992). The same software was used to determine the possibility of null-alleles and gametic disequilibrium test. Statistical significance of the values obtained in all cases was estimated by bootstrapping, using 1000 replications. Markers showing deviation from the HW equilibrium were excluded from further analysis if the deviation was significant in more than half of the populations studied. Private alleles were accounted for utilizing the GDA software (Lewis and Zaykin, Reference Lewis and Zaykin2001). Polymorphic information content (PIC) and the rarefacted allelic richness were estimated in MOLKIN 3.0 (Gutierrez et al., Reference Gutierrez, Royo, Álvarez and Goyache2005), using bootstrapping to standardize among different sample size populations. Hulbert’s rarefaction correction and sample size correction were based on 50 diploid individuals. Pair-wise genetic distances (F st), coefficients of inbreeding (F is) and gene flow estimates were obtained using ARLEQUIN 3.1 (Excoffier et al., Reference Excoffier, Laval and Schneider2005) and GENETIX 4.04 (Belkhir et al., Reference Belkhir, Borsa, Chikhi, Raufaste and Bonhomme2002). GENETIX 4.04 was also used to evaluate the significance of the F is by permuting the alleles within populations over all loci in each breed, and under the assumption of heterozygosis deficit, as well as for the factorial correspondence analysis. Genetic variation and the distribution of genetic diversity among and within the groups were determined by the analysis of molecular variance (AMOVA) using the ARLEQUIN 3.1 software. Several groupings of populations in nested AMOVA were tested to find the grouping that best explains the variance in the genotype data. Individual multi-locus genotypes were used in clustering methods to study the population differentiation. Individual assignment in the populations was investigated using the STRUCTURE software 2.3.1 (Pritchard et al., Reference Pritchard, Steephens and Donnelly2000). We performed 10 runs to choose the appropriate number of inferred clusters (K), fitting K from 2 to 20. Burn-in period for all runs was 20 000 iterations, and data were collected during the period of 10 000 iterations. To choose the optimal K, the posterior probability L(K) was calculated using the mean log-likelihood of K for each value of Evanos’ ΔK. L''(K) with respect to K was also calculated. Graphic representations of these statistics were obtained from Structure Harvester 0.6.8 (Dent and VonHoldt, Reference Dent and VonHoldt2012).
Results
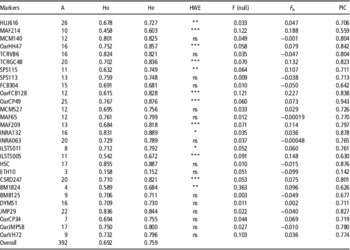
We identified a high level of genetic diversity based on the analysis of the 28 loci (Table 1). A total of 392 different alleles were identified in the 341 genotyped individuals. The average number of alleles per locus was 14. The highest number of detected alleles recorded was 26 for marker HUJ616, whereas ETH10 showed only three alleles (Table 1). The PIC values per marker varied from 0.142 for ETH10, to 0.943, for OarCP49. The highest Ho was recorded for locus HSC (0.854). The highest He was estimated for locus INRA132 (0.889). In the global population, accounting for multiple tests (28 loci, 12 populations), 13 loci were found to be in HW disequilibrium, with the average number of 2.5 populations in disequilibrium per marker. The maximum of six populations in HW disequilibrium was recorded for marker OarFCB128. Non-amplifying null alleles showed frequency estimates ranging from 0.0030 (BM8125) to 0.3634 (BM1824) (Table 1). BM1824 was excluded from subsequent analysis of genetic differentiation because of the high estimated frequency of null allele. Hence, the results of genetic variability for the 12 studied populations are given based on the remaining 27 microsatellite markers analysed.
Genetic diversity parameters estimated for the 28 microsatellite loci analysed in the 12 sheep populations

A=number of alleles per locus; Ho=average observed heterozygosity; He=average expected heterozygosity; HWE=deviation from the HW equilibrium; F (null)=frequency of null alleles estimated for each locus, F is=coefficient of inbreeding; PIC=polymorphic information content; ns=non-significant.
*P<0.05, **P<0.01, ***P<0.001.
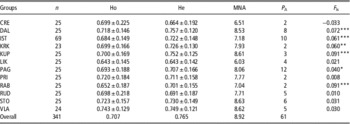
Considering detected alleles per population per locus, one marker was found to be fixed in three populations (ETH10 in RUD, PAG, CRE), whereas the highest number of alleles was 15 (TCRGC4B in STO). In total, 61 private alleles were sampled (total N of alleles for 27 marker was 387) and were distributed across all populations. The highest numbers of private alleles were noted in PAG (12) and IST (10) breeds (Table 2). The highest frequencies of private alleles were observed in CRE for TB6 (0.18), RAB for HSC (0.16) and CRE for ILST5 (0.14). The largest rarefacted mean number of alleles per locus (MNA), when all of the markers are considered jointly, was found in STO (8.63). Similar MNA values were estimated for VLA, KUP and DAL (Table 2). Average Ho values among all the populations were high and resembling, ranging from 0.643±0.145 (LIK) to 0.743±0.129 (VLA). Similarly, the average He values varied from 0.643±0.142 (LIK) to 0.757±0.120 (DAL) (Table 2). Possible artefacts owing to the different sample sizes can be ruled out, as the values obtained after the sample size correction did not show remarkable differences when compared with the diversity estimates reported above. F is was estimated for each locus in the global population and for each population across loci. Estimated F is values for the markers ranged from −0.099 (ETH10) to 0.227 (OarFCB128) (Table 1), and were positive and significant (P<0.05) for 13 markers, whereas for six of them the values were high. High F is value for OarFCB128 was evident in 10 of the breeds, ranging from 0.026 (DAL) to 0.484 (KRK). Considering the individual populations, half of them showed significant (P<0.05), positive and low F is values (Table 2). The highest significant F is values were estimated for RAB and KUP (F is=0.091, P<0.001).
Genetic variability parameters estimated for the 12 populations of sheep studied, based on the analysis of the 27 microsatellite markers

n=sample size; Ho=average observed heterozygosity (±s.d.); He=average expected heterozygosity (±s.d.); MNA=mean number of alleles (rarefacted); P A=number of private alleles; F is=coefficient of inbreeding.
F is estimates and significance of the deviation of HW equilibrium per population across the 27 loci.
*P<0.05, **P<0.01, ***P<0.001.
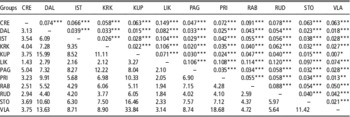
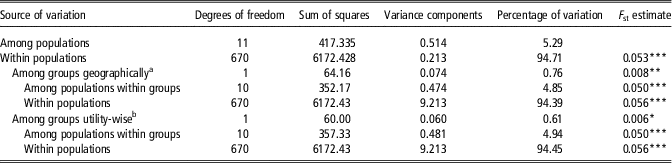
For the 12 considered groups, the genetic differentiation estimates of pairwise Wright’s fixation index (F st) were low (0.007 for VLA–KUP pair) to considerable (0.149 for LIK–CRE pair) (Table 3). Largest genetic differentiation was found for the LIK population and the estimated F st coefficients ranged between 0.071 and 0.149. Even for the substantial genetic differentiation identified for LIK, the estimates for the number of effective migrants (N m) were very low (1.43 to 3.27). In contrast, KUP showed a low level of differentiation, with F st coefficients reaching maximally 0.063 (KUP–CRE). The highest gene flow was estimated for the KUP-VLA pair (33.84), and both of these groups had the highest estimates for the gene flow compared with other populations (Table 3). AMOVA showed a significant (P<0.001) and higher source of variation within 94.79% than among 5.21% populations (Table 4). The F st value (0.052) obtained by this analysis suggested a moderate genetic differentiation for the global population. Variance components among populations were highly significant (P<0.001) for all of the studied loci, and markers OarJMP58 and INRA063 contributed to explain 8.05% and 8.57% of the variability, respectively. Utility-wise and geography-wise nested AMOVA showed similar results (Table 4), with more variability among populations than between geographical or utility groups. In the factorial correspondence analysis, the first three components together accounted for 43.42% of the variation, and explained 16.73%, 13.78% and 12.91% of the total variation, respectively. The first component separates the LIK and CRE groups (Supplementary Figure S2). Addition of the second component confirms the differentiation of CRE and IST, whereas the third component separated IST and demonstrated the isolation of LIK from all the other populations.
Genetic differentiation parameters estimated for the 12 populations of sheep studied using of 27 microsatellite markers

Pairwise genetic distances (F st) with their significance levels, and number of effective migrants per generation (N m) are presented above and below the diagonal, respectively.
*P<0.05, **P<0.01, ***P<0.001.
Global AMOVA results for the 12 population and results of the nested AMOVA performed by grouping the sheep geographicallyFootnote a and utility-wiseFootnote b

AMOVA=analysis of molecular variance.
Genetic distances (F st) with their significance levels are given.
a Geographically: islands and peninsula (IST, KRK, CRE, PAG, RAB, RUD); mainland (DAL, LIK, KUP, VLA, PRI, STO).
b Utility-wise: group used predominately for milk (IST, KRK, CRE, PAG, RAB, VLA); group used predominately for meat (DAL, LIK, KUP, PRI, STO, RUD).
*P<0.05, **P<0.01, ***P<0.001.
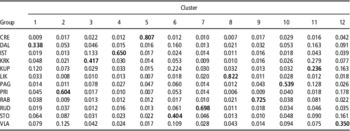
The most appropriate number of clusters for the 12 populations according to Delta K (7.92) was ascertained to be 12, and the best value of ln Pr(X|K) for K=12 was −30 947.2 (Supplementary Figure S3). Graphical representation of the clustering outcomes suggested for K=12 is shown in Supplementary Figure S4, and the proportion of membership for the indentified clusters is provided in Table 5. Populations CRE, LIK and RAB were each associated with their own cluster, for which the corresponding estimated membership was higher than 0.725. RUD, IST, PRI and PAG populations were also assigned to their own clusters, but because of more admixture their highest estimated membership was moderate and higher than 0.539. The admixtures were low and homogeneously distributed, except in PRI, which was influenced by VLA-related cluster 12, and PAG, which showed influence of cluster 11. For populations VLA, DAL, KRK, STO and KUP, the higher proportion of membership was lower than 0.417 and showed influence of many of the identified clusters. Although there are 12 clusters for 12 populations, cluster 11 does not seem to correspond to any of the sampled populations, in particular. It influences most of the populations to some extent, except for CRE, LIK and PRI. The second most heterogeneous cluster is the VLA-related cluster 12, influenced by the STO, PRI and KUP populations. All of the 12 analysed pramenka breeds showed, to some degree, a ‘background’ influence from the two rustic populations, DAL and VLA.
Proportion of membership for the 12 sheep populations across the clusters indentified in the assignment analysis (the highest contribution shown in bold)

Discussion
A large number of markers was covered in this study and, with the exception of ETH10, all were highly polymorphic. We observed a clear deficit of heterozygotes, as reported in other sheep breeds (Lawson Handley et al., Reference Lawson Handley, Byrne, Santucci, Townsend, Taylor, Bruford and Hewitt2007). In the overall population, 13 of the 28 markers analysed had a significant deviation from HW equilibrium (Table 1). Except for OarFCB128, these markers showed no correlation to the occurrence of null alleles and can be explained by a reduced effective size of the flocks in the studied populations.
Although a comparison of the genetic diversity parameters described here with those reported in other populations is difficult because of different markers and sample sizes used, our results indicate values similar to those reported for the Balkan pramenka breeds (Ćinkulov et al., Reference Ćinkulov, Popovski, Porcu, Tanaskovska, Hodžić, Bytyqi, Mehmeti, Margeta, Djedović, Hoda, Trailović, Brka, Marković, Važić, Vegara, Olsaker and Kantanen2008). In general, our analyses revealed higher within-breed variability than reported for selected breeds such as Sarda sheep, as expected for sheep populations that have not been highly pressured by selection (Arranz et al., Reference Arranz, Bayon and San Primitivo2001; Pariset et al., Reference Pariset, Savarese, Cappuccio and Valentini2003). Moreover, we found that sheep genetic diversity in this south European region was not lost, with values fitting the pattern of radiation of genetic variation from the Near East hot-spot (Tapio et al., Reference Tapio, Ozerov, Tapio, Toro, Marzanov, Ćinkulov, Goncharenko, Kiselyova, Murawski and Kantanen2010). For example, we found the MNA (range 6.03 to 8.6) to be within the range reported for Balkan pramenka breeds (Ćinkulov et al., Reference Ćinkulov, Popovski, Porcu, Tanaskovska, Hodžić, Bytyqi, Mehmeti, Margeta, Djedović, Hoda, Trailović, Brka, Marković, Važić, Vegara, Olsaker and Kantanen2008) and alpine sheep (Dalvit et al., Reference Dalvit, Sacca, Cassandro, Gervaso, Pastore and Piasentier2008). However, it was lower than that reported for Greek (Ligda et al., Reference Ligda, Altarayrah and Georgoudis2009) and Turkish sheep breeds (Gutierrez-Gil et al., Reference Gutierrez-Gil, Uzun, Arranz, San Primitivo, Yildiz, Cenesiz and Bayon2006).
Moderate genetic variation component estimated between the studied populations (5.29%) was similar to values reported for other Balkan sheep (Ćinkulov et al., Reference Ćinkulov, Popovski, Porcu, Tanaskovska, Hodžić, Bytyqi, Mehmeti, Margeta, Djedović, Hoda, Trailović, Brka, Marković, Važić, Vegara, Olsaker and Kantanen2008), and somewhat higher than those reported for Greek breeds (Ligda et al., Reference Ligda, Altarayrah and Georgoudis2009). The low percentages of the variance explained by utility-wise (0.008, P<0.01) and geography-wise (0.006, P<0.05) grouping, compared with results reported in Indian sheep (Arora et al., Reference Arora, Bhatia, Mishra and Joshi2011), suggest a low influence of specific selection strategies, but also a poor influence of the geographical isolation in the overall sampling area. The genetic differentiation estimates of pairwise F st index, complemented with the gene flow estimates, are in accordance with the results of the factorial correspondence and structure analyses, and consistent with the geographical distribution of the breeds, their history and their breeding practices. The most recent threats to genetic variability of sheep populations include the Croatian War of Independence and the War in Bosnia and Herzegovina. The total number of sheep was almost halved. However, the island and peninsula breeds were not affected directly by war activities, as was the case with LIK, RUD, DAL, and the breeds from Bosnia and Herzegovina, which could have been exposed also to isolation breakage. Re-establishing of the studbooks after the war was performed by assigning the breed membership according to phenotypic appearance, similar as with other indigenous breeds in this area (Galov et al., Reference Galov, Byrne, Gomercic, Duras, Arbanasic, Sindicic, Mihelic, Kovacic and Funk2013).
As reported in Ćinkulov et al. (Reference Ćinkulov, Popovski, Porcu, Tanaskovska, Hodžić, Bytyqi, Mehmeti, Margeta, Djedović, Hoda, Trailović, Brka, Marković, Važić, Vegara, Olsaker and Kantanen2008), IST group can be considered as a distinct breed, but VLA is clustering with other Balkan pramenka populations. Factorial correspondence and structure analysis showed that LIK, CRE and IST are the most distinct groups. From the genetic point of view, the rest of the populations are closer together, with RUD, KRK and DAL showing certain differences. In Croatia, most of the breeds are isolated on the Mediterranean islands, and the one showing the largest genetic distance (LIK) is located in the mountain region. Although the factorial correspondence analysis shows IST as the third most distinct population, it is close to KRK, and its distinction is only identified when considering the third component. The number of migrant individuals estimated for the KRK–IST pair (9.35) is also visible in the structure results. However, we found that the KRK admixture was not widely spread, but limited to some of the IST samples. In addition, IST had one of the higher numbers of private alleles, indicating that, owing to samples with a lot of KRK admixture, distinctiveness of IST was probably underestimated. RAB and RUD showed firm clusters and distinction from the other studied sheep populations because of their isolation. Namely, RAB is an island population, whereas RUD population is considered endangered (712 animals), isolated in the area on the furthest south of Croatia and bred for different purpose (wool). The most poorly defined population among the eight groups from Croatia was DAL and was also the only population in Croatia that showed connections to all four populations from Bosnia and Herzegovina. This by far is the largest population, covers areal along the Adriatic coast with some of the islands, and is sympatric with the other studied groups. The difference of results regarding the distinctiveness between populations sampled in Bosnia and Herzegovina and in Croatia could be a result of systematic recording and selection programme implemented by the Croatian Agriculture Agency during several decades, complemented with clear geographical boundaries between the populations/breeds in Croatia. As reported for Baltic sheep (Tapio et al., Reference Tapio, Tapio, Grislis, Holm, Jeppsson, Kantanen, Miceikiene, Olsaker, Viinalass and Eythórsdóttir2005), four populations, sampled as traditional breeds in Bosnia and Herzegovina, do not equate to genetically distinct populations. According to the structure analysis and the N m and F st estimates reported here, the largest influence on other Bosnian populations comes from VLA, with status and distribution similar to DAL in Croatia. KUP was influenced by the largest number of the identified clusters and it is questionable how much of the initial diversity and specific adaptations to mountain enviroment remains in the KUP population proposed for ‘status nascendi’ conservation efforts. Although to have better milk and wool production, ‘hybridization programmes’ were established with PRI rams in KUP flocks, a higher influence is recorded from VLA (Palian et al., Reference Palian, Nikolic and Bagaric1960). The most distinct among the Bosnia and Herzegovina populations was PRI, with a well-defined cluster showing minor admixtures and obvious influence from the sympatric VLA population.
According to Lawson Handley et al. (Reference Lawson Handley, Byrne, Santucci, Townsend, Taylor, Bruford and Hewitt2007), Weitzmans’ conservation approach, which favours the groups that clearly stand out in the factorial correspondence analysis (LIK, CRE and IST), or are differentiated in clusters showing unique genotypes (LIK, CRE and RAB), should be treated with caution. Similarly, we have noted that it does not account for the within-group genetic diversity levels and the geographical structure that can be found in some breeds. Namely, LIK had the lowest diversity indicators, as was also reported by Ferencakovic et al. (Reference Ferencakovic, Curik, Royo, Pérez-Pardal, Cubric-Curik, Fernández, Álvarez, Kostelic, Sprem, Krapinec and Goyache2013) for mtDNA and chromosome Y diversity. The second most distinct population, CRE, had Ho somewhat higher than that observed for LIK, but other diversity indicators were quite low as well. In addition, the same as in RUD, Ho being higher than He indicates suspicion regarding an isolate braking effect. Interestingly, Pavić et al. (Reference Pavić, Bradić, Mioč, Ivanković, Barać and Safner2006) found lower He (0.6575) and higher F is (0.094) in RUD, using 10 microsatellite markers on 44 animals, indicating possible recovery of the population in recent 5 years. Contrary to LIK and CRE, the IST population showed reasonable distinctiveness and favourable levels of diversity parameters. Nonetheless, the significant and relatively high estimated F is, higher than reported for IST by Ćinkulov et al. (Reference Ćinkulov, Popovski, Porcu, Tanaskovska, Hodžić, Bytyqi, Mehmeti, Margeta, Djedović, Hoda, Trailović, Brka, Marković, Važić, Vegara, Olsaker and Kantanen2008) (0.011), indicates heterozygote deficiency, which might be caused by a population subdivision effect because of the sampling of animals in different locations. When the sampled IST subpopulations are analysed separately (Salamon et al., Reference Salamon, Gutierrez-Gil, Kostelic, Gorjanc, Kompan and Dzidic2012), F is values are lower. The F is values for other sheep are similar to ones reported for Greek breeds (Ligda et al., Reference Ligda, Altarayrah and Georgoudis2009), and lower than those reported for Portuguese sheep (Santos-Silva et al., Reference Santos-Silva, Ivo, Suosa, Carolino, Ginja and Gama2008). Unlike in IST, estimated F is values in other populations are most likely caused by breeding practices carried out without knowledge regarding the genetic variants available in flocks of these populations. Artificial insemination is not used and, depending on the population, one ram is used per 17 to 33 ewes. The results of avoidance of mating the rams with their offspring are questionable, as there is no parentage assessment in any of the investigated breeds. As Pariset et al. (Reference Pariset, Savarese, Cappuccio and Valentini2003) noted, ram exchange policy provides gain of a very few genetic variants when the rams are exchanged between flocks with a similar genetic pool. In the Supplementary Table S1, we presented small estimated sizes for the studied geographical groups, especially for RAB, IST and KRK. Although Ćinkulov et al. (Reference Ćinkulov, Popovski, Porcu, Tanaskovska, Hodžić, Bytyqi, Mehmeti, Margeta, Djedović, Hoda, Trailović, Brka, Marković, Važić, Vegara, Olsaker and Kantanen2008) estimated the highest F is value among the analysed western Balkan pramenka breeds in Dubska sheep (aka VLA), we did not estimate significant F is in this population.
Conclusions
This study detected high levels of genetic diversity in all studied breeds, except for LIK and RAB. The less distinct populations (VLA, STO, PRI, DAL and KUP) showed the highest heterozygosity levels and mean number of alleles. The two distinct breeds that showed the highest diversity were dairy breeds: IST and PAG. The 12 populations showed moderate differentiation with low influence of specific selection and geographical isolation. The Bosnia and Herzegovina populations were the least differentiated; however, PRI was the most distinct among them.
Additional studies based on more detailed sampling would be desirable to identify structure of the genetic pools within the breeds, especially to address the significant and substantial F is values for KUP, RAB, IST, LIK and CRE. It would be recommendable to revise the strategy of the breeding practices to amplify the gain of genetic variants through ram exchange practice by identifying structure of the genetic pools of the farms within the breeds and to organize parentage testing.
Acknowledgements
The samples and analysis were funded by National research grants from the Ministry of Science, Education and Sports of the Republic of Croatia 178-1780460-0407. The research stay at the University of Leon was supported by the Trust fund of the Faculty of Agriculture at University of Zagreb. The samples of the Istrian sheep from Croatia were provided by the Croatian Agricultural Agency, and the samples of the Istrian sheep from Slovenia by the Zootechnical Department of Biotechnical Faculty, University of Ljubljana. The authors would also like to express their gratitude to dr. sc. Antun Kostelić for his efforts in obtaining samples from the Adriatic sheep breeds.