


Introduction
The wide availability of digital technology has not only reshaped the way second languages (L2s) are learned, but has also enhanced research capacity to explore language learning processes and outcomes. Digital platforms provide multiple data points that can be mined to understand learner characteristics at both the individual and group levels. Tracking user behavior helps language educators conduct in-depth analyses of how learners engage with web-based language learning programs or interact with other learners in collaborative online contexts (Smith, Reference Smith2017). Collecting and analyzing such behavioral data allows for documenting the multiple routes and particularities of language learning processes and provides guidance on how to best design web environments for enhanced participation and optimal language learning (Chun, Reference Chun2013). However, these new sources of data are often unstructured and therefore require a careful approach in both extraction and interpretation to meaningfully assist research and pedagogical objectives (Godwin-Jones, Reference Godwin-Jones2017; Link & Li, Reference Link, Li, Dixon and Thomas2015).
Data mining, which refers to the process of discovering hidden patterns in large data sets, is an interdisciplinary practice involving methods at the intersection of machine learning, pattern recognition, and statistics (Fayyad, Piatetsky-Shapiro, & Smyth, Reference Fayyad, Piatetsky-Shapiro and Smyth1996). While techniques for analyzing big data have transformed many areas of life, the use of data mining in education, particularly in language learning, has only recently emerged. In this article, we review three areas of data-mining research that illustrate how hidden patterns or characteristics of learner behaviors can be mined from unstructured data: clustering, text mining, and social network analysis. These three areas are particularly informative for language learning research given the importance of learner variations and characteristics in second language acquisition (Dörnyei, Reference Dörnyei2009) and the growing role of peer collaboration in digital literacy practices (Kern & Warschauer, Reference Kern, Warschauer, Warschauer and Kern2000). Following a general introduction to the topic, research examples from both the broader field and studies conducted by the authors will be introduced.
Clustering Techniques
Introduction
As part of data mining, clustering techniques aim to seek meaningful patterns by analyzing given data sets with no predefined structures or labels (Witten, Frank, Hall, & Pal, Reference Witten, Frank, Hall and Pal2016). In the field of applied linguistics, for example, these techniques may help us to find hidden subgroups of similar language learning patterns which would not be identified by group-level averages. For many years, however, research in this field has focused on examining the effects of an intervention using inferential statistics based on traditional group-level data analyses (e.g., linear models such as analysis of variance and regression analysis; Dörnyei, Reference Dörnyei2007), and this line of research has been successful in providing a general idea of how effective a selected intervention is in improving learners’ language knowledge and skills. However, this approach does not reveal potentially meaningful subgroups with similar patterns or trajectories of language learning. For this reason, with an exponential increase in learners’ online language learning activities (Means, Bakia, & Murphy, Reference Means, Bakia and Murphy2014), we believe that clustering techniques can be useful in confirming whether L2 interventions work well for everyone or for certain groups of learners and in identifying which types of accommodations and instructions are more suitable for individual L2 learners.
The Douglas Fir Group (2016) recently introduced a transdisciplinary framework for applied linguistics that highlights the importance of understanding individual differences in L2 learning and teaching. Adapting Bronfenbrenner's bioecological model of human development (see Bronfenbrenner & Morris, Reference Bronfenbrenner, Morris, Damon and Lerner2006), they emphasize that “no two people, even those in the same classroom, will experience exactly the same social contexts of language use or resolve them in exactly the same way” (The Douglas Fir Group, 2016, p. 30). In other words, this approach focuses on the importance of looking at individual learners along with group-level averages. They suggest that inter- and intra-individual variations be interpreted as meaningful patterns of each individual's language learning; such variations are otherwise treated as measurement error in a traditional variable-centered approach. Likewise, clustering techniques can complement group-level analyses and thus have the potential to offer strong theoretical (e.g., understanding individual differences in L2 learning; Skehan, Reference Skehan1991), practical (e.g., identifying different types of L2 learners; Csizér & Dörnyei, Reference Csizér and Dörnyei2005), and pedagogical (e.g., providing personalized L2 instructions; Lee, Warschauer, & Lee, Reference Lee, Warschauer and Lee2019) contributions and implications for L2 research.
As briefly summarized in our previous study (Lee et al., Reference Lee, Warschauer and Lee2019), clustering techniques have often been used in the field of applied linguistics to identify L2 learner types across individual learner factors, such as aptitude, motivation, and strategies. Papi and Teimouri (Reference Papi and Teimouri2014) exemplified how L2 research has utilized the approach. Nonetheless, previous L2 studies were limited to traditional clustering techniques, which require researchers’ subjective decisions on the optimal number of clusters (Witten et al., Reference Witten, Frank, Hall and Pal2016), and could have collected and analyzed data obtained from an intervention. As part of data mining, alternative clustering techniques, in which the best number of clusters is automatically determined (Witten et al., Reference Witten, Frank, Hall and Pal2016), are widely used in addition to the traditional ones, so using both types of techniques along with data collected from an intervention may help us to overcome the limitation of only using group-level averages to capture detailed effects of L2 accommodations and instructions. In this section, we introduce a model-based clustering technique along with traditional clustering techniques in the context of corpus-based L2 vocabulary interventions.Footnote 1 We demonstrate and discuss how these techniques can be deployed to unearth hidden groups of learners and how the results can be interpreted to understand how they are similar to and different from each other.
Authors’ Research
In Lee, Warschauer, and Lee (Reference Lee, Warschauer and Lee2017), we conducted an experiment with 132 L2 participants to measure the effects of providing (a) corpus-based glossary information (i.e., data-driven learning [DDL]) as glossary information or (b) DDL plus additional confirmation opportunities (i.e., dictionary definitions of target vocabulary after concordance lines) on L2 vocabulary learning. In brief, results of data analyses at the group level indicated that the latter condition was more effective than the former DDL alone condition, which was still more effective than a control condition (i.e., no glossary). However, clustering techniques revealed hidden subgroups of learners who may require different types of DDL conditions to maximize their L2 vocabulary learning (for a review of L2 vocabulary learning in DDL, see Lee, Warschauer, & Lee, Reference Lee, Warschauer and Lee2018), and we demonstrate how the techniques were employed in this section. Two traditional and one alternative clustering techniques are described here, including hierarchical and nonhierarchical clustering and model-based clustering.
Traditional Clustering
Hierarchical clustering
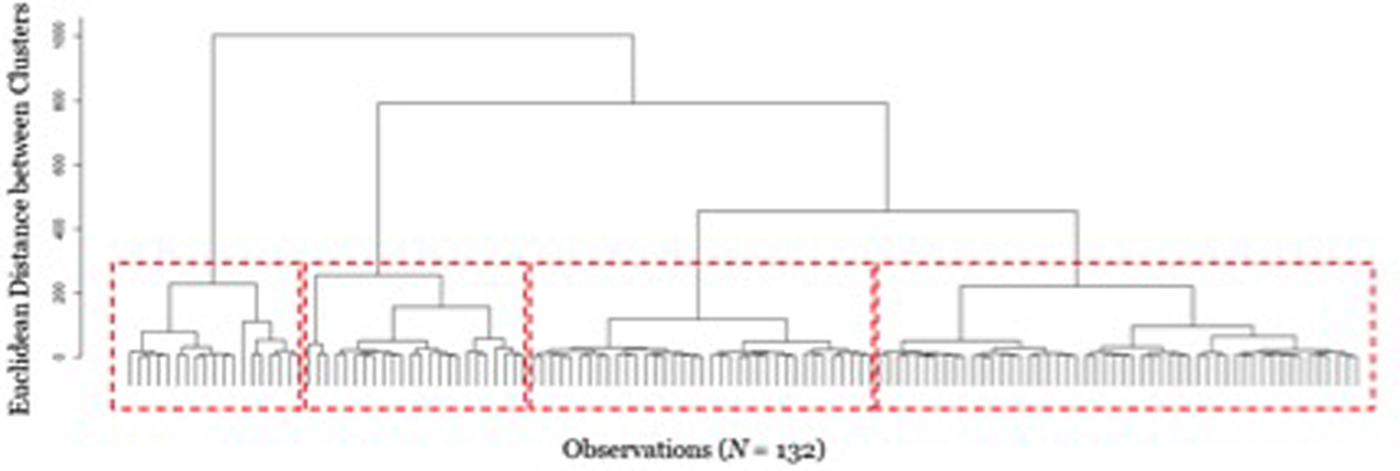
First, we selected Ward's method for hierarchical clustering, which can be employed by using R software along with the hclust package. Hierarchical clustering links groups of data points so that a set of nested clusters are organized in a tree-looking hierarchy (Attewell, Monaghan, & Kwong, Reference Attewell, Monaghan and Kwong2015). In this method, a program searches for a hierarchy of clusters to identify patterns or structures in the data set. Ward's method is widely used and provides cluster solutions without any predetermined assumptions (Bergman, Magnusson, & El Khouri, Reference Bergman, Magnusson and El Khouri2003). Its results are usually summarized in a tree diagram (or a dendrogram; see Figure 1), and researchers need to decide the optimal number of clusters based on this diagram.
Dendrogram of Ward's hierarchical clustering technique.

Figure 1 represents the results. We decided that a four-cluster solution was the best choice according to the visual clues of the hierarchy of clusters. Based on the selected cluster solution, we found that two clusters (n = 52 and n = 37), which we named “typical learners,” had the same learning pattern as that found at the group level (i.e., DDL + definitions > DDL alone > control; p < .05 for pairwise comparisons). A third cluster (n = 24), “DDL-sufficient learners,” had statistically comparable achievement in DDL + definition and DDL alone conditions, though the magnitudes of achievement differences varied. A fourth cluster (n = 19), “low-achieving learners,” had relatively low vocabulary gains across the three conditions with no statistically significant differences.
Nonhierarchical clustering
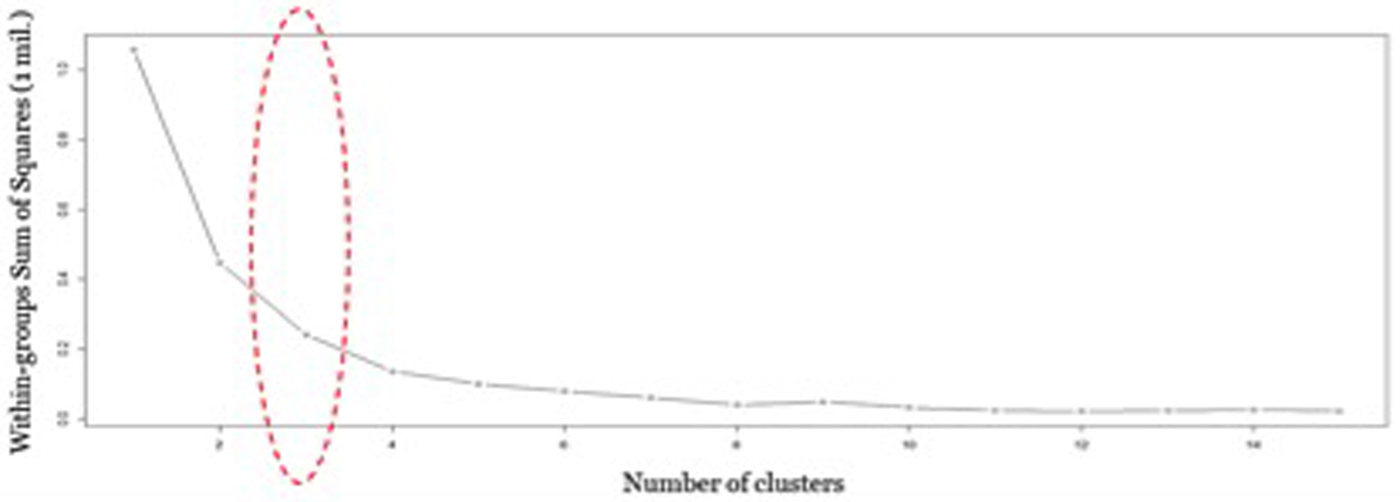
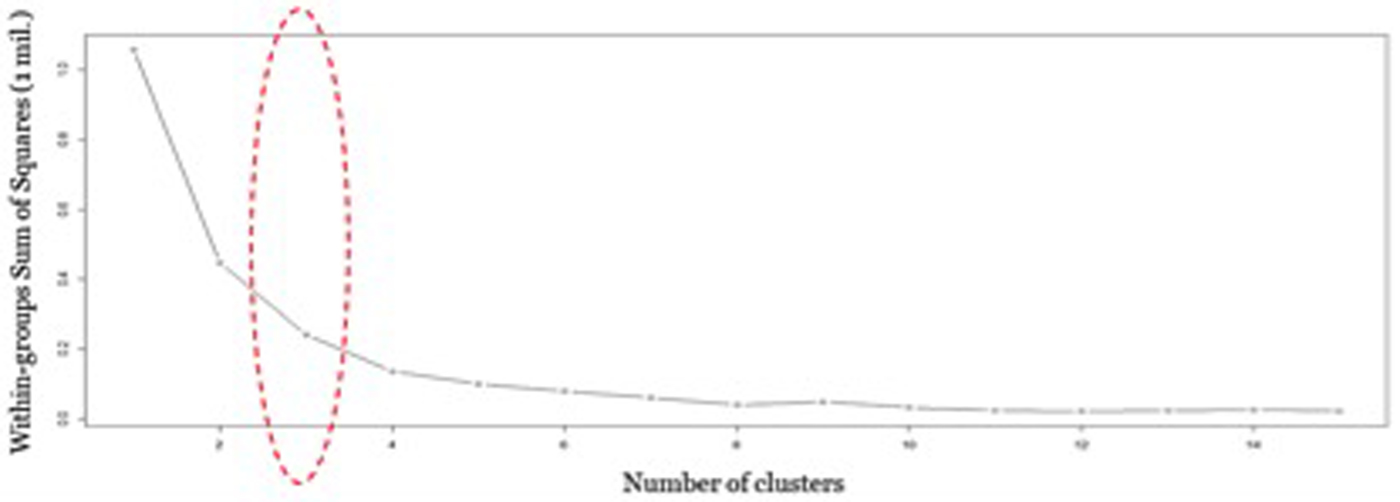
Second, for nonhierarchical clustering, we used k-means relocation for nonhierarchical clustering by using R software along with a special kmeans package. Nonhierarchical clustering assigns each data point to a divided set of non-overlapping clusters (i.e., the relationship between clusters has no hierarchy; Attewell et al., Reference Attewell, Monaghan and Kwong2015). K-means is one of the most widely used clustering methods due to its simple algorithms and efficiency. One of its drawbacks is that it is highly dependent on and sensitive to the initial k cluster centers. In this method, a program identifies k clusters as centers from the data set and then locates observations closest to these centers to redefine k clusters. Until the centers become stable, the program continues assigning observations to k clusters to relocate the centers.
Figure 2 represents the results. We found that there was a more noticeable jump between two- and three-cluster solutions compared to between three- and four-cluster solutions, and thus we chose the three-cluster solution as the preferred one. Note that our interpretation of “inconsistent jumps” was entirely subjective.Footnote 2 The selected three-cluster solution indicated that the students in two clusters (n = 69 and n = 38) were “typical learners” who had the same learning pattern as that found at the group level (i.e., DDL + definition > DDL alone > control; p < .05 for pairwise comparisons) and that the third cluster of students (n = 25) were “DDL-insufficient learners” (i.e., DDL + definition > DDL alone ≈ control; at the 5% significance level), corresponding to what we found from model-based clustering, which will be discussed in the following section.
A scree plot of k-means clustering.
Model-Based Clustering
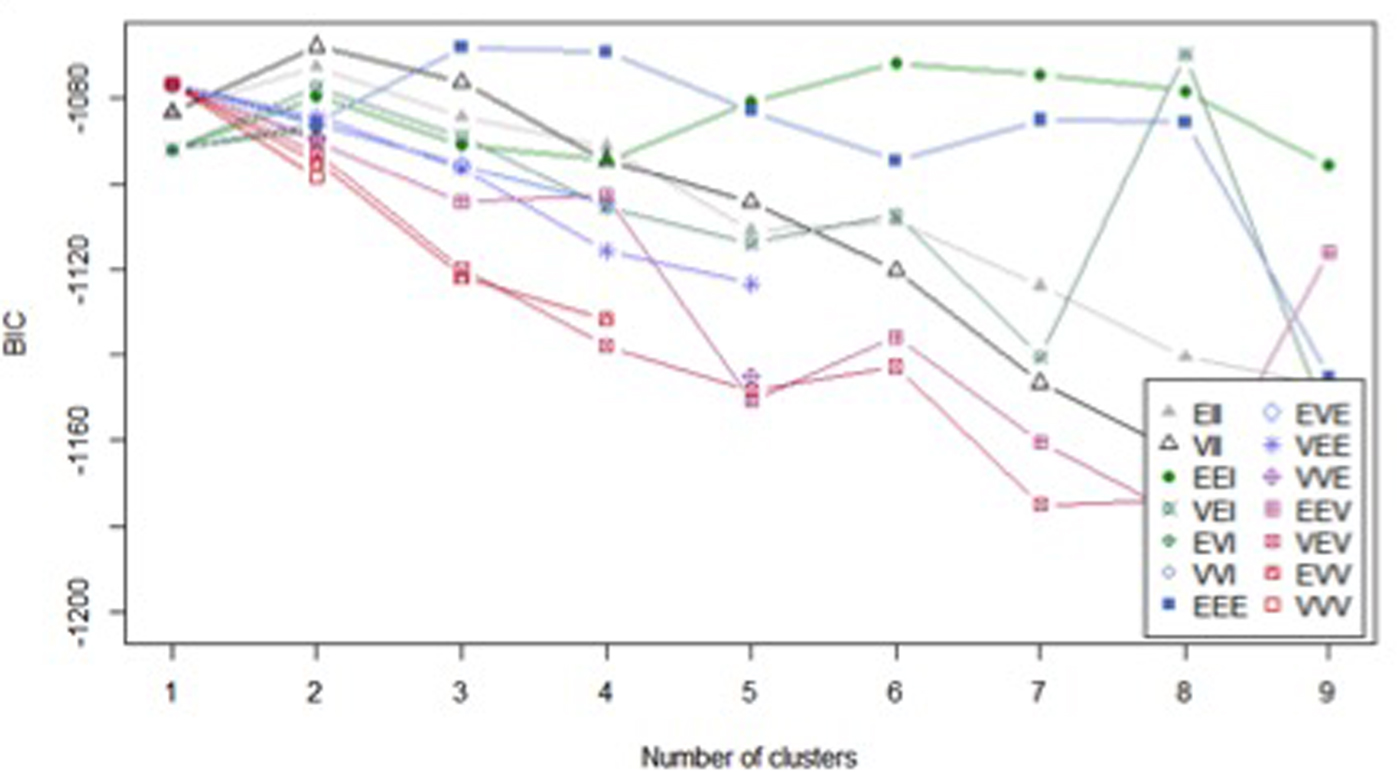
In Lee et al. (Reference Lee, Warschauer and Lee2019), we used R software along with the mclust package (entitled “Gaussian mixture modelling for model-based clustering”; Fraley, Raftery, Scrucca, Murphy, & Fop, Reference Fraley, Raftery, Scrucca, Murphy and Fop2017). The mclust package version 5.3 has 14 predefined Gaussian models that have different characteristics of distributions, volumes, shapes, and orientations, and its main goal is to identify which cluster solution across 14 approaches best explains and fits the data according to the expectation and maximization (EM) algorithm.Footnote 3
Figure 3 represents the results. We found that a two-cluster solution computed by model VII (one of the 14 models shown in Figure 3) had the lowest Bayesian information criterion (BIC) value (BIC = −1067.78), indicating that this solution was the optimal mixture model estimation. After the identification of the cluster membership, we re-analyzed the data to understand how these two clusters (n = 82 and n = 50) were similar to and different from each other. In short, we named the two identified subgroups “DDL-sufficient learners” (i.e., DDL + definition ≈ DDL alone > control; at the 5% significance level) and “DDL-insufficient learners” (i.e., DDL + definition > DDL alone ≈ control; at the 5% significance level). Thus, DDL alone was sufficient for the first learner type to make accurate meaning inferences for target vocabulary, with no statistically significant benefits from additional confirmation processes, whereas for the second learner type, DDL alone was insufficient as achievement with DDL alone was statistically equivalent to achievement in the control condition.
Optimal number of clusters based on Bayesian Information Criterion (BIC) according to 14 Gaussian models using mclust package. The 14 predefined Gaussian models (i.e., EII, EVE, VII, VEE, EEI, VVE, VEI, EEV, EVI, VEV, VVI, EVV, EEE, VVV) have different characteristics of distributions, volumes, shapes, and orientations. A cluster solution with the lowest BIC value across the 14 models (a two-cluster solution computed by VII model) is considered to be the optimal number of clusters.

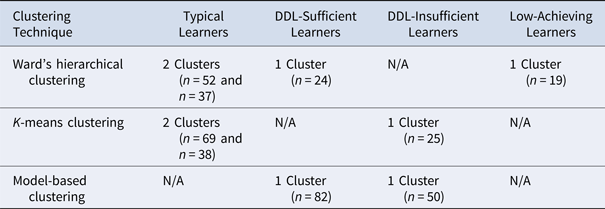
So far, we introduced two traditional and one alternative clustering technique as part of data mining and described how they can be applied for L2 research. Based on rich information on learners’ L2 vocabulary achievement in DDL at the individual level, the findings showed that the superiority of providing more glossary information regarding target lexical items was not always valid for some individuals (e.g., DDL-sufficient, DDL-insufficient, or low-achieving learners), indicating that different learner types may need different vocabulary learning conditions to maximize their L2 vocabulary learning potentials in DDL. Using the model-based clustering approach, we found that learners’ L2 proficiency was crucial to the success of DDL; therefore, the impact of DDL may be greater for those with high L2 proficiency, and more direct and explicit vocabulary learning accommodations, such as dictionary definitions of target vocabulary items, may be more effective for DDL-insufficient learner type (with low L2 proficiency). As shown in Table 1, we found that such an implementation could either present a similar result across techniques or a conflicting finding, which itself could be of theoretical and practical interest.Footnote 4
Overview of Cluster Memberships From Three Clustering Techniques

Text Mining and Visualizations
Introduction
Emerging digital literacy practices are increasingly characterized as participatory, collaborative, fluid, and distributed in nature (The New London Group, 1996; Lankshear & Knobel, Reference Lankshear and Knobel2007). To appropriately capture and understand the dynamics of these new literacy practices and their implications for teaching, we need more fine-grained analysis of data incidental to learning. Since online writing activities are easily archived and transmitted (Warschauer, Reference Warschauer1997), researchers can obtain multiple data points. For example, log data available in writing platforms, such as timestamps, keystrokes, edit histories, and clickstreams, can be automatically captured and recorded. However, unlike structured data, which provide predetermined data models such as learner databases, these unstructured log data are often incidental “data exhaust” (Behrens & DiCerbo, Reference Behrens, DiCerbo, Larusson and White2014) and therefore do not immediately lend themselves to any particular interpretation (Cope & Kalantzis, Reference Cope and Kalantzis2016).
Text mining is one type of data-mining technique that converts unstructured text for measurable analysis (Srivastava & Sahami, Reference Srivastava and Sahami2009). Also called “knowledge discovery in text,” a text-mining method broadly refers to the process of extracting hidden patterns or information from unstructured text revealing indicators of learning, such as types of activity, navigation paths, and patterns of social interaction (Cope & Kalantzis, Reference Cope and Kalantzis2016). Text mining encompasses a wide range of techniques, which include text categorization, information extraction, topic modeling, and visualization (Feldman & Sanger, Reference Feldman and Sanger2006). These techniques have assisted researchers in the fields of bioscience, business, and informatics in discovering patterns and making connections in large bodies of text data, or in analyzing text characteristics using specific techniques such as natural language processing (NLP; Biber & Reppen, Reference Biber and Reppen2015).
In writing research, text-mining techniques have been employed to understand individual writing behaviors and developmental processes mainly through computational linguistics or analyses based on keystrokes, clickstreams, or edit history data (Cope & Kalantzis, Reference Cope and Kalantzis2016). NLP-based tools that detect specific linguistic information (e.g., syntactic complexity, lexical diversity) from large amounts of natural language data have been widely used in L2 writing research. Research that integrates NLP tools such as Coh-Metrix has revealed critical information on textual characteristics (Crossley & McNamara, Reference Crossley and McNamara2009), text readability (Crossley, Greenfield, & McNamara, Reference Crossley, Greenfield and McNamara2008), and factors influencing essay quality (Crossley, Kyle, & McNamara, Reference Crossley, Kyle and McNamara2016). For example, research has revealed important lexical and syntactic characteristics in L2 writing, such as weaker lexical associations and more limited use of causal cohesion compared to first language (L1) writing (Crossley & McNamara, Reference Crossley and McNamara2009) and the predictive power of phrasal complexity for L2 writing growth (e.g., Crossley & McNamara, Reference Crossley and McNamara2014). NLP-driven text analysis techniques have been validated in several studies (e.g., McNamara, Ozuru, Graesser, & Louwerse, Reference McNamara, Ozuru, Graesser, Louwerse, Sun and Miyake2006) and integrated in automated writing evaluation (AWE) and intelligent tutoring systems (ITS). These programs provide specified feedback based on analysis of errors and characteristics of discourse, organization, and idea development. The pedagogical value and validity of AWE, as well as its associated classroom practices, have been widely researched by L2 writing scholars (e.g., Chapelle, Cotos, & Lee, Reference Chapelle, Cotos and Lee2015; Liu & Kunnan, Reference Liu and Kunnan2016).
Real-time data collection and analysis based on keystroke logging has also been actively employed in writing process research, particularly to examine revision activities. Keystroke logging refers to techniques that produce a record of keyboard presses and mouse movements (Lindgren & Sullivan, Reference Lindgren and Sullivan2002). Using keystroke analysis, researchers have examined the quantity and types of online revisions; specific revision behaviors, such as pause, repetition, and deletion; and their differential patterns across task type and structure (e.g., Miller, Lindgren, & Sullivan, Reference Miller, Lindgren and Sullivan2008). Leijten and Van Waes (Reference Leijten and Van Waes2013) integrated keystroke logging, dynamic network analysis, and process data-mining techniques in their investigation of composing processes of email and tweet writing. Based on the visual representations of writing processes supported by dynamic network analysis, which reveals the interaction between writing sources and the percentage of time spent on each source, they explored the complex navigation pathways of digital writers as they search and consult multiple online sources. By visualizing these complex pathways, they unveiled the changing nature of composition behaviors and processes in digital contexts and underscored the need to incorporate information literacy, such as searching and consulting digital sources, in 21st-century writing instruction. In addition, the process graph generated from ProM Framework, a data miner, enabled the comparison of writing process and behavior of certain subgroups (e.g., experts vs. novices) during tweet writing, such as the sources that were accessed and the revisiting behaviors. Given that interaction with multiple sources is an inherent part of digital writing, the visualizations (e.g., flow graph, network analyses) provided useful insights into the complexity of the writing process and attribution of the different sources.
Authors’ Research
While the aforementioned studies focused on individual writing behaviors and processes using NLP or keystroke analysis, a less examined area that the application of text mining can be particularly beneficial to is collaborative writing research. The increasingly diversifying types and capacities of collaborative technologies have brought new ways of writing characterized by nonlinear interaction and multiple entry points for participation. For example, real-time editing and writing functionalities in Google Docs involve multiple between-draft revisions by collaborators during the recursive and intertwined composing processes (see Yim & Warschauer, Reference Yim, Warschauer, Hyland and Shaw2019b). Such synchronous group writing practices often encompass complex modes of collaboration and coordination, calling for an advanced technique to identify discernible learner behaviors or patterns. New text-mining tools specifically designed to extract usage information from web-based writing platforms can assist in elucidating the real-time collaboration process by quantifying or visually representing editing behaviors (Yim & Warschauer, Reference Yim and Warschauer2017). In our research, we integrated two text-mining tools, SCAPES and DocuViz, to explore the characteristics of multiauthored documents and the distinct styles of collaboration in synchronous online environments.
Exploring Multiauthored Documents
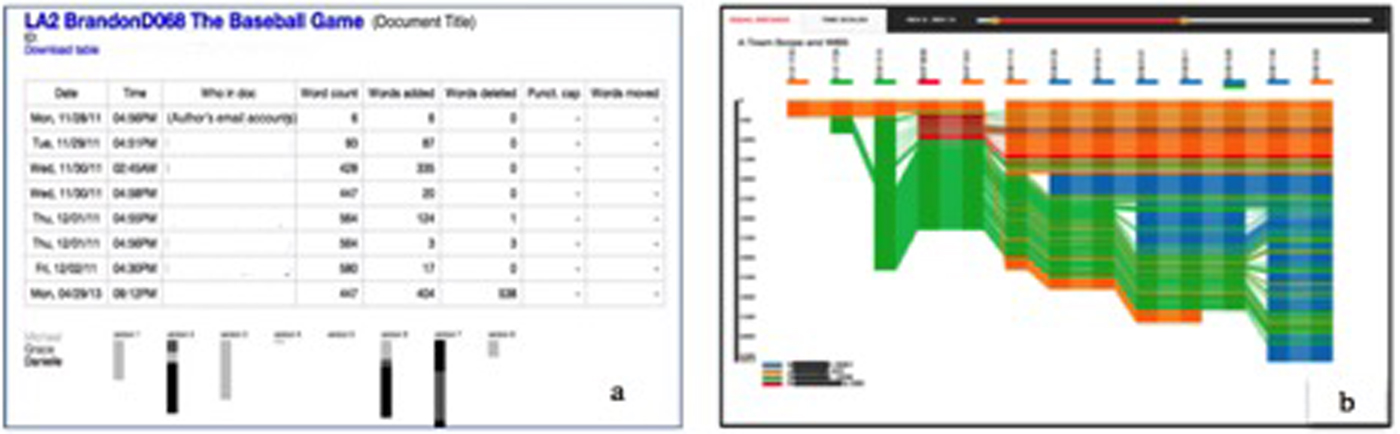
In our earlier study, we used a text-mining tool called SCAPES (Studying Collaborative Authoring Practices in Educational Settings) to analyze a large data set of Google Docs (N = 3,537) collaboratively written by 257 middle school students (Zheng, Lawrence, Warschauer, & Lin, Reference Zheng, Lawrence, Warschauer and Lin2015). This tool, developed by an interdisciplinary research team at the University of California, Irvine, automatically produces revision history spreadsheets reporting the version date and time, authors, word count, words added, and words deleted (Figure 4a) of up to 100 documents in a single run. By providing measurable data on editing behaviors of multiple authors, this tool assists with fine-grained analysis of group writing on Google Docs, particularly in large-scale data sets. Representing an initial effort to integrate text mining in order to empirically examine students’ long-term engagement with writing using Google Docs over the course of an academic year, this study revealed several key aspects of collaboration that would not have been attained with qualitative case studies of short-term experimental group tasks. For example, using longitudinal growth models, we examined writing growth trajectories across edit sessions and found that documents with multiple contributors were drafted more slowly and had fewer words added during each editing session than single-authored documents. The results suggested that the advantage of multiple authorship of documents only becomes apparent when we consider the fact that documents with more contributors were worked on more. Even though multiauthored documents started small and grow slowly, they ended up larger (on average) than single-authored documents, suggesting that active editing among multiple authors may promote quantity and productivity in writing.
SCAPES' revision history spreadsheets reporting version date/time, authors, word count, words added, and words deleted (a). DocuViz views of participation in co-authoring a document, with legend providing the editing information (amount and source). Vertical bars are the slices with authors noted in colors; the size of their contribution is represented by the size of the bar (b).

Text Visualization and Collaborative Writing Styles
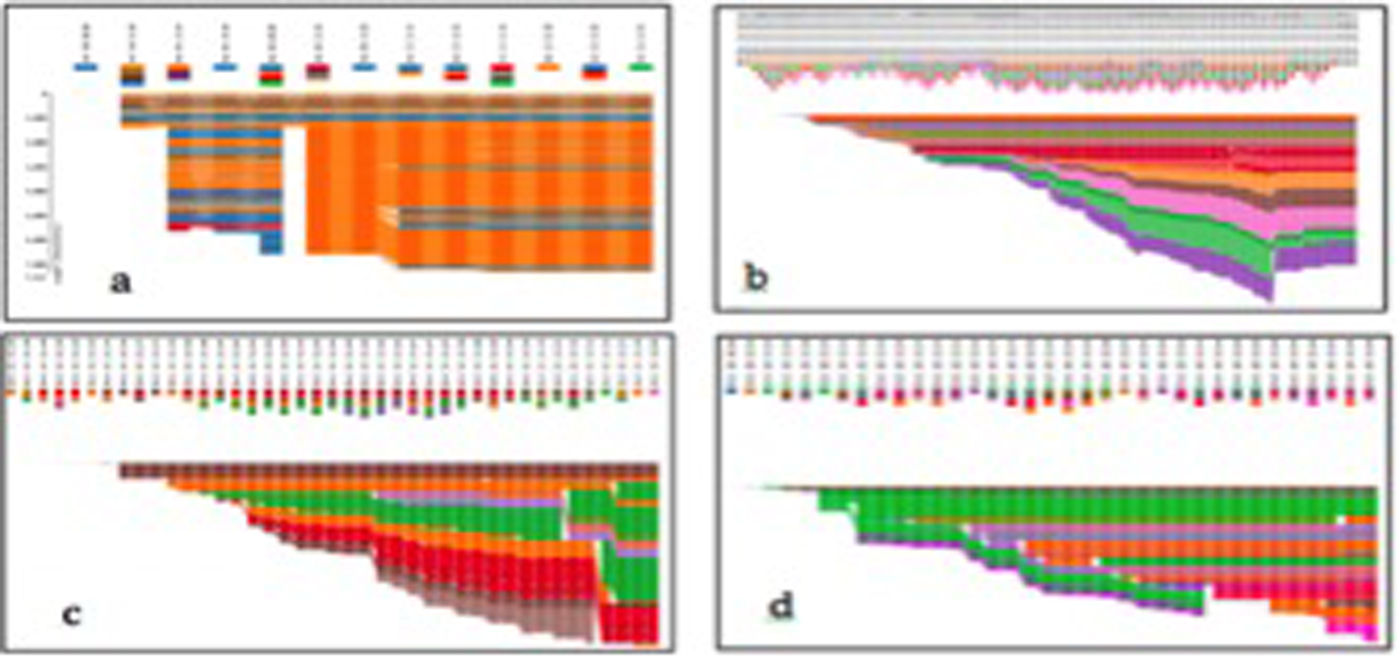
Our most recent research explores the potential of text visualizations by integrating DocuViz, which provides a visual history chart that illustrates real-time editing processes in Google Docs, in addition to usage statistics. Similar to SCAPES, DocuViz uses the editing information gleaned from the revision histories and tracking changes on Google Docs, but provides additional information on the feedback source (peer vs. self-edit) and produces a visualization chart across different time points, indicating the authors, their portions of writing, and the time of editing (Wang, Olson, Zhang, Nguyen, & Olson, Reference Wang, Olson, Zhang, Nguyen and Olson2015, see Figure 4b). Our mixed methods study (Yim, Wang, Olson, Vu, & Warschauer, Reference Yim, Wang, Olson, Vu and Warschauer2017) used DocuViz to identify the distinct patterns and characteristics of undergraduate groups’ synchronous writing on Google Docs and their impacts on the quality and quantity of group texts. The visualization charts were qualitatively coded and categorized into four distinct patterns (see Figure 5): (a) main writer style dominated by one or two main writers, (b) divide and conquer style displaying parallel and simultaneous composition of individual sections in real-time, (c) cooperative revision style involving peer feedback at the later stages of the composition process, and (d) synchronous hands-on style in which members build off each other's texts during a “simultaneous branching of ideas,” as described by an interviewee. Afforded by the unique simultaneous editing features in Google Docs, the synchronous hands-on style was used by groups as they engaged in an active addition and expansion of each other's text. In addition, we found that balanced participation and editing led to longer texts with higher quality scores, particularly in the areas of content and evidence, as well as more diverse use of vocabulary in group texts.
DocuViz text visualizations displaying (a) a main writer style: the person depicted as orange wrote most of the document, while other members (blue, red, green) contributed minimally; (b) divide and conquer style: each member contributed to the predetermined sections individually, displaying no mingling of colors; (c) cooperative revision style: members crossing into each other's writing at a later stage, displaying peer editing; and (d) synchronous hands-on style: much mingling of colors early, and peer editing happens throughout.

We further extended this line of inquiry by looking more specifically at the role of contextual factors that shape collaboration in a middle school context (Yim & Warschauer, Reference Yim and Warschauer2019a). In a longitudinal case study that followed 102 students’ yearlong synchronous collaborative writing practices in a middle school with a large population of language minority learners, we examined multiple aspects of collaborative writing characteristics (i.e., balance of written participation, editing amount, the use of collaborative writing strategies) using DocuViz. We found that these characteristics tended to differ across two key contextual factors: ability-grouping status and task types. For example, we compared the editing behaviors between different ability groups (same- vs. mixed-ability groups) and found that mixed-ability groups demonstrated patterns of unbalanced participation (e.g., frequent use of main writer style) with a higher number of self-edits compared to same-ability groups. The results indicate that groups consisting of members with different levels of writing ability may not have equal distributions of work among individual members and are generally more active in self-editing behaviors than groups with similar writing abilities. Based on both quantitative analysis and qualitative analysis of writing visualization charts, we also noted variations in collaboration characteristics across three genre types (i.e., narrative, argumentative, informative). We found that groups tended to employ more balanced and cooperative strategies of collaboration in argumentative and informative tasks, whereas more unbalanced yet sustained collaboration characterized group work in narrative essay task. Qualitative analysis of student interviews indicated that the different genre characteristics—narrative being less structured and more open-ended than the other two genres—affected how they collaborated.
In addition to the overall tendency of collaboration characteristics across groups and task types, we qualitatively examined the interaction patterns of four focal groups (N = 16) composed of both nonnative speakers of English and monolingual English speakers in each group. Based on multiple sources of triangulation data, including the group's face-to-face oral discussion data, interviews, observations, self-reflection essays, and editing information and visualization charts extracted from DocuViz, we found that the four focal groups exhibited distinct patterns of interaction and collaboration: (a) collectively contributing/mutually supportive, (b) expert/novice, (c) authoritarian/passive, and (d) dominant/withdrawn patterns. We found that the groups with a collaborative stance (i.e., patterns 1 and 2) actively engaged in providing peer scaffolding (i.e., recruiting interest, task regulation, intersubjectivity; Wood, Bruner, & Ross, Reference Wood, Bruner and Ross1976) regardless of the proficiency gaps within their group and showed flexible use of collaboration styles and distributed roles across different task types. In collaborative groups, L2 members noted the benefits of peer modeling and observation during synchronous hands-on collaborative writing. Particularly, the students discussed that the immediate instantiation and visibility of the textual changes supported by oral discussion helped them notice and reflect on linguistic problems more effectively (for details, see Yim & Warschauer, Reference Yim, Warschauer, Hyland and Shaw2019b). In contrast, groups with a noncollaborative stance (i.e., patterns 3 and 4) were characterized by stagnated and peripheral participation of low-proficient L2 writers, fixed use of collaboration style across task types, and limited use of peer scaffolding strategies during oral discussion.
The distinct collaboration practices illuminated by triangulating quantitative, qualitative, and text-mining data underscore the centrality of group dynamics that lead to differential styles of interaction, edit behaviors, and scaffolding. In addition, the results indicate the critical role of key contextual factors—grouping arrangement and task type in the design and implementation of collaborative writing. Understanding the unique structural and participatory patterns in synchronous environments will help language educators develop pedagogical approaches that maximize the affordances of text-based synchronous tools—enhancing participation and collaboration among students and equipping students with digital literacy skills essential for today's world.
Social Network Analysis
Introduction
Computer-mediated communication bridges the gap between face-to-face oral communication and written language by permanently recording students’ interactive communication for further reflection and discussion (Zheng & Warschauer, Reference Zheng and Warschauer2015). Various methods have been employed to examine learners’ online interactions, such as content analysis (e.g., Calderon & Sood, Reference Calderon and Sood2018; Carico & Logan, Reference Carico and Logan2004) and discourse analysis (e.g., Chiu & Fujita, Reference Chiu and Fujita2014; Grisham & Wolsey, Reference Grisham and Wolsey2006). For example, Grisham and Wolsey (2006) employed discourse analysis to examine online threaded book discussions among eighth graders and found that such discussions assisted student engagement and encouraged more in-depth thinking in eighth-grade humanities classrooms. In another study, Carico and Logan (2004) examined eighth graders’ online discussion in their language classrooms with their university WebPals using content analysis and found that the two groups of students actively engaged in peer interaction, as they clarified confusing texts and made connections among readings.
However, an online discussion platform does not ensure equal participation across all students. Social network analysis has been increasingly adopted in education to examine group interactions and behavior patterns among participants (e.g., Shea et al., Reference Shea, Hayes, Smith, Vickers, Bidjerano, Gozza-Cohen and Tseng2013; Sun, Lin, Wu, Zhou, & Luo Reference Sun, Lin, Wu, Zhou and Luo2018; Xie, Di Tosto, Lu, & Cho, Reference Xie, Di Tosto, Lu and Cho2018; Zhu, Reference Zhu2006). A social network is established when a group of individuals exchange information and interact with each other for the purpose of achieving certain learning goals. The analysis of social networks is distinct from other individual-based approaches that dominate educational research (Carolan, Reference Carolan2014). Social network analysis could be used to explore the relationship between participants in a network, the overall network structure, and the network dynamics over time. The interlinking between online discussion threads could indicate interactive relationships and identify learning communities among participants (Chin & Chignell, Reference Chin and Chignell2007; Gabbriellini, Reference Gabbriellini2014). Software such as UCINET (Borgatti, Everett, & Freeman, Reference Borgatti, Everett and Freeman2002) and Pajek (de Nooy, Mrvar, & Batagelj, Reference de Nooy, Mrvar and Batagelj2005) visually depict the interactions and network structure. For example, to investigate college students’ interaction and cognitive engagement during online discussion, Zhu (Reference Zhu2006) adopted a combination of social network analysis and qualitative content analysis. In that study, the author examined four discussion networks and identified two types of interaction in the asynchronous online discussions: star and interconnected networks. The former is a centralized network with a single point of centrality with low network density, implying that besides the centralized participant, either a student or an instructor, other members had little interactions among each other. The central person gains main power in the network, usually controlling the overall direction of the discussion. The latter type, an interconnected network, usually has more than one point of centrality. It is usually not dominated by a single student or the instructor. Participants in this type of network have more conversations and exchange ideas more frequently. Zhu's study also indicates that instructors’ participation is closely related to the types of interaction, as an adequate number of messages from the instructor could lead to higher levels of cognitive engagement during discussion.
While most of the current research adopting social network analysis to examine online interactions was primarily in higher education, little such research has been found in K–12 language learning. Thus, the purpose of this section is to present how social network analysis could be adopted to examine student–student and teacher–student interactions in language learning among linguistically diverse elementary students.
Authors’ Research
We conducted a social network analysis among 48 fifth-grade students who participated in a reading-writing connection activity in their English language arts classroom. While the teacher was reading a chapter aloud or showing a video to the entire class, students were asked to post in an online discussion platform with their comments, questions, or responses simultaneously. CoveritLive, a web-based live blogging tool that can be embedded into blog entries, was used to support synchronous online discussions. Students were able to see each other's comments instantaneously, and when one live event ended, all discussion threads were automatically saved as a single entry on the class blog. Upon permission from the school district, we accessed all students’ online discussion threads during the school year. We also accessed de-identified code that linked names in the online discussion threads with students’ demographic information, including gender and English language proficiency level.
Data Organization
We sampled from discussions that occurred during the first 2 months of using the online discussion platform (a total of 584 posts) and the last 2 months of using the platform (a total of 650 posts) to compare patterns at the beginning and end of the school year. In order to examine how participants’ interactions and the structure of the learning community changed over time, social network analysis was used to develop sociograms of the interactions. To produce a sociogram, we took several steps to clean and organize the data. First, we manually counted (a) each student's total number of posts and (b) the number each student's responses to another student, which was indicated by @ in a discussion thread. Second, a 49 × 49 matrix (48 students plus one teacher) was created. The entry in column A and row A represented the number of student A's posts and the entry in column A, and Row B indicated the number of student A's responses to student B. For example, if student A generated a total of 40 posts and responded to student B a total of five times, the number in [A, A] was 40 and the number in [A, B] was 5. Separate matrixes for the first 2 months and last 2 months were created. After that, using data provided by the school district, we also generated another spreadsheet to represent attributes of each participant. These attributes included gender, English language proficiency status, and number of posts.
Data Analysis
After the data were organized into the aforementioned spreadsheets, they were imported into the software program UCINET to analyze the data and produce sociograms. We used the function “Import text data from spreadsheet” to save both matrixes and attribute data as a single UCINET data set. Then the function “Visualize network with NetDraw” was used to generate sociograms as output.
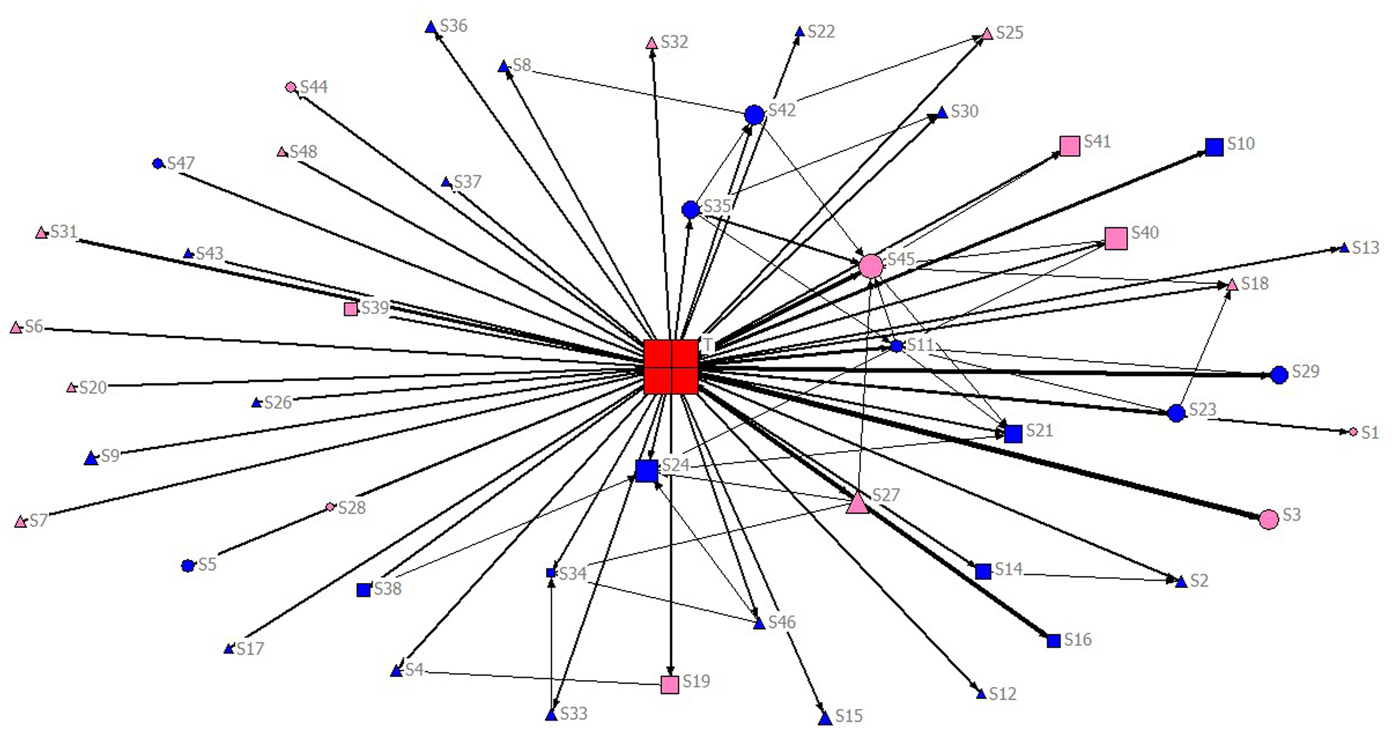
The two basic components of social network analysis are nodes (i.e., individuals) and ties (i.e., connections). In this study, the nodes represented individual participants, including teachers and students, in the online discussions. Attributes of each participant can be distinguished by the size, color, and shape of their nodes. In this study, the size of each node indicates the number of posts each participant made: The larger the node, the more discussion threads the participant posted. The color of each node indicates gender: pink for female and blue for male students. The shape of each node indicates students’ English language proficiency status: Circles represent native English speakers (NES), squares represent fluent English proficient (FEP) students, and upward-pointing triangles represent limited English proficient (LEP) students. The teacher's node is represented using a red box. Lines connecting two nodes represent the interaction between the two participants. Characteristics of the interactions between participants can be distinguished by the thickness of the lines and the direction of the arrows connecting them. Line thickness indicates the frequency of interactions, with thicker lines indicating a greater number of interactions between two participants. The direction of the arrow represents the direction of interaction, with an outward arrow indicating responses to others’ posts and an inward arrow indicating the receipt of feedback from other participants.
Results
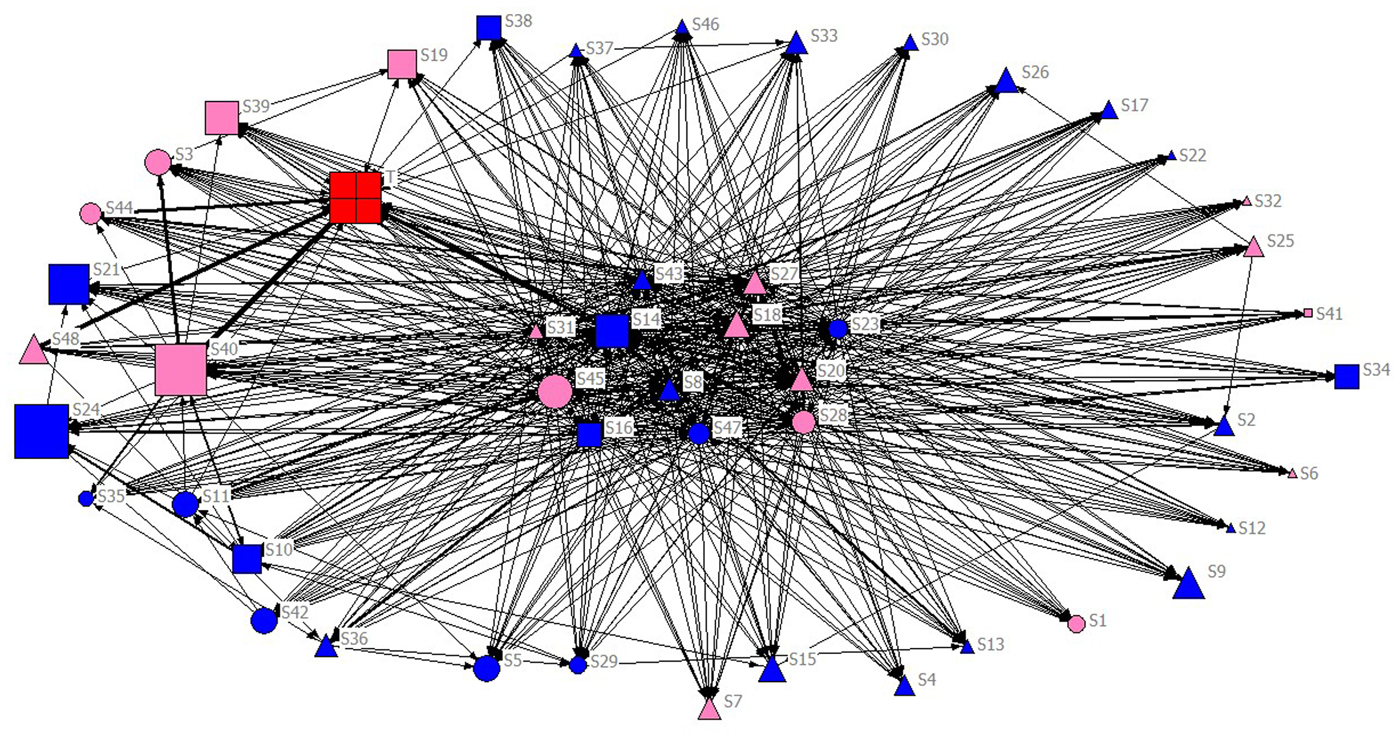
The sociograms of student–student and teacher–student interactions in online discussions in the first 2 months (Figure 6) and the last 2 months (Figure 7) are presented next. As shown in Figure 6, the network in the first 2 months of the study was teacher-centered (with the red box being in the center of the network). Compared to individual students, the teacher generated the most posts; moreover, the trajectories of most interactions in this network were from teacher to student, as indicated by the direction of the arrows. Few interactions between students were detected, and student-originated interactions with the teacher were also relatively rare. This suggested that, in the first 2 months, the discussions were dominated by the teacher. All students generated a certain number of posts; however, they received very little feedback from their peers. They also responded to the teacher's posts infrequently. As a result, the sociogram of the first 2 months was centered on the teacher and radiated from her to all of the other participants in the online discussion. No significant differences were detected between male and female students or between students with different English proficiency levels.
Sociogram of student-student and teacher-student interactions in the first two months of using the classroom online discussion platform.

Sociogram of student-student and teacher-student interactions in the last two months of using the classroom online discussion platform.

Figure 7 depicts classroom online discussion interactions in the last 2 months of the study. The sociogram was dramatically different from that of the first 2 months. Overall, the size of the nodes was much bigger; also, neither of the two biggest nodes (indicating the most active participants) represented the teacher, but rather two FEP students (labeled S24 and S40). The network was much denser and connected than before, and interactions were more frequent. The most significant change was that the network was no longer teacher-centered; instead, it became centered around a group of students, as shown in Figure 7. A total of 12 students occupied the center of this network, as they were the most actively engaged in both responding to peers’ comments and receiving feedback from peers. These 12 central students included both females and males, and half of them were LEP students (represented by nodes S8, S18, S20, S22, S31, S43), with the other half including three NESs (nodes S23, S28, S45) and three FEPs (nodes S14, S16, S47). This suggests that although LEP students generated fewer posts in total than both NES and FEP students, many of them were actively interacting with others during the last 2 months of sessions. In addition, even students who were in the peripheral area of the network had a certain level of interaction with their peers, as can be seen from the arrows on the surrounding areas. These findings align with previous research suggesting that computer-mediated communication could be especially beneficial for English learners because it may increase their level of interaction with peers and teachers (e.g., Sun & Chang, Reference Sun and Chang2012).
Judging by the two sociograms, the teacher's role changed profoundly over the course of the study. First, the teacher posted less in the last 2 months than in the first 2. Second, the teacher's position within the network moved from the center to a more peripheral location. In addition, as seen from the directional arrows, in the first 2 months, the teacher mostly had outward interactions, but in the last 2 months, the teacher's node had more inward arrows than outward ones, which reveals that more students responded to the teacher's posts than the other way around. This suggested that after students participated in the online discussion activity for a few months, their online discussion changed from teacher-centered to student-centered.
In summary, over the course of the school year in the online discussion platform, student–student interactions became more dynamic, and the community was no longer dominated by the instructor, but operated in a distributed manner suggesting that teachers and students shared a role as co-constructors of knowledge. This aligns with previous studies (e.g., Kern, Reference Kern1995; Satar & Akcan, Reference Satar and Akcan2018) indicating that computer-mediated communication provides a favorable environment for improving student–student interaction and lessening teacher domination of discussion. Furthermore, the graphical representation of the social network analysis clearly illustrates the positive change in interaction patterns that occurred over time in the classroom online discussion environment.
Conclusion
Integration of data-mining techniques in educational research can provide new ways of examining learner behaviors and optimizing learning opportunities tailored to students’ levels of need and ability (Johnson, Smith, Willis, Levine, & Haywood, Reference Johnson, Smith, Willis, Levine and Haywood2011). The three examples that we introduced—clustering techniques, text mining, and social network analysis—illustrate how new data points accessible in online environments can be analyzed to better understand individual learners’ response to a web-based tool, as well as aspects of learner interaction mediated by synchronous writing platforms or blogs.
First, the use of clustering techniques as part of data mining helps researchers and educators to better understand the diversity of learning patterns (e.g., Csizér & Dörnyei, Reference Csizér and Dörnyei2005; Skehan, Reference Skehan1991) and personalize L2 instruction for better learning outcomes (e.g., Lee et al., Reference Lee, Warschauer and Lee2019). Whereas research on L2 learning and instruction has been dominated by analyses at the group or average level (i.e., the one-size-fits-all approach), data mining can offer different perspectives that may better suit individual learners. For example, Lee et al. (Reference Lee, Warschauer and Lee2019) found that providing DDL activities is effective for L2 vocabulary learning in general, but that learners’ L2 proficiency played a significant role in determining the magnitude of the effect, and suggested that DDL is less effective for those with low L2 proficiency. In this way, our suggested approach may allow us to take a step away from the dichotomous “good versus poor” paradigm (Kojic-Sabo & Lightbown, Reference Kojic-Sabo and Lightbown1999, p. 190). As technologies and learner data are becoming more complex and L2 learning theories and approaches are evolving (Chapelle, Reference Chapelle2007; Thorne & Smith, Reference Thorne and Smith2011), clustering techniques can reveal more robust statistical patterns of L2 learning achievement and behavior, and thus better inform L2 teaching. Future studies are encouraged to consider use of clustering to complement group-level data analyses.
Second, the integration of text mining has the potential to enhance L2 writing research by helping us better understand the emerging genres and forms of digital literacy, such as synchronous collaborative writing. The usage statistics and visualizations of real-time editing and writing data, both at the individual and document level, can allow researchers to examine the characteristics, patterns, and contextual factors of synchronous collaboration, and the particular affordances of synchronous technology for L2 learners. For example, the variables extracted from text-mining tools can help us understand more specifically what factors or conditions (e.g., group members’ language proficiency, task types) may facilitate or constrain students’ editing behaviors and collaboration styles in synchronous contexts. In classrooms, teachers are encouraged to provide specific instructional arrangements that can promote positive group dynamics and ensure meaningful participation of low-proficient learners in mixed groups, for example, through feedback training, role assignments, or structured interaction (e.g., Saddler & Graham, Reference Saddler and Graham2005; Yarrow & Topping, Reference Yarrow and Topping2001). In addition, the diverse styles of synchronous collaboration need to be carefully considered in task design and instruction so that students engage in sustained and collaborative group work. Considering the potential affordance of synchronous hands-on writing (e.g., simultaneous crafting of a sentence) for L2 learning, such as enhanced noticing of input through the immediate instantiation and visibility of textual changes, future studies can explore how the integration of real-time collaboration in instruction may lead to writing development. Based on our initial findings that shed insights into new patterns and characteristics of synchronous collaborative writing, future studies may continue to examine both the language learning and socialization opportunities that these new technological arrangements offer.
Third, with the historical development of computer-assisted language learning (CALL) from structural to integrative CALL and the rapid development of technology (Kern & Warschauer, Reference Kern, Warschauer, Warschauer and Kern2000), data in CALL have also shifted from static data, such as performance or document data, to more dynamic and rich data, such as discussion threads, edit histories, or clickstreams (Link & Li, Reference Link, Li, Dixon and Thomas2015). Thus employing advanced analytical tools to detect hidden patterns of learner activity data has become particularly important and informative for researchers and educators. Our blog study provides a detailed example of how social network analysis was used to examine the dynamics of students’ online discussions over time. Social network analysis, when integrated into CALL research, can visually depict the interactions among all participants to identify each participant's role in the network and to present the evolution of network changes over time.
Research efforts to document and interpret learner behaviors from tracking data will continue to be important as access to multiple sources of learner data in online environments not only feeds back into enhancing pedagogy but also contributes to the development of language learning theory (Garrett, Reference Garrett1991; Chun, Reference Chun2013). For example, investigations of individual differences in CALL contexts, such as corpus-enhanced vocabulary learning, can be enhanced through clustering techniques and inform psycholinguistic and cognitive theories of second language acquisition. In addition, the contexts and patterns of learners’ online interaction, which are critical considerations in sociocultural and interactionist approaches to second language acquisition, can also be illuminated through techniques such as text mining and social network analysis. We would also like to note that the complex interplay among multiple cognitive and contextual factors in digital environments, learner interactions, and the mediating role of technology can be best understood in contextually rich and naturalistic environments (Warschauer, Reference Warschauer1997). As such, data-mining techniques can be a useful complement to qualitative investigations. Given the rapidly increasing opportunities and complexity of learner activities with digital media, data-mining techniques will serve an instrumental role for enhancing both language learning theory and practice.
Author ORCIDs
Mark Warschauer, 0000-0002-6817-4416; Hansol Lee, 0000-0002-6912-7128