increased exponentially with temperature; activation energies were estimated using Arrhenius plots for the two PET crystallization regimes.
I. INTRODUCTION
Poly(ethylene terephthalate) (PET) is a thermoplastic resin used in several industrial segments, including film, fiber, injected, and blown products. PET can be obtained in amorphous or semicrystalline states; in the later case, its properties depend strongly on the degree of crystallinity.
Engineering grades of PET for injection molding applications are highly crystalline and require fast crystallization at relatively low temperature to maintain high impact strength. However, film and bottle grades, used for transparent products, require amorphous or low crystalline morphology, stable at processing conditions. Thus, crystallinity and crystallization rates are very important considerations when selecting a resin grade and developing a process.
Structural unit of PET includes aliphatic and aromatic groups in the main chain. Aliphatic segments are flexible but the rigid aromatic groups increase the stiffness of the chain, hindering the crystallization process. A semicrystalline polymer like PET can develop a crystalline structure when cooled from the melt or heated from the glassy state, either under isothermal or under nonisothermal conditions. Two competing factors affect the crystallization behavior: cooling/heating rate and crystal nucleation and growth rates. The resulting microstructure has a significant effect on the ultimate properties of the product, such as elasticity, permeability, transparency, and stiffness.Reference Van Antwerpen and Van Krevelen1, Reference Verhoyen, Dupret and Legras2
Although more difficult to study than crystallization under isothermal conditions, the quantitative evaluation of nonisothermal crystallization is required to understand and model industrial processes, which are conducted under nonisothermal conditions.Reference Achilias, Papageorgiou and Karayannidis3–Reference Addonizio, Martuscelli and Silvestre9
Several studies of nonisothermal crystallization of PET are available in the literature. JabarinReference Jabarin10 reported the crystallization behavior of PET under nonisothermal conditions as a function of molar mass, polycondensation catalyst system, and polymerization conditions. He showed that it is possible to establish the minimum cooling rate required to produce PET without detectable crystallinity. Cooling requirements to produce noncrystalline PET depend on molecular mass and, more importantly, on the catalyst system used in the polycondensation. The absence of crystallinity is a necessary requirement to produce optically clear products. In a similar study, Fann et al.Reference Fann, Huang and Lee11 showed that different cooling modes can be used to optimize the conditions needed to keep crystallinity to a minimum during the production of PET bottles. The kinetic parameters for PET crystallization indicated that the competing process of nucleation and growth of PET spherulites during the cooling process were the controlling factors that determined the degree of crystallinity in the final PET products. Lu and HayReference Lu and Hay12 analyzed the effect of physical aging on cold crystallization rate of PET; they observed an increase of the cold crystallization rate with physical aging, attributed to an increase in the nucleation density. Sajkiewicz et al.Reference Sajkiewicz, Carpaneto and Wasiak13 studied nonisothermal crystallization of PET from the melt under dynamic conditions and used Ozawa model to analyze the crystallization kinetics.
However, few studies dealt with the nonisothermal cold crystallization kinetics of PET, a process of great practical and scientific importance. Nonisothermal cold crystallization studies can be useful to understand the relationship between processing, structure, and properties. The present work is concerned with the cold crystallization kinetics of PET under nonisothermal conditions. This follows a previous study involving the isothermal cold crystallization of PET.Reference Wellen and Rabello14
II. EXPERIMENTAL
A. Materials
The film-grade PET used in this work was supplied by Terphane (Brazil) as extruded “amorphous” clear film of 0.5-mm thickness, with intrinsic viscosity of 0.7 dL/g measured in o-chlorophenol.
B. Methods
Differential scanning calorimetry (DSC) is a versatile tool for thermal analysis of materials. A small sample of the material is heated or cooled at a programmed temperature variation rate, and the rate of energy absorbed (endothermic process) or liberated (exothermic process) by the material is monitored, along with the temperature, as a function of time. In this way, specific heats, latent heats of phase change, and many other physical or chemical reactions can be quantitatively identified. DSC is particularly suited for the thermal analysis of polymeric materials.Reference Wunderlich15, Reference Menard and Brostow16
DSC measurements were carried on a Shimadzu DSC-50 (Kyoto, Japan). The nonisothermal cold crystallization was studied by heating the samples from ambient temperature to 300 °C, at rates ranging from 2.5 to 40 °C/min. To avoid uneven thermal conduction through the samples, which may cause differential broadening and shifting of the peaks,Reference Hong, Chung and Hsu17 the same amount of polymer (8 ± 1 mg) was used in all tests. From the DSC thermograms, the thermal properties and the kinetic parameters were obtained, and this will be described throughout the text.
III. RESULTS AND DISCUSSION
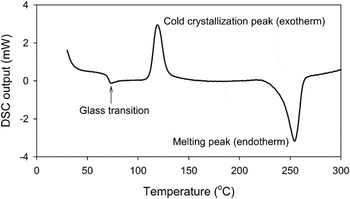
The DSC provides graphical/numerical output in the form of the rate of heat transfer (power) J to the sample as a function of either time (t) or sample temperature (T). When a polymer like PET is analyzed as a function of temperature, the first main thermal effect is the glass transition (Fig. 1), corresponding to a change from the glassy to the rubbery phase. As the temperature increases, the amorphous phase gains mobility and a cold crystallization phenomenon takes place, yielding an exotherm peak. Finally, an endotherm melting peak is observed.
Typical differential scanning calorimetry (DSC) plot for “amorphous” poly(ethylene terephthalate) (PET) sample heated a constant rate of 10 °C/min.

A. Transition temperatures and crystallinity
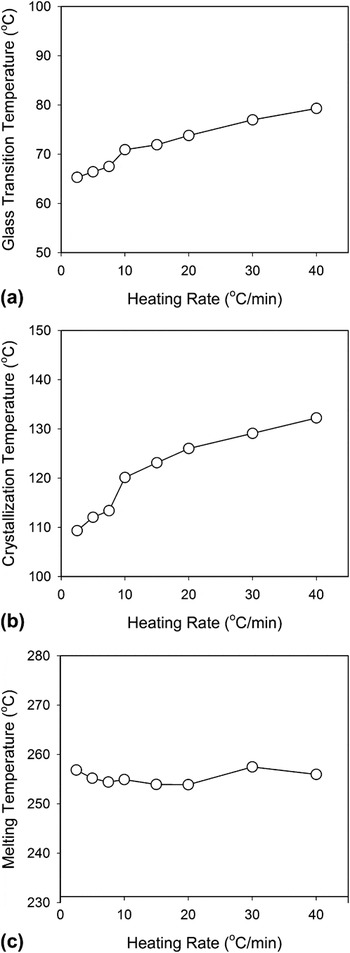
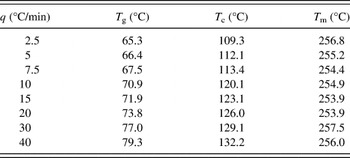
Glass transition temperature (T g), crystallization temperature (T c), and melting temperature (T m) were estimated for all heating rates (q) from the DSC output according to ASTM D-3418. The results are shown in Table I and Fig. 2.
Measured transition temperatures as functions of the heating rate: (a) glass transition, (b) cold crystallization, and (c) melting.

Transition temperatures of poly(ethylene terephthalate) (PET) at several heating rates.

The glass transition and cold crystallization temperatures increased with increasing heating rates: 14 and 23 °C, respectively, when heating rate changes from 2.5 to 40 °C/min. On the other hand, the melting temperature is only slightly affected by the heating rate: T m = 255 ± 1 °C over the same interval of heating rates.
Glass transition is a phenomenon of molecular relaxation. At a faster heating rate less time is available for relaxation, shifting the transition to higher temperatures. Similar behavior was observed in PET/SANReference Wellen and Rabello18 blends during cold crystallization with similar heating rates.
The increase in crystallization temperature with increasing heating rates suggests that, at higher rates, the motion and rearrangement of PET molecules are not fast enough to form the necessary nuclei for crystallization, compared to the lower temperatures attained at lower heating rates, where the specimen remains at each temperature for a longer time.Reference Kissinger19, Reference Cebe and Hong20 The opposite trend is observed for nonisothermal melt crystallization.Reference Apiwanthanakorn, Supaphol and Nithitanakul21, Reference Cebe22
The negligible variation of melting temperature with heating rate may be associated with the stability of the crystals, suggesting that the size and/or perfection of the crystals are the same for all conditions used. Comparable behavior was observed by Yoshihara et al.Reference Yoshihara, Shibaya and Ishihara23 and Jang et al.Reference Jang, Lee, Lee, Yoon, Chin and Choi24 for PET and PET/PS-co-MA (copolymer of styrene and maleic anhydride), respectively.
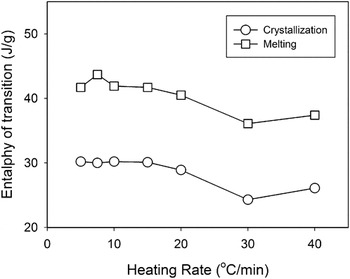
Latent heats (enthalpies) of crystallization (ΔH c) and melting (ΔH m) per unit mass were determined from the area under the peaks of the DSC output according to Eq. (1):

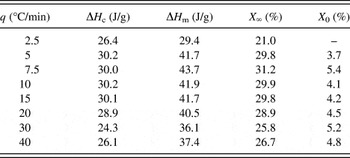
where J(T) is the DSC output in terms of temperature, T 1 and T 2 are the onset and end temperatures of the corresponding peak, and m S is the mass of the sample. The results are shown in Fig. 3 (see also Table II).
Enthalpies of transition of PET as functions of the heating rate.

Latent heats of crystallization and melting and crystallinity of PET at several heating rates.

Both latent heats show a moderate decrease with an increase in the heating rate, but the difference between the latent heat of melting and crystallization is remarkably constant, independent of the heating rate.
We assume that, above the glass transition temperature, a rubbery amorphous phase that includes a small, but not negligible, amount of crystalline polymer (initial crystallinity X 0) undergoes a process of cold crystallization at the crystallization temperature T c, whereas the crystallinity of the sample reaches the “ultimate” crystallinity of the solid material (X ∞). Then, as the temperature increases, the crystalline phase melts at the melting temperature T m, resulting in fully molten polymer (zero crystallinity).
From the experimentally determined heat of melting at each heating rate and the heat of melting of pure crystalline PET at the melting point, taken from the literature,Reference Metha, Gaur and Wunderlich25  , the ultimate crystallinity (X ∞) was computed for each heating rate:

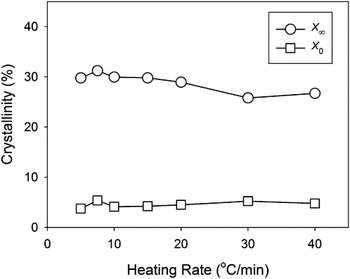
The ultimate crystallinity is fairly independent of the heating rate: X ∞ ≈ 29 ± 2% (Table II and Fig. 4).
Ultimate (X ∞) and initial (X 0) crystallinities of PET as functions of the heating rate.

The initial crystallinity of the samples (X 0) may be estimated from the equivalent of Eq. (2) for the cold crystallization process:

where  is the heat of melting of pure crystalline PET at the cold crystallization temperature, which is related to a reference value (at the crystalline melting point) throughReference Kong and Hay26

where  is the difference between the specific heat of the amorphous (
 ) and crystalline (
 ) phases; Eq. (4) assumes that the specific heat difference is independent of the temperature in the range between cold crystallization and melting (roughly, 120–255 °C), which is a reasonable approximation.
Specific heats of PET can be estimated using standard techniques and literature values. Assuming a linear relationship for the temperature dependence of the specific heat, we have

where β (a) and β (c) are temperature coefficients for the amorphous and crystalline phases, respectively, and T ref is a reference temperature. Using accepted literature values for T ref = 25 °C,Reference van Krevelen27 we obtain  and
 , computed at the average temperature between cold crystallization (T c = 120 ± 10 °C) and melting (T m = 256 °C), i.e., T ≈ 188 °C. Thus,
 .
On the basis of Eqs. (3) and (4), the initial crystallinity may be estimated as X 0 ≈ 4.6 ± 0.6% (Table II and Fig. 4).
B. Crystallization rates
The fractional crystallization (or relative crystallinity) during a cold crystallization process may be defined as

where X is the crystallinity developed at time t (or temperature T), estimated by integration of the DSC peak from the onset of the crystallization:

where J(T) is the DSC output in terms of temperature, T 1 and T 2 are the onset and end temperatures of the cold crystallization peak, and T is an intermediate temperature, T 1 ≤ T ≤ T 2. The fractional crystallization may be considered as a function of either time (t) or temperature (T) because the temperature is a linear function of time at constant heat rate:

where q = dT/dt is the heating rate and T 0 is the temperature at the starting point of the experiment.
Figure 5 shows the fractional crystallization as a function of both time and temperature for selected heating rates.
Fractional crystallization of PET as a function of (a) time and (b) temperature for several values of the heating rate.

As the temperature at the starting point (T 0) may not be the same for all runs, “absolute” times have little meaning. However, time intervals are meaningful. The crystallization rate (the rate of change of crystallinity with time) is given as

which is the slope in Fig. 5(a). The crystallization rate is related to the widely used rate of change of the fractional crystallization with temperature:

which is the slope in Fig. 5(b).
Crystallization curves show a sigmoid shape, characteristic of phase transformation processes in polymers, and are usually obtained for nonisothermal crystallization in polymers such as poly(methylene therphthalate) (PMT), PET, poly(propylene therphthalate) (PPT), and poly(butylene terephthalate) (PBT).Reference Dangseeyun, Supaphol and Nithitanakul28
Macroscopic crystallization in polymers starts at very low rates due to the slow, first nucleation step; crystallization rate increases during the main or bulk crystallization and then decreases as the material is depleted of crystallizable molecules. The fact that most polymers are not pure substances but mixtures of macromolecules of different masses enhances the gradual variation of crystallization rate with time. The results are the asymmetric endothermic peaks that, when integrated, give rise to the sigmoids observed.
The similarity in shape of the crystallization curves for different heating rates suggests that crystallization mechanisms are similar; variations observed during the cold crystallization may be attributed to differences in the nucleation and crystalline growth rates, but have the same morphologic crystallization mechanisms. A similar behavior was reported elsewhere for isothermal cold crystallization of PET.Reference Wellen and Rabello14
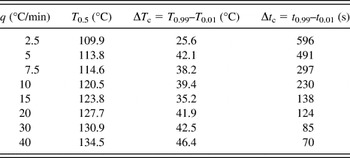
Table III shows the temperature at the midpoint (x = 0.5) and the temperature and time intervals for the cold crystallization, defined for the interval from 1 to 99% fractional crystallization; the 0 and 100% crystallization marks were avoided as they depend too much on the somewhat arbitrary choice of peak onset and end points.
Temperatures for 50% of crystallization and temperature and time intervals for nonisothermal cold crystallization of PET at several heating rates.

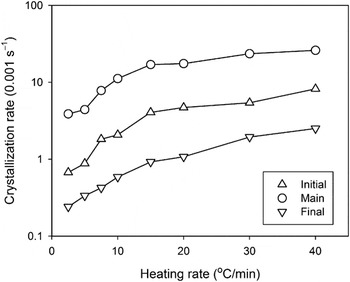
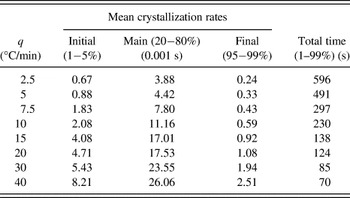
The rate of crystallization changes continuously with time or temperature (in fact, the rate of crystallization is proportional to the DSC output). It may be convenient, from a purely phenomenological point of view, to define mean rates of crystallization for the initial, main, and final stages of the cold crystallization process:

Time intervals for change in fractional crystallization were selected from 1 to 5% (initial), from 20 to 80% (main), and from 95 to 99% (final). Thus,

The results are shown in Table IV and represented graphically in Fig. 6. A significant increase in all crystallization rates was observed with an increase in heating rate. A 16-fold rise in heating rate resulted in 12.3, 6.7, and 10.5 times amplification of the initial, main, and final crystallization rates. Total time required for full crystallization decreased 8.5 times for same rise in heating rates.
Mean crystallization rates for the initial, main, and final crystallization stages for PET as functions of the heating rate.

Mean crystallization rates of PET at several heating rates.

C. Crystallization kinetics
Ozawa modelReference Cebe and Hong20 was used to elucidate the kinetics of the cold crystallization process. Ozawa assumes that nonisothermal crystallization is governed by the same mechanism proposed by Avrami for isothermal crystallization. A most interesting feature of Ozawa model is the possibility to compare the results of crystallization during continuous cooling/heating with those obtained by means of the Avrami equation under isothermal conditions. Ozawa model requires a constant rate of temperature change, q = dT/dt = constant, and has been successfully used to study nonisothermal crystallization of PETReference Sajkiewicz, Carpaneto and Wasiak13, Reference Fann, Huang and Lee11, Reference Ozawa29 and its blendsReference Ou and Lin30 and copolymers.Reference Zhang and Gu31
Ozawa kinetic model is given by

where x is the fractional crystallization, q is the heating rate, and K T and m are the Ozawa parameters, which are functions of the temperature and depend on nucleation and growth mechanisms.
From Eq. (13), we obtain

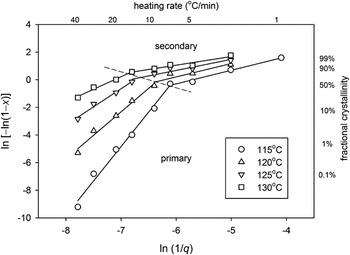
Thus, Ozawa model predicts a linear relationship between ln[−ln(1−x)] and ln(1/q) at constant temperature. Figure 7 shows such a plot taken from the integrated data (Fig. 5) and computed at four different temperatures.
Ozawa plot at several temperatures showing the different kinetics for the primary and secondary cold crystallization steps (1/q in s/°C).

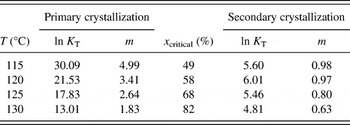
Two different kinetic regimes can be clearly identified, both following Ozawa’s model, but each with a different set of parameters: a primary crystallization process at low and moderate fractional crystallizations and a secondary crystallization process at higher fractional crystallizations. The critical fractional crystallization x critical at which the crystallization regime switches from one to other regimes increases with temperature. Table V shows the estimated Ozawa parameters for both crystallization regimes and the critical fractional crystallization.
Ozawa parameters for nonisothermal cold crystallization of PET.

Parameters computed with heating rates are expressed in °C/s.
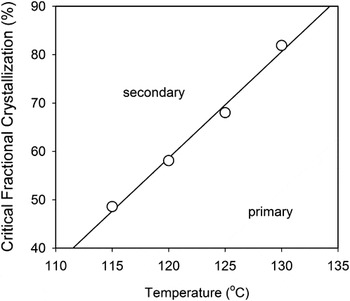
The critical fractional crystallization that separates the two regimes turns out to be a linear function of the temperature (Fig. 8).
Critical fractional crystallization of PET during nonisothermal cold crystallization as a function of temperature.

Ozawa’s exponent m decreases with increasing crystallization temperature, following the same trend observed elsewhere for isothermal crystallization.Reference Wellen and Rabello14 At lower temperatures, the lower growth rate favors the development of more complex morphologic structures. Ozawa’s constant K T also decreases with increasing temperatures, opposite to the trend observed for crystallization under isothermal conditions.Reference Wellen and Rabello14 Run et al.Reference Run, Yao and Wang32 applied Ozawa model in the kinetic study of nonisothermal melt crystallization of PMT and reported an increase in both Ozawa constants (m and K T) with an increase in the crystallization temperature. Similar trend were observed by Liu et al.Reference Liu, Mo and Zhang33 in a poly(aryl ether ketone). Usually, when nonisothermal crystallization from the melt is analyzed using Ozawa model, a decrease in K T is observed, while the opposite is expected for nonisothermal cold crystallization.
According to HieberReference Hieber34 and Sajkiewicz et al.,Reference Sajkiewicz, Carpaneto and Wasiak13 a combination of Ozawa’s parameters:

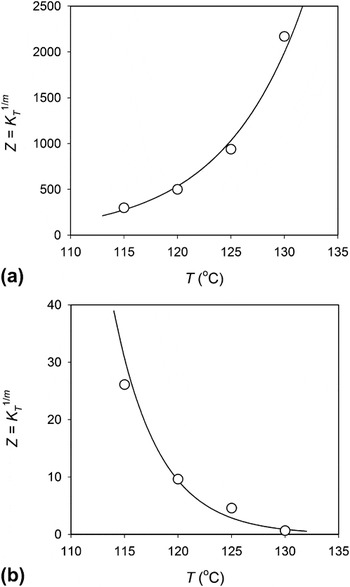
may be used to compare the crystallization kinetics on polymeric systems under different crystallization conditions; the Z rate constant, with units of (°C/min)m, makes possible the joint treatment of the results for isothermal and nonisothermal crystallization. Figure 9 shows the Z parameter as a function of crystallization temperature for both crystallization regimes observed in this work.
Z-plots for the (a) primary and (b) secondary crystallization regimes of PET. Lines are best-fit exponentials.

For the primary crystallization regime [Fig. 9(a)], Z increases with the crystallization temperature; a similar trend was verified for isothermal crystallization.Reference Wellen and Rabello14 An increase in Z with increasing crystallization temperature was reported for PET, PPT, and PBT.Reference Supaphol, Dangseeyun, Srimoaon and Nithitanakul35
For the secondary crystallization regime, a steeper increase in Z was observed with temperature [Fig. 9(b)]. As showed in Table V, an increase in the crystallization temperature contributes to higher x critical values. Thus, the secondary crystallization takes place in regions with larger impingement, which contributes to a decrease in the value of Z for this regime, at low crystallization temperatures (T c < 120 °C). At higher crystallization temperatures, the thermal effects seem to overcome spatial limitations, leading to higher values of the Z parameter for the secondary crystallization than for the primary regime.Reference Yang, Pan, Dong and Inoue36
Figure 9 shows that the kinetic parameter Z depends exponentially on the crystallization temperature for both crystallization regimes, suggesting thermally activated processes, which may be approximately described by Arrhenius type expressionsReference Cebe22, Reference Liu, Mo and Zhang33:

or

where K 0 is a temperature-independent pre-exponential factor, m is Ozawa’s exponent, T c is the cold crystallization temperature, ΔE c is the activation energy for the crystallization process, and R = 8.315 J/mol·K is the ideal gas constant.
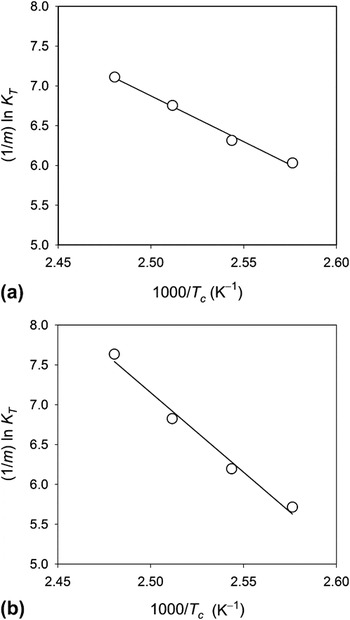
The activation energy ΔE c can be estimated from the slope of the plots of (1/m) lnK T versus 1/T c, as shown in Fig. 10. Values of 96 and 166 kJ/mol were found for the primary and secondary crystallization regimes of PET, respectively. These results are consistent with the data shown in Table V, where a decrease in Ozawa’s K T constant is observed for secondary crystallization, which may indicate that the secondary crystallization is occurring in zones with higher energy consumption.
Arrhenius plots for the (a) primary and (b) secondary crystallization regimes of PET.

We defer a detailed discussion of the secondary crystallization process and a possible pre-primary kinetic regime (suggested by Fig. 7, but we cannot confirm that at this point due to the resolution of the data at very low fractional crystallization) for a forthcoming paper.
IV. CONCLUSIONS
The nonisothermal cold crystallization of PET was analyzed by DSC, and the kinetic parameters were obtained using Ozawa model. Major conclusions are as follows:
(1) The glass transition and cold crystallization temperatures show a significant increase with the heating rate, whereas the melting temperature is virtually independent of the heating rate.
(2) The latent heats of crystallization and melting show a moderate decrease with the heating rate, while the difference between them is approximately constant, independent of the heating rate.
(3) The rate of crystallization rate increases substantially with an increase in the heating rate.
(4) Two different kinetic regimes were identified: a primary crystallization process at low and moderate fractional crystallizations and a secondary crystallization process at higher fractional crystallizations.
(5) Ozawa parameters (both the pre-exponential and the exponential factors) decreased with increasing crystallization temperature for both crystallization regimes.
(6) The combined kinetic parameter Z of Hieber and Sajkiewicz increased exponentially with temperature for both crystallization regimes; the activation energy was higher for the secondary crystallization regime than for the first.
ACKNOWLEDGMENTS
The authors thank Terphane (Brazil) for providing the polymer used in this work and gratefully acknowledge Conselho Nacional de Desenvolvimento Científico e Tecnológico (CNPq) and Fundação de Amparo à Ciência e Tecnologia do Estado de Pernambuco (FACEPE) (Brazil) for the financial support.