Despite infection control measures, transmission of severe acute respiratory coronavirus virus 2 (SARS-CoV-2) infection has been observed in the hospital and other healthcare settings. In a recent study of SARS-CoV-2–infected and –uninfected patients inadvertently roomed together, 39% of exposed, previously uninfected, patients developed COVID-19. Reference Karan, Klompas and Tucker1 Risk of SARS-CoV-2 transmission was associated with source patients who had a low cycle threshold (Ct), that is, a high viral load, in their diagnostic testing, and 91.7% of those exposed to such source patients developed infection. Reference Karan, Klompas and Tucker1
SARS-CoV-2 transmission can be mediated by droplets, aerosols, or fomites. Prior studies have demonstrated that SARS-CoV-2 extensively contaminates surfaces in the healthcare environment. Reference Morawska, Allen and Bahnfleth2–Reference Ong, Tan and Chia8 However, the spatial extent of contamination and how contamination changes during the course of hospitalization remain less well understood. Reference Mody, Akinboyo and Babcock9
We have previously applied a systematic sampling and spatial modeling strategy to define how multidrug-resistant organisms cluster in the hospital environment. Reference Kelly, Bekele and Loughrey10 Here, we extended the methods we have developed to understand how SARS-CoV-2 contamination is distributed spatially, and how it changes over time.
Materials and methods
Study design, setting, and population
We performed a prospective cohort study at the Hospital of the University of Pennsylvania (HUP), an academic medical center in Philadelphia, Pennsylvania (IRB protocol no. 843273). Over the course of the study, patients with COVID-19 were housed on multiple hospital units according to bed availability. All rooms underwent daily cleaning, according to hospital protocol (see Supplementary Methods online). Environmental services (EVS) staff used disposable disinfectant wipes (quaternary ammonium disinfectant) to clean high-touch surfaces, limiting use to a single surface. Floors were cleaned using a microfiber mop and sodium dichloroisocyanurate, a chlorine-based disinfectant. Patient rooms were eligible for inclusion in the study if the occupant had a positive test for SARS-CoV-2 within the prior 7 days and was admitted to a new patient room with COVID-19 isolation precautions.
Causal model
We hypothesized that SARS-CoV-2 contamination of the healthcare environment would decay with physical distance from patient and with time from COVID-19 diagnosis. We also hypothesized that high-touch objects would be more frequently contaminated with SARS-CoV-2 RNA than low-touch objects, and that increased COVID-19 disease severity would be associated with greater environmental contamination.
Specimen collection and SARS-CoV-2 RT-PCR
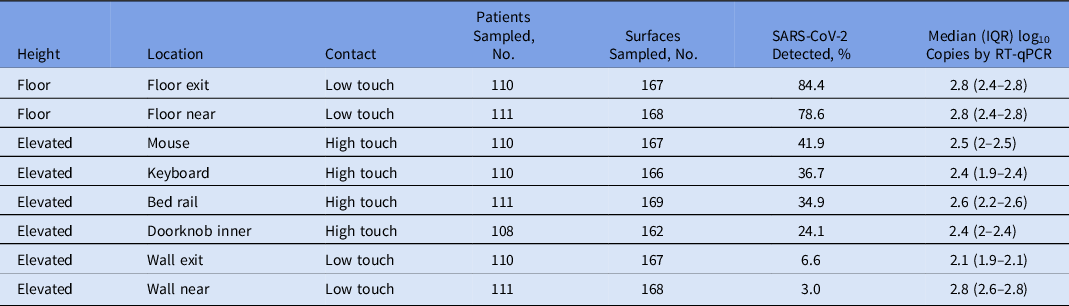
COVID-19 patient rooms were swabbed longitudinally until day 28 or patient discharge from the hospital, with sampling targeted to hospital days 1, 2, 7, 14, 21, and 28. Sampling was performed each morning prior to daily cleaning. Longitudinal sampling continued if the patient was removed from COVID-19 isolation precautions or if the patient transferred to a new hospital room. Multiple surfaces were swabbed within each patient room using a flocked nylon swab (Copan Diagnostics, Murrieta, CA) within a sterile 20 cm2 template to ensure consistent sampling. High-touch surfaces (Table 1) were selected using structured observations prior to study start. Swabs were immediately placed into buffered AVL (lysis buffer) and frozen prior to further processing. Specimens then underwent RNA extraction (QIAmp Viral RNA Mini Kit, Qiagen, Germantown, MD) and quantitative reverse transcription polymerase chain reaction (RT-qPCR) (Thermo Quantstudio, Thermo Fisher, Waltham, MA) with primers and probe targeting the SARS-CoV-2 N1 region (CDC RT-qPCR probe assay, Integrated DNA Technologies, Coralville, IA) in triplicate.
Hospital Environment Features Sampled and Proportion With Detectable SARS-CoV-2 RNA

Note. IQR, interquartile range. For each environmental surface type, whether the surface was considered high-touch or low-touch, the proportion of surfaces positive for SARS-CoV-2 RNA by RT-qPCR, and the median (IQR) SARS-CoV-2 copy numbers measured are reported. The “exit” descriptor indicates sites within the patient room near the exit or threshold; the “near” descriptor indicates sites within the patient room near the patient bed.
Distance data collection
Distance from the environmental sampling site to the patient’s head of bed was recorded using a laser measuring device (Bosch GLM 20, Bosch, Gerlingen, Germany). Templates were affixed to each surface, and the linear distance from the patient’s head of bed to the sample site was measured.
Definition of exposures and outcomes
The primary outcome of interest, detection of SARS-CoV-2 by RT-qPCR assay, was determined by detection of any quantifiable RNA on any of 3 technical replicates. Replicates were reviewed for inconsistencies and PCR was repeated in the event of disparate results. The primary exposures of interest were (1) distance from the head of patient’s bed, measured as above; (2) time from COVID-19 diagnosis and from the start of the local COVID-19 case wave; and (3) COVID-19 clinical severity. We categorized COVID-19 severity by the highest level of oxygen support required during the patients’ admission: (1) no oxygen support required (mild disease); (2) only nasal or facemask oxygen support required (moderate disease); and (3) high-flow nasal cannula, continuous or bilevel positive airway pressure, or mechanical ventilation (severe disease).
Statistical analysis
Data were organized using R statistical software version 3.6.1, 11 and plots were generated using the “ggplot2” package. Reference Wickham12 We examined how (1) distance from the patient and (2) time since COVID-19 diagnosis relate to the probability of SARS-CoV-2 detection using a binomial model with a logit link. We also evaluated mixed-effects model incorporating a random effect for patients to account for clustering of longitudinal data and to evaluate differences between patients. Models were fit using Stan Hamiltonian Monte Carlo (HMC) version 2.21 software using the “brms” package with default, weakly informative priors. Reference Carpenter, Gelman and Hoffman13,Reference Bürkner14 Prior predictive modeling was performed, and models were fit with 4 chains of 1,000 iterations confirmed with HMC diagnostics (no divergent iterations, Rhat statistic <1.1 for all parameters, and E-BFMI > 0.2). Reference McElreath15–Reference Gelman, Vehtari and Simpson17 We examined parameter distributions at 50%, 80%, and 95% posterior credible intervals to understand the relationship between exposure and outcome variables.
We anticipated that the enrollment of a minimum of 100 study participants would permit detection of a minimum of a 10% decrease probability of surface detection between distance groups with type 1 error <.05. Data, analysis scripts, and model code are available at https://github.com/bjklab.
Results
Characteristics of patients hospitalized for COVID-19 during the second (fall 2020) wave
We collected 1,334 specimens from 111 unique patient–room pairs, comprising 103 unique patients (ie, 7 patients were transferred at least once during the observation period). The median number of sampling events from each patient–room pair was 1.5 (SD, 0.74). Table 1 summarizes the environmental surfaces sampled, whether they were high touch or low touch, the proportion of each specimen type from which SARS-CoV-2 RNA was detected by RT-qPCR, and the SARS-CoV-2 copy numbers measured. We did not observe significant differences in copy numbers across the surface types, but the proportion with detectable SARS-CoV-2 did vary widely.
SARS-CoV-2 RNA environmental contamination varies with surface type but not distance from the patient
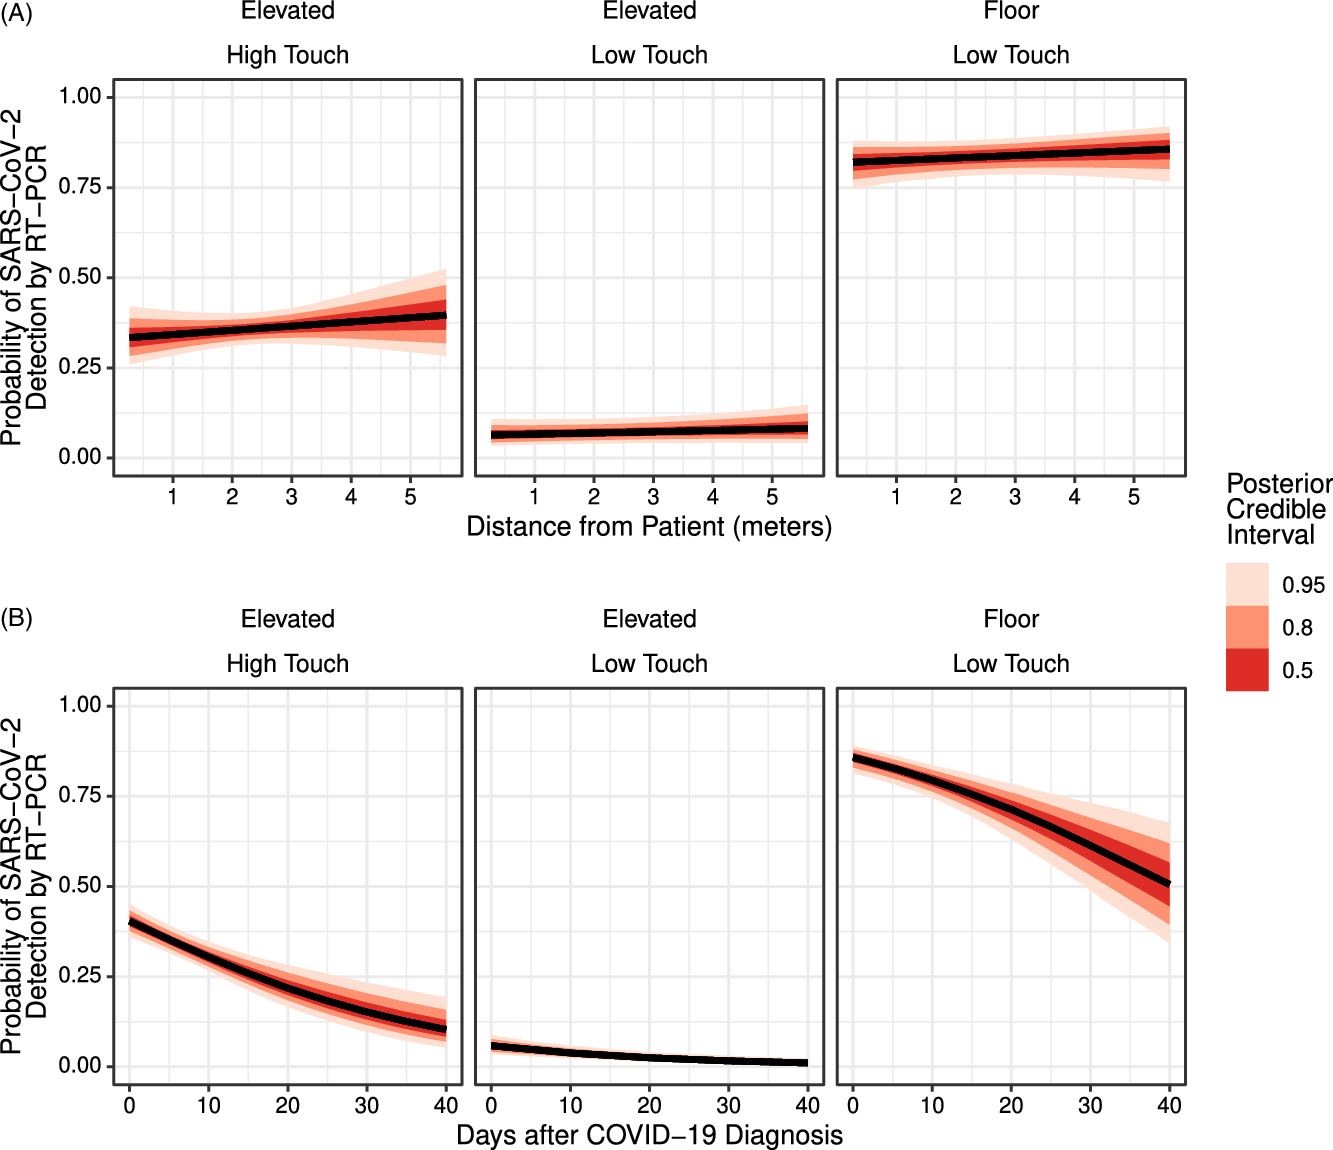
We evaluated the relationship between the distance from the patient’s head of the bed and the probability of detecting SARS-CoV-2 on environmental surfaces. There was no significant relationship between distance and the probability of SARS-CoV-2 detection, in contrast to prior studies of multidrug-resistant bacterial organisms, Reference Kelly, Bekele and Loughrey10 but the surface type was significantly associated with the probability of detection. Floor surfaces had an OR of 67.8 (95% credible interval [CrI], 36.3–131) of SARS-CoV-2 detection, relative to elevated surfaces. High-touch elevated surfaces (mouse, keyboard, bed rail, and doorknob) had an odds ratio of 7.39 (95% CrI, 4.31–13.1) of SARS-CoV-2 detection, relative to low-touch elevated surfaces (walls). Figure 1A depicts the results of a multivariable model relating distance from patient, surface location, and whether the surface was high-touch to the probability of SARS-CoV-2 detection.
Spatial and temporal effects on SARS-CoV-2 RNA contamination in the healthcare environment. (A) Distance from the head of the patient’s bed is shown on the horizontal axis. The vertical axis depicts the probability of SARS-CoV-2 detection by RT-qPCR according to a logistic regression model incorporating the surface elevation and touch. (B) Days from diagnosis with COVID-19 are shown on the horizontal axis. The vertical axis depicts the probability of SARS-CoV-2 detection by RT-qPCR according to a logistic regression model incorporating the surface elevation and touch. For both plots, the black line shows the best estimate, and shading indicates 50%, 80%, and 95% posterior credible intervals.

SARS-CoV-2 RNA environmental contamination decays during prolonged hospitalization
We evaluated the effect of time from COVID-19 diagnosis on the detection of SARS-CoV-2 RNA in the hospital environment via a multivariable logistic regression model relating time from COVID-19 diagnosis, surface location, and whether the surface was high touch to the probability of SARS-CoV-2 detection. The probability of detection decreased as time from COVID-19 diagnosis increased, with an OR of 0.957 (95% CrI, 0.938–0.976) per day since COVID-19 diagnosis. The most prominent effects were observed on high-touch elevated surfaces and floor surfaces (Fig. 1B).
SARS-CoV-2 contamination of the floor increases with pandemic wave duration
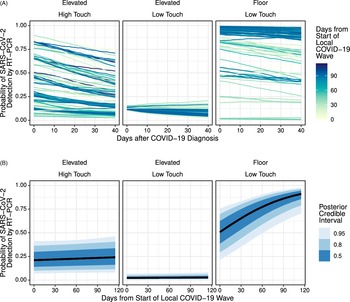
To understand how patients differed in the effect of time from COVID-19 diagnosis on SARS-CoV-2 contamination of the hospital environment, we refit the model with the addition of random intercepts and slopes to account for patient-level differences. Figure 2A depicts the best estimate of the effect of time from COVID-19 diagnosis on the contamination in each patient’s hospital room. In the figure, the lines representing each patient is colored by when they were enrolled during the course of the local, second-wave COVID-19 case surge. The contamination of high-touch elevated surfaces did not appear to relate to time from the start of the local case surge. However, contamination of floor surfaces appeared to be greater among patients enrolled later in the course of the local case surge. To investigate this further, we added an interaction term to the model and found that each day since the start of the start of the local second wave increased the contamination of floor surfaces with an OR of 1.02 (95% CrI, 1.01–1.03) (Fig. 2B).
Variation in temporal effects and influence of pandemic duration. (A) Days from diagnosis with COVID-19 are shown on the horizontal axis. The vertical axis depicts the probability of SARS-CoV-2 detection by RT-qPCR according to a logistic regression model incorporating the site elevation and touch, with random patient-level effects. Each line represents the best estimate for a single patients; lines are colored according to the number of days from the start of the local COVID-19 second-case wave. (B) Days from the local start of the second COVID-19 wave are shown on the horizontal axis. The vertical axis depicts the probability of SARS-CoV-2 detection by RT-qPCR according to a logistic regression model incorporating the days from COVID-19 diagnosis, surface elevation, and touch, with an interaction term between the days from the local start of the second COVID-19 wave and the surface type. The black line shows the best estimate, and shading indicates 50%, 80%, and 95% posterior credible intervals.

SARS-CoV-2 contamination of increases with COVID-19 disease severity
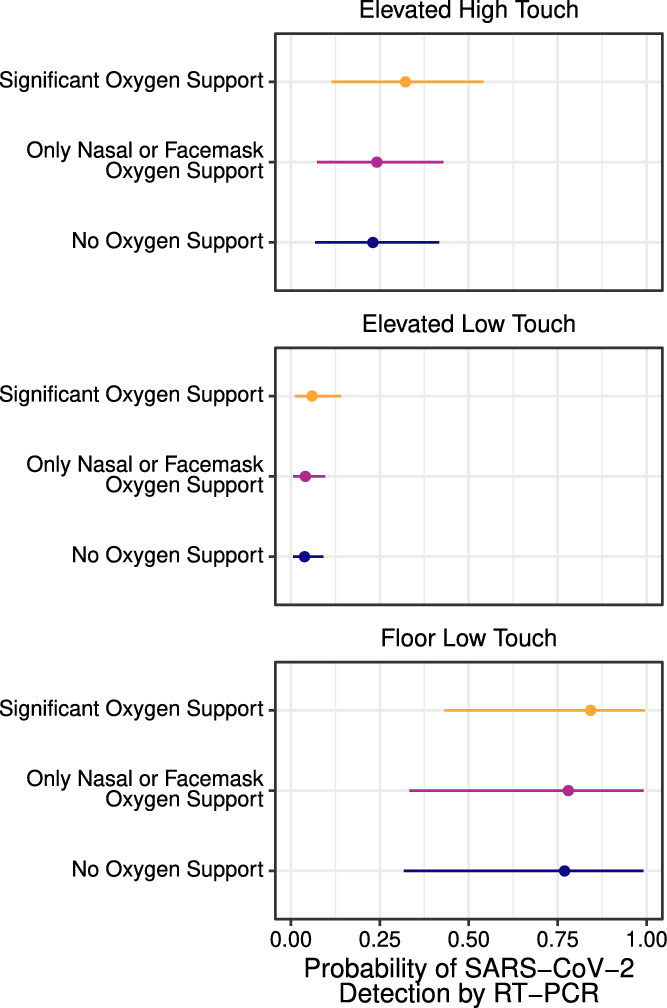
To understand how COVID-19 disease severity could impact environmental contamination with SARS-CoV-2 RNA, we categorized patients based on their required oxygen support: 36 patients (35%) who required no oxygen support, 47 patients (45.6%) who required only nasal or facemask oxygen support, and 20 patients (19.4%) who required significant oxygen support (ie, high-flow, continuous, or bilevel positive airway pressure or mechanical ventilation). Adjusting for the site, time from COVID-19 diagnosis, and time from start of the local COVID-19 wave, the use of significant oxygen support was associated with increased environmental SARS-CoV-2 RNA contamination, with an OR of 1.6 (95% CrI, 1.03–2.53) relative to the no-oxygen-support reference group. Figure 3 shows the predicted probabilities of SARS-CoV-2 environmental contamination as it relates to COVID-19 severity across all measured surfaces, adjusted for time from COVID-19 diagnosis and time from the start of the local COVID-19 wave.
Impact of COVID-19 disease severity on environmental contamination. To evaluate the effect of COVID-19 disease severity on environmental contamination, we compared the probability of SARS-CoV-2 RNA detection by RT-PCR (horizontal axis) across patients with 3 levels of necessary oxygen support (vertical axis) at each sampling site. The point shows the best estimate, and the segment indicates the 95% posterior credible interval, with adjustment for time from COVID-19 diagnosis and time from the start of the local COVID-19 wave.

Discussion
We sought to define the impact of time and distance on SARS-CoV-2 contamination of the healthcare environment through longitudinal sampling of surfaces within COVID-19 patient rooms. We found that distance from the patient’s bed did not inform the probability of detection of SARS-CoV-2 RNA, but the category of surface (elevated or floor, high-touch or low-touch) did. The highest probability of contamination was found with floors, followed by elevated high-touch surfaces. We also found a decrease in probability of detection among both high- and low-touch surfaces with time from COVID-19 diagnosis, consistent with previous reports. Reference Chia, Coleman and Tan18 Although the overall probability of SARS-CoV-2 RNA detection decreased as time from diagnosis increased, the probability of SARS-CoV-2 RNA detection on floors increased with time from the onset of the local COVID-19 case wave. The unique behavior of floor surfaces raises the possibility of accumulation as SARS-CoV-2 RNA carried on the feet of healthcare personnel (HCP) or other mobile medical equipment increases with the COVID-19 patient census. This possibility is supported by other research in which floor contamination was discovered to spread beyond clinical areas. Reference Guo, Wang and Zhang19 Alternatively, it is possible that the quality of cleaning declined as the study progressed or that viral RNA persists on surfaces even after terminal cleaning, leading to an accumulation effect.
Increased clinical severity of COVID-19, measured by oxygen requirement, was associated with increased contamination of the healthcare environment. Specifically, those patients who required high-flow nasal cannula, continuous or bilevel positive airway pressure, or mechanical ventilation, had increased odds of detecting surface SARS-CoV-2 RNA, compared to those with no oxygen requirement. This finding may be the result of either the higher viral burden of occupying patients or the role of increased respiratory droplet and aerosol production associated with respiratory support. In a prior study, disease severity was not correlated with cycle threshold from anatomic specimens, Reference Abdulrahman, Mallah and Alqahtani20 potentially supporting the contribution of respiratory care in surface contamination. In either case, our findings support CDC guidance for prolonged isolation in critically ill patients. 21
Our study design and hypotheses were informed by our prior work with bacterial deposition within patient rooms in which some taxa showed decreased probability of detection as distance changed within patient room. Reference Kelly, Bekele and Loughrey10 Contrary to our findings with multidrug-resistant bacteria, SARS-CoV-2 detection did not vary significantly within any surface group as distance from the patient increased. The difference between the findings from our two studies is most likely related to two factors: (1) the relatively small size of patient rooms and (2) the physical spread of SARS-CoV-2 RNA through touch. We observed large differences in the probability of detecting surface contamination by surface type. Floors had high probability of contamination, which did not vary throughout the room. This finding is likely related to both the role of patient and HCP foot traffic in addition to the physical action of mopping which may spread body fluids containing viral RNA within the patient’s room. Our findings match previous descriptions of high probability of floor contamination relative to other surfaces, but the role of mops in the spread of viral RNA has not been previously described. Reference Chia, Coleman and Tan18,Reference Rutala, Gergen and Weber22 In contrast to floors, walls had significantly lower probability of contamination. This finding may be due to the decreased settling of respiratory droplets or aerosols on vertical surfaces, or the decreased role of touch or secondary contamination through cleaning.
Our study had several limitations. First, we used RT-qPCR for the detection of SARS-CoV-2 RNA and did not use viral culture to determine the viability from surfaces. Few prior studies that have been successful in recovering infectious virus from patient rooms. Reference Lednicky, Lauzard and Fan23,Reference Santarpia, Rivera and Herrera24 Second, we did not measure differences in cleaning methods across different study units. However, cleaning practices did not undergo systematic changes during the study period, and sampling was performed routinely prior to daily cleaning. Third, we were not able to differentiate contamination of floors that was attributable to healthcare personnel foot traffic as opposed to the settling of respiratory particles or body fluids attributable to the index patient. We did not observe large differences in the abundance of SARS-CoV-2 RNA across surfaces where SARS-CoV-2 RNA was detected. Therefore, our analysis focused exclusively on factors that are associated with the presence or absence of SARS-CoV-2, rather than SARS-CoV-2 abundance on positive surfaces. Finally, we were not able to measure SARS-CoV-2 viral loads directly from human patients, which would have permitted us to better explore the contribution of differences in shedding between patients.
In conclusion, SARS-CoV-2 RNA surface deposition did not vary with distance within patient rooms. However, surface type, severity of illness, and time from beginning of the local COVID-19 wave predicted detection of surface contamination. Future studies should focus on how the observed surface contamination contributes to risk of infection among patients and HCP, and on how cleaning strategies can target surfaces found to be at high risk of contamination.
Supplementary Material
To view supplementary material for this article, please visit https://doi.org/10.1017/ice.2021.530
Acknowledgments
We thank the Bushman Laboratory at the University of Pennsylvania for quantitative PCR methods support.
Financial support
This research and authors B.J.K., M.J.Z., and E.L. are supported in part by a grant from the CDC (Cooperative Agreement FOA no. CK16-004 “Epicenters for the Prevention of Healthcare Associated Infections”). B.J.K. is supported by the National Institute for Allergy and Infectious Diseases (grant nos. K23 AI121485 and L30 AI120149). M.J.Z. is supported by the National Institute for Allergy and Infectious Diseases (grant no. K23 AI143925).
Conflicts of interest
All authors report no conflicts of interest relevant to this article.