To facilitate needs-based humanitarian assistance following a sudden-onset disaster (SOD), quick access to basic information about the effect of the disaster is crucial. Information on the predisaster context, the type and intensity of the SOD, the size and location of the affected population, and the most vital current needs is essential to timely humanitarian relief.Reference Malilay1-Reference von Schreeb3 In addition, such information is desired by donors to ensure that resources are allocated according to needs.4
There is currently no widely accepted framework for how to collect such information, no established concept regarding what type of basic indicators to collect, and no standard procedure to systematically use information on needs.Reference Mock and Garfield5 There is, however, no paucity of concepts, frameworks, or procedures, including the best-known projects – Sphere6 and Standardized Monitoring Assessment of Relief and Transition.7 Following an SOD, information about the event is rapidly spread throughout the globe through the media and the Internet. To date, little research has examined the extent to which this kind of information actually captures the extent of the disaster.Reference Garfield and Skinner8, Reference Garfield9
For this study, we reviewed the information available at different points during the first 7 days following an SOD, which agency provided this information, and the extent to which the information provided was consistent with later and more definite information.
Methods
Reliefweb is an Internet portal, hosted by the Organization for Coordination of Humanitarian Assistance that is frequently used by humanitarian agencies as a data source following disasters and also to publish information about their activities. On this portal, updates on disasters are available through reports from the media, nongovernmental organizations (NGOs), governments, and the United Nations (UN). Reliefweb receives an average of more than 1 million “hits” per day. There are no formal selection criteria for what may be posted on Reliefweb, but there is an internal quality control process; submissions are manually checked before they are posted. Reports are “passively” sent to Relief-web, while their staff also actively search for reports and information to post.
From Reliefweb, we selected the 2005 South Asian earthquake (also known as the Kashmir earthquake) that struck north of the Pakistani capital, Islamabad, at 8:50 Pakistan Standard Time, on October 8, 2005. We included all postings from the day of the earthquake and for the next 7 days.
A form for registration was developed with input from 3 researchers with experience in disaster relief work. The form included a checklist with indicators designed to capture the intensity and severity of the disaster, including data on the predisaster situation and the direct impact of the earthquake (see Box). Two persons read each posted report, 1 form was completed, and indicators were extracted. If their extracts differed, a third referee examined and modified the extract form. The entries were made directly in EpiData, version 3.1 (EpiData Software, Odense, Denmark), and exported to EpiData analysis, version 1.1 (EpiData Software) for cross-tabulation. The data obtained from Reliefweb were compared with official data provided by the EM-DAT database hosted by the Centre for Research on the Epidemiology of Disasters.10 EM-DAT contains worldwide data on the occurrence and impact of natural disasters from 1900 to the present. The source for these data are Pakistani official reports, but we have not secured a primary report from the government of Pakistan. We compared the results of the study with the EM-DAT figures.
Variables for Review of Reliefweb Reports
About the Publication
Date of publication on Reliefweb
Date of original publication
Language of posted article
Type of publishing organization
Full report attached
Map included
Was publishing agency involved in providing relief?
Contextual Situation
Political context referred to
Geographical situation context referred to
Cultural/religious context referred to
Socioeconomic context referred to
Affected area specified
Lowest administrative level mentioned in report
Victim Information
No. of inhabitants in affected area
No. of “affected’” in area
No. of homeless
No. of IDPs (Internally Displaced Persons)
No. of dead
No. of severely injured/wounded
No. of injured/wounded
No. of houses affected
No. of houses “damaged”
No. of houses “destroyed”
Any reference to source of demographic data
Type of organization stated as source
Type of method/tool used for own data generation
Needs
Type of needs expressed
Expressed population needs
Expressed organization needs
Any reference to source of needs of population
Type of organization stated as source
Type of method/tool used for data generation
Contact Details
Contact details attached
Unique key number for publication
Results
Information Flow
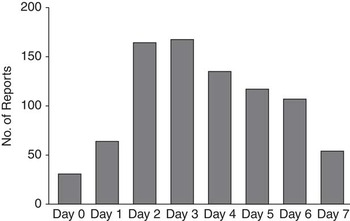
In total, 820 reports were identified on Reliefweb in the 7 days after the earthquake. All reports were read and data extracted. Thirty-one of the reports (3.8%) were posted on the same day as the earthquake, followed by a sharp increase the following 2 days. On the second day, 64 reports (7.8%) were uploaded. On average, 105 reports were posted to Reliefweb per day (Figure 1). Approximately two thirds of these (66%) were posted on Reliefweb on the same day they were published. Most of the remaining reports were posted on the Web site within 48 hours of the date of original publication. A total of 95% of all reports were published in English, 3% were in French, and 2% were in Spanish.
Number of Reports Published on Reliefweb per Day

More reports came from NGOs (35%) than from any other source. Next in frequency were reports from news organizations (32%), government sources (9%), the UN and other international sources (13%), and institutes and academic institutions (0.1%).
The NGOs contributed a higher percentage of the earliest reports, including 14 of the 31 (45%) on the first day. News organizations became more frequent sources of reports on days 2 through 5. Government and UN sources posted more reports toward the end of the week. In 808 of the 820 reports, the organization responsible for the report was also involved in providing relief.
Pakistan is administratively divided into 4 provinces: Punjab, Sindh, Northwest Frontier Province, and Baluchistan. These provinces are further subdivided into divisions, districts, and subdistricts known as tehsils. Reports were stratified in the study form by the lowest administrative level referred to in the reports. A total of 42% of reports addressed only national level information, while 32% specified information at the provincial level. Fewer than 12% of all reports discussed the earthquake at the more local division, district, or tehsil levels. Nine reports did not specify the administrative level to which they referred.
Few reports estimated the number of people living in the affected area at the time of the earthquake. Among the 13 reports that did, values ranged from 5000 to 4.5 million, with a mean of 2.4 million people (standard deviation [SD], 1.7 million). The most commonly reported value was 4 million, cited in 4 of the 13 reports. Of the 820 reports, 26.1% provided information on the source of the data provided. Among these 214 reports providing source information, the Pakistani government was listed as the source a third of the time, followed by the UN and other sources. Each of these reports seriously underestimated the population living in the affected area, which was 10.4 million according to the government of Pakistan.10
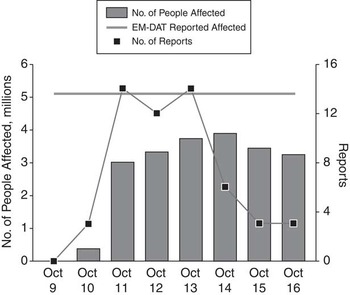
Only 7% of reports provided estimates on the number of people affected by the earthquake. None of the reports specified the definition of affected. The total number reported as affected ranged from 50 000 to 5 million. The mean reported value was 3.24 million people (SD, 1.53 million). The estimated population affected rose through day 4 and then declined (Figure 2).
Reported Number of Affected People per Day

The NGOs, in general, reported lower values for the affected population than other organizations. Of the 55 reports with estimates of the number of people affected, 30 used the same figure of 4 million. In fact, the highest estimates are those closest to the EM-DAT report of 5.1 million affected. The EM-DAT defines affected as “People requiring immediate assistance during a period of emergency, i.e. requiring basic survival needs such as food, water, shelter, sanitation and immediate medical assistance.”
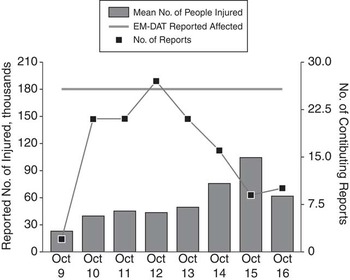
Of the reports, 127 included estimates on the number of people injured. Values ranged from 5 000 to 500 000. The mean number of injured reported was 53 600. These estimates peaked on day 6 and then declined (Figure 3). None of the reports came close to the EM-DAT reported figures of 128 000 injured. The EM-DAT defines injured as “people suffering from physical injuries, trauma or an illness requiring medical treatment as a direct result of a disaster.”
Reported Number of Injured per Day

Information on the number of people made homeless by the earthquake was provided in 115 reports. Values ranged from 5000 to 14 million. The mean reported value was 2.53 million homeless. A third of all reports, including almost all of the press reports, cited a common figure of 2.5 million. These were significantly lower than the EM-DAT figure of 5 million people who were reportedly made homeless.
The NGOs and news organizations reported higher numbers of homeless people (2.7 million) than did the UN (1.9 million) and government sources (1.6 million).
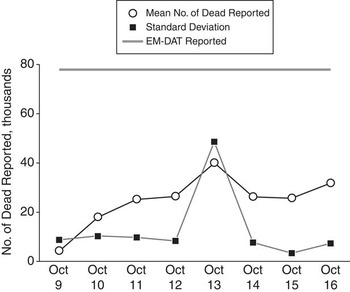
Of all reports, 43% provided an estimate of the number of deaths. These varied from 50 to 300 000. The mean value for reported deaths during that week was 27 400 (SD, 23 700). Among these 353 reports, there were only 41 different figures provided for the number of dead. There thus was a strong tendency to repeat figures from previous reports. The most common figures appeared as often as 20 times.
The number of reported deaths peaked on day 4 at 40 000. The number then decreased on days 5 and 6 and rose again on day 7. All numbers were lower than the number in the EM-DAT database, 73 000 deaths in total (Figure 4).
Number of Dead Reported per Day

News organizations reported the highest average numbers of deaths at 31 000. This number contrasted with NGOs that reported an average of 26 000 deaths, while government sources and the UN and international organizations reported an average of 22 000 deaths.
Comment
We were positively impressed by the large number of reports presented on Reliefweb within hours or days of the earthquake. We were dismayed, however, by how little guidance most of these reports provided. Some of this inadequacy, of course, results from logistical difficulties in reaching a large rural area that includes many small communities with poor physical access. It was not surprising that it took close to 2 days for reports on the number of houses lost, deaths, and injuries to appear. Yet it is noteworthy that even after 7 days, a consensus of reports provided death toll figures that severely underestimated the actual number of dead.
Of more concern is the relative dearth of substantive, original information in many reports. In very few reports were any sources for the information provided. Some simple standardized reporting of the types and level of information provided would greatly facilitate interpretation. Even a hint of a source, from estimates from a flyover, to counts based on average tehsil size, was seldom provided. This lack of information makes assessing the accuracy of the information provided quite difficult, obfuscating the challenge of collecting information and the context in which it is collected. There are obvious political reasons for inflating or deflating the magnitude of a disaster. When numerical indicators are similar across reports and reporting organizations, readers may believe that the numbers represent a consensus among sources. For most of the indicators, in fact, close to half of the numbers provided were numerically identical from one source to another. The frequent appearance of a single number in fact suggests not consensus but the repetition from one nonsourced site to another. Numbers may be recycled from the media back to reports written by aid groups.
Most reports were by published by agencies involved in relief activities rather than specialized in assessments. They could provide important original information by reporting on the needs and trends that they observed directly at their service site and the context of the lives of the people they encountered. Most, however, did little of this. A template for comparative reporting might facilitate better use of their hands-on capabilities.
Some organizations provided insights on underlying needs based on their previous on-the-ground experience. Such information can be of great value in setting priorities and providing a context for interpreting quantitative indicators. This is consistent with current efforts in the Standardized Monitoring Assessment of Relief and Transition and Health and Nutrition Tracking ServiceReference Malilay1, 11 projects in codifying contextual information for interpreting changes.
It is unfortunate that few reports described the types and magnitude of the effects of the population in areas where the organization had “eyes and ears on the ground.” This information would be far more useful and valid than the repetition of global figures on the total number of dead, which, in any case, turned out to be highly inaccurate.
We were also surprised that it was impossible, more than 4 years after the earthquake, to obtain primary data for the official figures of the extent of the earthquake. To date, we do not know exactly the source of the EM-DAT figures. Despite an extensive search on the Internet and numerous contacts with researchers, UN staff, and officials, we have no official report that included the primary official data and how these data had been generated. All reports in EM-DAT of the Centre for Research on the Epidemiology of Disasters refer to official government data.
This study has the limitation of focusing on only 1 Internet platform and involves an event that occurred years ago. However, it studies a widely used source and includes all studies actively posted on Reliefweb and those identified by the Reliefweb staff. One author, JvS, was actively working as a medical coordinator in this earthquake. At that time, he found no more widely used Internet platform. He did not use any other more robust data than those found in the reports posted on Reliefweb. Later, a UN-based Internet platform, the Humanitarian Information Centre, was established that provided more information.
The underestimation of the number of deaths contrasts with overestimates that occur in many other SODs. In the Bam earthquake in Iran 2003 and the attacks on the World Trade Center in 2001, for example, initial estimates of deaths were higher than later revealed. In the Pakistan earthquake, this could be due to difficult access to many affected areas in the first weeks, as it was in the 2008 cyclone Nargis in Myanmar.
To adequately estimate the need for outside assistance following an SOD, information on the extent of damage, the number of people affected, and the location of the people affected is essential.Reference Redmond2, Reference Mills, Checchi and Orbinski12 This information must, however, be combined with information on the pre-SOD situation, including the socioeconomic situation, geography, health and nutritional status, food security, water and sanitation, security, and the level of local resources and response capacity. With such information, a rapid assumption can be made that suggests the most urgent needs and upcoming risks for the affected population. We are currently exploring the use of such a “remote magnitude assumption” tool. Basic pre-SOD data for the most vulnerable countries should be constantly available on the Internet, together with census data per detailed administrative divisions. Standard comparable definitions of key variables such as “affected” or “injured” and “population in affected area” are needed to improve the comparability of field reports.
Conclusions
More modest reporting, based on the actual experience and observations of agents on the ground using standard response categories with common definitions, and information on the context for the event are needed. While there is a keen interest in global indicators, such as the total number of dead, organizations on the ground in one or another area cannot usefully provide such global estimates. Such evidence-based assessments are needed to facilitate the donor initiative “Good Humanitarian Donorship” that aims to ensure needs-based resource allocations. A common needs assessment for agencies involved in relief would allow allocations for an SOD to be based on better information regarding the needs of the population. There is, however, no standard approach to reporting and no common framework for what should be assessed and who should be responsible for it. There have been voices that advocate for independent and outside bodies to do such assessment, while others claim that this task should be an inclusive process conducted by operational agencies on the ground. There is, however, a trade-off, if quick and “objective” information is wanted, then it is likely that a specialized assessment agency would be the best choice. It is also important to note that the accuracy of the information can increase as time passes. In the early phase, assumptions based on scarce data must be made, while later, more detailed qualitative and quantitative surveys can increase the accuracy and validity of the data.
Funding/Support
This study was financed with a grant from the Swedish National Board of Health and Welfare (Socialstyrelsen).
Author Disclosures
The authors report no conflicts of interest.
Acknowledgment
We thank Felicia von Schreeb for data entry.