Clostridioides difficile infection (CDI) remains a pervasive issue throughout healthcare facilities in the United States, causing significant morbidity and mortality,Reference Lofgren, Cole, Weber, Anderson and Moehring1,Reference Leffler Daniel2 longer patient lengths of stay,Reference Miller, Polgreen, Cavanaugh and Polgreen3 and billions of dollars in excess healthcare costs.Reference Dubberke and Olsen4 Hospitals use a variety of approaches to tackle the spread of CDI with varying success in reducing rates of infection.Reference Louh, Greendyke and Hermann5 Since August 2011, the Centers for Medicare and Medicaid Services (CMS) Hospital Inpatient Quality Reporting Program has published final rules for reporting CDI to incentivize healthcare facilities to track rates of this infection nationwide.6 To measure nationwide progress toward the Department of Health and Human Services goal of a 30% reduction of hospital-onset CDI by 2020, hospitals report CDI through the Centers for Disease Control and Prevention (CDC) National Healthcare Safety Network (NHSN).7 Public health authorities use the NHSN to track CDI within their state and to make national comparisons.7 In 2018, 69,648 CDI were reported across 3,699 general acute-care hospitals to the NHSN, reflecting a 29% decrease from 2015 to 2018.8
To combat the spread of CDI and other healthcare-associated infections (HAIs), public health agencies work with hospitals to complete the CDC-directed frameworks, including the Targeted Assessment for Prevention Strategy (TAP). Part of the TAP strategy includes working with facilities to systematically identify gaps and to customize interventions to target locations with excess infection.9 To identify which facilities to target for participation in assessments, state health departments are able to curate ranked lists of highest excess HAIs to compare healthcare facilities of the same type. The excess infections represent the number of infections to prevent in order to achieve a HAI reduction goal, which is typically in line with the Health and Human Services (HHS) nationwide goals.7 Using this strategy, public health agencies are able to help their states achieve their HHS reduction goals and to ensure patient safety within their healthcare facilities. However, the TAP strategy and other infection control initiatives do not currently involve a notification threshold from a healthcare facility to public health agencies to begin an investigation. The TAP strategy is applied retroactively to data and is only available once data are complete within the NHSN system; these deadlines vary, and in some cases are >9 months after infection occurred.10 This delay limits rapid identification of outbreaks by public health agencies. The use of a notification threshold regarding potential outbreaks is currently left to the discretion of the facilities. In this study, we first aimed to identify a potential threshold of number of CDI for acute-care hospitals to notify public health agencies for an expedited response. We then aimed to determine whether notification thresholds can be used in conjunction with existing frameworks to further CDI reductions in the long term.
Methods
Data source
Laboratory-identified (LabID) CDI from acute-care hospitals (ACHs) in Colorado and Tennessee were identified via the NHSN, a nationwide reporting system for HAIs. Colorado and Tennessee reporting requirements stipulate that CDI must be reported for all locations that meet NHSN’s definition of facility-wide inpatient units. These include all inpatient locations physically located in the hospital, except inpatient rehabilitation and psychiatric locations.11 CDI reported are laboratory-confirmed positive for CDI toxin A and/or B tested on an unformed stool specimen. Alternatively, a toxin-producing CDI organism can be detected by culture or other laboratory means.11 NHSN classifies CDI as community onset if the culture was obtained on or before hospital day 3 and as healthcare facility onset if obtained on hospital day 4 or later, with the admission date being day 1.11
Inclusion criteria
Our study included healthcare facility-onset CDI from inpatients at general ACHs in Colorado and Tennessee. Only facilities and individual units with at least 1 reported CDI between January 1, 2018, and December 31, 2018, were included in the analyses.
Alert definitions
To identify units that would trigger facility notification to public health agencies, we assessed 3 threshold levels: ≥2, ≥3, and ≥4 CDI per calendar month per inpatient unit (ie, unit month). Values meeting or exceeding these thresholds were defined as alerts. Recurrent alerts were defined as alerts from units meeting the alert threshold at least twice within the 12-month study period.
Analyses
Alerts were calculated at the unit level and were aggregated by facility and state for all 3 thresholds. The number of alerts observed at each facility was further described by facility bed size and teaching status. Facilities were grouped into bed size ranges of <50, 50–99, 100–249, 250–399, and ≥400 beds. ACH teaching status was determined according to self-reported classification in the NHSN Annual Facility Survey. According to the survey guidelines, major teaching status was defined as a facility that trains medical and/or nursing students, as well as postgraduate residents. Graduate teaching status was defined as a facility that trains only postgraduate medical (MD/DO) residents and fellows. Undergraduate teaching status was defined as a facility that trains current medical and/or nursing students. A designation of “none” indicated that a facility did not participate in training undergraduate, postgraduate, or graduate students.12
The number of recurrent alerts were identified at the unit level and we aggregated by facility and state for each threshold. For each state, the proportion of all alerts considered to be recurrent was calculated, in addition to identifying the number of distinct facilities and units that had recurring alerts. Facility excess infections values were calculated using the following formula:
 $${\rm Excess\; infections} = ({\rm no\;of\;observed\;CDI}) - [({\rm no\; of\; predicted\; CDI}) \times 0{\hbox {\hbox {\hbox {\hbox {\hbox {\hbox {\hbox {\hbox {\hbox {\hbox {\hbox {\hbox {\hbox .}}}}}}}}}}}}}5], $$
where the number of predicted events was reported by NHSN’s risk-adjusted algorithm and 0.5 corresponded to the HHS goal of reducing the ratio of observed to predicted events to 0.5. To evaluate the relationship between alerts and facility excess infections, we identified facilities that had at least 1 alert from any inpatient unit during 2018 at each threshold level. We calculated the cumulative excess infections of those above-threshold facilities, as well as the proportion of the total state excess infections that the facilities constituted. Additionally, a timeline of all alerts across each state was established by month from January to December 2018. By month, we calculated the year-to-date number of alerts and percent of the year total that the cumulative alerts represented.
Data collection and analyses were performed as a function of routine public health practice and thus did not require prior institutional review board approval.
Results
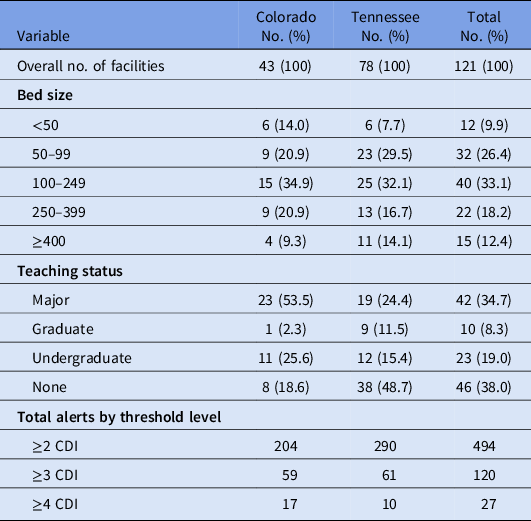
During 2018, a total of 52 ACHs in Colorado and 104 ACHs in Tennessee were enrolled in the NHSN to report CDI. Of those facilities, 43 from Colorado and 78 from Tennessee met the inclusion criteria. Table 1 describes the characteristics of these ACHs. Facility bed size was highly variable across both states; ACHs ranged from 37 to 583 beds in Colorado and from 18 to 741 beds in Tennessee. The median number of beds at each facility was 170 in Colorado and 348 in Tennessee, with the greatest proportion of facilities falling in the 100–249 bed-size range in both states (34.9% and 32.1%, respectively). Although most facilities in Colorado were characterized as major teaching hospitals (53.5%), most Tennessee hospitals were nonteaching facilities (48.7%), and 24.4% were of major teaching status.
Characteristics of Acute-Care Hospitals With Laboratory-Reported Clostridioides difficile Infections (CDI)—Colorado and Tennessee, 2018

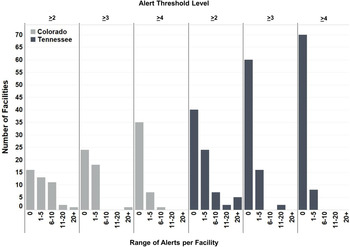
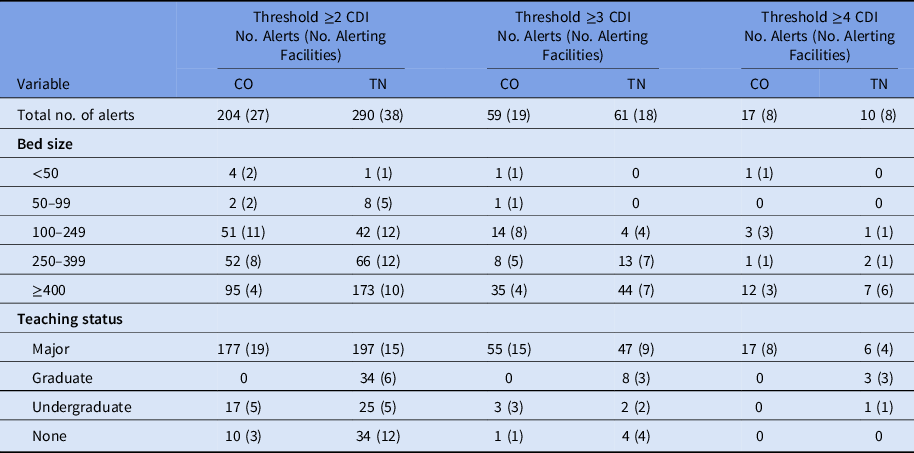
In 2018, Colorado ACHs reported 1,043 healthcare facility-onset CDI events and Tennessee ACHs reported 1,685 healthcare facility-onset CDI. Of all CDI, 62.7% were attributed to only 10 ACHs in Colorado and 57.4% were attributed to only 10 ACHs in Tennessee. At an alert threshold of ≥2 CDI per unit month, there were 204 alerts across Colorado and 290 alerts across Tennessee. At a threshold of ≥3 CDI per unit month, there were 59 alerts in Colorado and 61 alerts in Tennessee, and at a threshold of ≥4 CDI per unit month, there were 17 alerts in Colorado and 10 alerts in Tennessee. In both states, most facilities did not have any alerts during 2018 (Fig. 1). Most facilities with units that did exceed the alert threshold level of ≥2, ≥3, or ≥4 CDI had 1–5 alerts over the 12-month study period. The number of alerts at facilities decreased with increasing threshold level in both states. The greatest number of alerts at a single facility was 58 in Colorado and 43 in Tennessee, at an alert threshold of ≥2 CDI per unit month. With few exceptions, the total number of alerts occurring in the 12-month study period across each state increased with facility bed size and decreased with increasing alert threshold (Table 2). The median number of alerts per facility was greatest in facilities having ≥400 beds. In both states, the greatest number of alerts occurred among major teaching hospitals.
Number of alerts per facility for laboratory-reported Clostridioides difficile infections (CDI) by alert threshold level, Colorado and Tennessee, 2018.

Annual Number of Alerts for Laboratory-Reported Clostridioides difficile Infections (CDI) by Facility Characteristics and Alert Threshold Among Acute-Care Hospitals—Colorado (CO) and Tennessee (TN), 2018

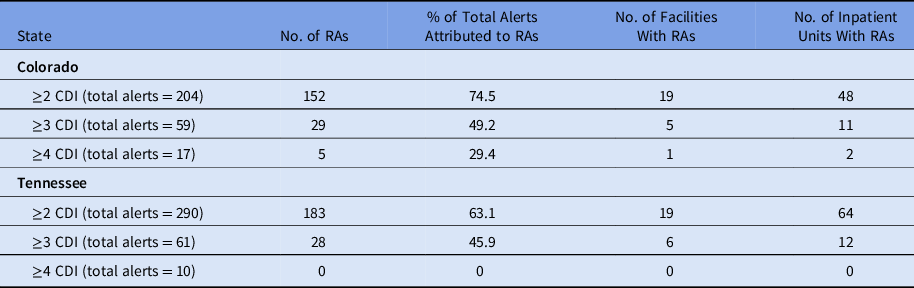
The total number of recurrent alerts observed in both Colorado and Tennessee decreased with higher threshold levels (Table 3). In Colorado, recurrent alerts accounted for nearly 75% of all alerts at a threshold of ≥2 CDI per unit month and nearly 50% of alerts at threshold ≥3 CDI per unit month. Recurrent alerts accounted for a slightly smaller proportion of all alerts in Tennessee (63.1% and 45.9%, respectively). At an alert threshold of ≥3 CDI, all recurrent alerts were attributed to only 5 Colorado and 6 Tennessee ACHs. Recurrent alerts at a threshold of ≥3 CDI came from only 11 distinct inpatient units in Colorado and 12 in Tennessee.
Annual Number of Recurrent Alerts (RAs), Attributed Facilities, and Inpatient Units Among Acute-Care Hospitals With Laboratory-Reported Clostridioides difficile Infections (CDI)—Colorado and Tennessee, 2018

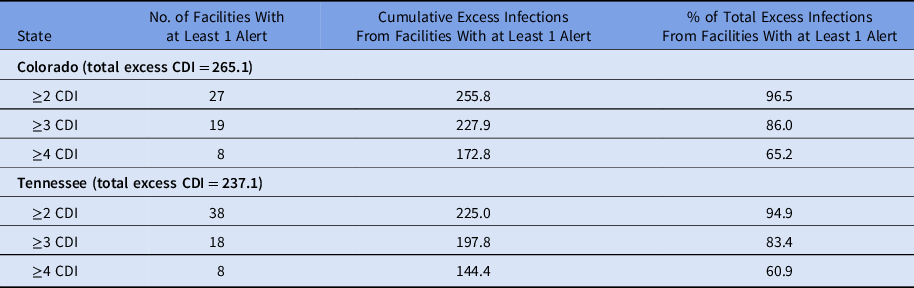
In 2018, Colorado had 265.1 statewide excess infections and Tennessee had 237.1 (Table 4). Facilities with at least 1 alert at a threshold level of ≥2 CDI per unit month collectively reported ∼95% of the statewide excess infections in both Colorado and Tennessee. The excess infections attributed to ACHs with at least 1 alert decreased with increasing threshold, but at a threshold level of ≥4 CDI, these facilities still accounted for >60% of the statewide excess infections in both Colorado and Tennessee.
Cumulative Excess Infections From Facilities With at Least 1 Alert for Laboratory-Reported Clostridioides difficile Infections (CDI) by Threshold Level in Colorado (CO) and Tennessee (TN) Acute-Care Hospitals, 2018

Discussion
Significant reductions of CDI in hospital settings have occurred as a result of prevention initiatives, including the CDC’s TAP StrategyReference White, Soe and Osborn13 and the Core Elements Hospital Antibiotic Stewardship Programs.Reference Guharoy, Daragjati and Groves14 However, at 0.72, the 2018 nationwide SIR for healthcare-facility onset CDI remains greater than the HHS 2020 action goal of an SIR of 0.5.15 In 2018, according to the CDC’s Healthcare-Associated Infections Progress Report, Colorado did not see a significant change in their SIR for CDI from 0.93 in 2017 to 0.88 in 2018. Although Tennessee did observe a statistically significant decrease in their SIR from 0.83 to 0.68, both states continue to fall short of reduction targets.
CDI initiatives, such as the TAP strategy, are subject to time delays between the start of laboratory identification of events and reporting to public health. This delay occurs because TAP reports are conducted using 3 consecutive months of data and because facilities are often given at least 30 days to enter data into NHSN following the end of each month. By the time public health agencies are able to access and assess complete data, >4 months may have passed since CDI occurred at the beginning of the quarter. In states where NHSN deadlines mirror CMS Hospital Inpatient Quality Reporting Program deadlines, this delay in data access and analysis can be closer to 9 months.10
In this study, we sought to identify a threshold for identification of potential facility CDI transmission that would trigger notification by ACHs to public health officials for earlier intervention. Colorado and Tennessee facilities were evaluated to determine how many alerts would occur if the alert threshold were set at ≥2, ≥3, or ≥4 CDI per unit month. As expected, the number of alerts per each facility and state decreased as the threshold increased. Predictably, larger ACHs had more alerts than smaller facilities at each threshold level. Most alerts occurred among major teaching hospitals, but there was not a clear pattern between the number of alerts and the other teaching categories. Overall, facility characteristics of bed size and teaching status did not provide clear value for determining notification threshold levels.
At >200 alerts over 12 months in both states, we determined that a threshold of ≥2 CDI per month from a single unit was too low to warrant public health notification. Although that threshold level would enable early assessment of facilities and ACHs with alerts would encompass >90% of the excess infections for each state, >200 alerts per calendar year would create an unrealistic burden for both the infection prevention staff at ACHs and public health agencies. Similarly, notification following recurrent alerts would still result in >150 notifications over the year from more facilities and inpatient units than may be reasonable to assess. In contrast, a threshold of ≥4 CDI yielded few alerts over the year, with a total of 17 in Colorado and 10 in Tennessee. These alerts were generated from 8 facilities in each state and those facilities represented ∼60% of the statewide excess infections.
Considering these results, an alert threshold of ≥3 CDI per unit month provides the best opportunities for rapid public health response, multiple strategies for targeting facilities, and assessment of excess CDI while also being mindful of burden to public health and healthcare facilities. At this threshold, there were ∼60 alerts from just <20 ACHs in each state. Also, ∼50% of alerts at threshold ≥3 CDI were recurrent alerts, and these recurrent alerts only occurred in 5 of the 19 alerting ACHs in Colorado and 6 of the 18 alerting ACHs in Tennessee. Having such a high proportion of recurrent alerts from a small number of facilities makes the use of recurrent alerts another feasible option for targeting facilities with high CDI burden. This method may be particularly advantageous for smaller public health programs with limited staff or funding resources to reduce the number of facilities targeted for assessment. Additionally, facilities with at least 1 alert accounted for ∼85% of the 2018 excess infections in both Colorado and Tennessee. If public health agencies are notified of these alerts and have the capacity to respond with infection control assessments and recommendations, there is significant opportunity to reduce excess CDI across the state in a more timely manner.
Facilities will have identified many more CDI that could have potentially been prevented with earlier implementation of adjusted infection control and stewardship practices. With a substantial proportion of alerts occurring among a limited number of ACHs, we anticipate that a strategy of notification of public health using a threshold of ≥3 would result in effective facility-wide reductions in CDI. Early collaboration and subsequent reductions would also reduce the anticipated administrative burden as alerts become less frequent in facilities implementing the recommended control measures. Existing NHSN infrastructure for reporting CDI additionally allows facilities and public health agencies to quantify the impact of the notification system and associated interventions.
Our analysis is subject to some notable limitations. Although we demonstrated similarities in interpretation of the thresholds in 2 states, we recognize that our observations and recommendations may not be generalizable to other states with differing facility characteristics or CDI burden. Additionally, the proposed alert thresholds do not account for changes in CDI burden over time. Nationally, rates of CDI in acute-care settings are in decline.15 The results of this study have been limited to 1 year of data, so it is uncertain whether future decreases in CDI will influence the efficacy of the proposed thresholds for notification. Although these limitations may cause other public health agencies to question the relevance of the results to their jurisdictions, the study methods can be easily employed to identify the most appropriate threshold for public health notification by acute-care facilities. Identification of an alert threshold for CDI is an important adjunct early intervention strategy that should be used in conjunction with the TAP strategy and other CDI prevention initiatives. The combined efforts will enable ACHs to make further progress toward national HAI reduction goals using methods that are timely, effective, and easily integrated into existing infection control infrastructure.
Acknowledgments
This analysis was performed as part of the ongoing efforts by the Council for Outbreak Response: Healthcare-Associated Infections and Antimicrobial-Resistant Pathogens (CORHA) to develop outbreak definitions and thresholds for reporting to public health. We thank CORHA for their expert guidance. We would also like to thank the acute-care hospitals in Colorado and Tennessee for their diligent work performing surveillance and reporting CDI laboratory data to NHSN.
Financial support
The Tennessee Department of Health received support from the Centers for Disease Control and Prevention (CDC) Epidemiology and Laboratory Capacity (grant 6NU50CK000386). The Colorado Department of Public Health and Environment received support from the Centers for Disease Control and Prevention (CDC) Epidemiology and Laboratory Capacity (grant no. 6NU50CK000552).
Conflicts of interest
All authors report grants, and Dr Kainer additionally reports nonfinancial support, from the Centers for Disease Control and Prevention during the conduct of the study. Dr Kainer reports nonfinancial support from Council of State and Territorial Epidemiologists (CSTE), nonfinancial support from Society for Healthcare Epidemiology of America, personal fees and nonfinancial support from Infectious Disease Consulting Corporation (IDCC), personal fees and nonfinancial support from WebMD, nonfinancial support from Association for Professionals in Infection Control and Epidemiology (APIC), nonfinancial support from American Society for Microbiology, personal fees and nonfinancial support from Pfizer, and nonfinancial support from Public Health Association of Australia, outside the submitted work.