Introduction
The relationship between parasites and climate has received increasing attention in recent years due to global climate change (see Harvell et al., Reference Harvell, Mitchell, Ward, Altizer, Dobson, Ostfeld and Samuel2002; Altizer et al., Reference Altizer, Ostfeld, Johnson, Kutz and Harvell2013). Parasites may have a significant negative effect on growth rates of host populations through their effect on fitness of individual hosts (Anderson and May, Reference Anderson and May1978; May and Anderson, Reference May and Anderson1978). Climate change may alter important aspects in the parasite–host relationship (e.g. transmission rate) and potentially lead to drastic changes in the population dynamics of both parasites and hosts (Harvell et al., Reference Harvell, Mitchell, Ward, Altizer, Dobson, Ostfeld and Samuel2002; Altizer et al., Reference Altizer, Ostfeld, Johnson, Kutz and Harvell2013). One important parameter that may be altered is the percentage of hosts infected in a population at a given time, i.e. parasite prevalence. Several experimental and observational studies have indicated that variation in climatic parameters may affect the parasite prevalence in a population (see Harvell et al., Reference Harvell, Altizer, Cattadori, Harrington and Weil2009; Lafferty, Reference Lafferty2009), both directly and indirectly. For example, Zamora-Vilchis et al. (Reference Zamora-Vilchis, Williams and Johnson2012) found that prevalence of blood parasites was higher in bird populations that inhabited areas with higher annual temperatures. They attributed this pattern to both higher vector abundance and faster development of the parasites at higher temperatures. Along with temperature, there has also been a call for more studies which also investigate the effects of precipitation (Altizer et al., Reference Altizer, Ostfeld, Johnson, Kutz and Harvell2013). Precipitation may have a direct influence on parasite prevalence, for example through desiccation of free-living parasite eggs or larvae (e.g. Hudson and Dobson, Reference Hudson and Dobson1991; Miterpakova et al., Reference Miterpakova, Dubinsky, Reiterova and Stanko2006; Jex et al., Reference Jex, Schneider, Rose and Cribb2007) or indirectly through other mechanisms such as vector availability (Sacks et al., Reference Sacks, Chomel and Kasten2004). Furthermore, host demography may play an important role in the parasite–host relationship (see Dobson, Reference Dobson, Esch, Bush and Aho1990). For instance, transmission of parasites may increase with host population density (Anderson and May, Reference Anderson and May1978), which in turn may increase prevalence (Arneberg, Reference Arneberg2001). Parasites often have an aggregated distribution with respect to host individuals (see Wilson et al., Reference Wilson, Bjørnstad, Dobson, Merler, Poglayen, Randolph, Read, Skorping, Hudson, Rizzoli, Grenfell, Heesterbeek and Dobson2002). Therefore, reliable estimates of parasite prevalence require sampling of a large proportion of the host population (Wilson et al., Reference Wilson, Bjørnstad, Dobson, Merler, Poglayen, Randolph, Read, Skorping, Hudson, Rizzoli, Grenfell, Heesterbeek and Dobson2002). In addition, because parasite prevalence may differ between different classes of individuals (e.g. adults vs juveniles), sampling should be stratified (i.e. equal proportion of different groups) in order to avoid bias in estimates of prevalence.
In the current study we explore the relationship between climate and prevalence of the parasitic nematode Syngamus trachea in a metapopulation of house sparrows (Passer domesticus) in northern Norway over a 7-year period. Our aim was to investigate whether within-year variation in prevalence of S. trachea could be explained by temperature, precipitation and population density. We also investigated the relationship between prevalence among years and the preceding winter climate estimated by the North Atlantic Oscillation (NAO) index.
Materials and methods
Study area
The study was carried out in an archipelago consisting of 18 islands in the Helgeland district in northern Norway (Supplementary Fig. S1). The house sparrows on these islands have been studied at an individual based level by capture–mark–recapture methods since 1993 (Holand et al., Reference Holand, Kvalnes, Gamelon, Tufto, Jensen, Parn, Ringsby and Sæther2016). In this study, we focus on four of the islands (Aldra, Gjerøy, Hestmannøy and Indre Kvarøy), where the sparrows mainly live in colonies on dairy farms. House sparrows shelter inside farm buildings when weather is harsh, especially in winter. A high proportion of individuals have been individually marked (>90%), the annual recapture probability is high (>70%), and fecal samples have been collected since 2007. Individuals have often been captured and sampled several times during their lifetime. Because of the sedentary nature of the house sparrows, the large size of the study area and the high proportion of individually marked individuals in our metapopulation, we can identify individuals that move between islands in the study area (Pärn et al., Reference Pärn, Ringsby, Jensen and Sæther2012).
Study species
The parasite of interest in this study is the nematode worm S. trachea. Syngamus trachea has a cosmopolitan distribution and has been found in most terrestrial bird genera (Atkinson et al., Reference Atkinson, Thomas and Hunter2008). In Norway the parasite has been recorded in several wild-bird species (for a list see Bakke, Reference Bakke1973). The parasite is known as ‘gapeworm’ in the poultry industry, where outbreaks have caused substantial problems (Atkinson et al., Reference Atkinson, Thomas and Hunter2008). Syngamus trachea has a lifecycle that may include a paratenic host (earthworms, snails or insects) in addition to the final avian host. The parasite(s) feed on blood in the trachea tissue causing mechanical damage, anaemia, inflammation and excess mucus production. The birds that are infected may develop symptoms consisting of gasping, wheezing and shaking of the head. This discomfort may affect food uptake, which combined with blood loss and the symptoms listed above, can cause death (Atkinson et al., Reference Atkinson, Thomas and Hunter2008). The prepatent period (i.e. the time between infection and first egg produced by the parasite) is 12–17 days in chickens (Gallus gallus) and the adults can live 2–4 months (Barus, Reference Barus1966b). Males and females join in permanent copulation and the female releases eggs which are passed in the feces of the host (Atkinson et al., Reference Atkinson, Thomas and Hunter2008). The development time of embryos into third stage invasive larvae depends on temperature, and has a lower limit of 16 °C (Barus, Reference Barus1966a). For temperatures over 16 °C, the development time may vary from ca. 45 days at 17 °C to ca. 7 days at 29 °C (Barus, Reference Barus1966a). At temperatures above 29 °C, the development time increases, becomes irregular and stops at 35–37 °C (Barus, Reference Barus1966a). Barus (Reference Barus1966a) found that eggs could be vulnerable to desiccation and may become incapable of further development after 14 days of exposure to the daily varying temperature (12–24 °C) and humidity (36–97%). It was also found that ca. 35% of eggs died when exposed to temperatures between −15 and −25 °C for 45 days.
The house sparrow is a small passerine bird with a global distribution, and is widely distributed on the Northern hemisphere (Anderson, Reference Anderson2006). The house sparrows live in close association with human settlements. During winter their diet mainly consists of cattle food, and seeds from cultivated crops (Anderson, Reference Anderson2006). In the summer the house sparrows forage outdoors, to a large extent, on different types of seeds and insects (Anderson, Reference Anderson2006).
Fieldwork, climate data and population size
We captured house sparrows using mist-nets and placed the birds in paper bags with a small hole at the top to prevent asphyxiation. After ~10 min in the paper bag, a fecal sample had usually been obtained. Samples were stored in 1 mL of MilliQ H2O in a 1.5 mL cryo-tube at between 1 and 8 °C until analysed. Samples were analysed by flotation of eggs in a McMaster egg counting chamber (see Holand et al., Reference Holand, Jensen, Tufto, Sæther and Ringsby2013 for detailed description). During 2007–2013 (1st May–8th November), 3619 fecal samples were collected from 1705 individuals. Detection of eggs from S. trachea in bird feces is a reliable and consistent method of monitoring prevalence in host populations (Barus, Reference Barus1966b, Reference Barus1966c). To our knowledge, S. trachea does not present a circadian rhythm in the release of eggs. In addition to captures, we also visited nests in the populations and marked fledglings when they were ca. 11 days old.
Weather data were obtained from Norwegian Meteorological Institute's weather stations on the islands Myken and Solvær in the Helgeland archipelago (Supplementary Fig. S1). High-spatial correlation in daily mean temperature (°C) and daily precipitation (mm) has been found between the two weather stations (Ringsby et al., Reference Ringsby, Sæther, Tufto, Jensen and Solberg2002). When choosing our weather predictor variables, the life-history of the parasite was considered. The time between infection and first egg produced by the parasite (prepatent period) is ca. 15 days (see above). During this period we assumed that weather had little or no impact on the parasite. Furthermore, we assumed that the mean weather conditions during a 20-day time-window before the prepatent period was likely to capture the important period during which the weather conditions (temperature and precipitation) may influence the development time of infective larvae (see above). This would allow us to investigate if variation in the mean weather conditions preceding our sample explained the individual probability of infection by S. trachea. As an index of large-scale climatic variation we used station-based Hurrell NAO index for winter months (December–March). The data were obtained from the National Center for Atmospheric Research, USA. This index is based on the difference in normalized atmospheric pressure at sea level among Lisbon, Portugal and Reykjavik, Iceland. In Scandinavia, a positive winter NAO index is correlated with milder and wetter winters whereas a negative NAO index is correlated with colder and dryer winters (Hurrell, Reference Hurrell1995).
An estimate of population size on a given day of the year was obtained from estimates of the number of alive adults and simulations of a model of daily juvenile mortality rates as a function of fledging date of nestlings (for a detailed method, see Supplementary information S1). Relative daily population size within each sub-population was calculated by subtracting the mean population size and dividing by the standard deviation (i.e. a z-score transformation). Assuming that the size of the suitable habitat in the subpopulations did not change in the period, this estimate corresponds to population density at a given day and subpopulation. We also calculated the mean population density in a 20-day time-window before the prepatent period as we assumed that this was likely to influence parasite prevalence (same as weather variables, see above).
Statistical analyses
All analyses were conducted using the statistical software package R version 3.5.1 (R Core Team, 2018). The focal response variable in the statistical analyses was individual infection status. We defined an individual as infected (status = 1) if at least one egg of S. trachea was found in the fecal sample. If no eggs were found, the infection status was set to 0. We modelled infection status (prevalence) using generalized linear mixed models (package glmmTMB version 0.2.2.0) with a Bernoulli response variable (i.e. whether an individual was infected or not) and a logit link function. Because many individuals (N = 774) were sampled more than once within a season, we included a random intercept for individual identity to avoid pseudoreplication. We have previously shown (Holand et al., Reference Holand, Jensen, Tufto, Sæther and Ringsby2013) that prevalence varies within season, islands and among demographic groups in the study area. We therefore included the main effect of: life-stage group (LSG: juvenile, adult male or adult female), island and season day number (SDN). SDN was the date when a bird was sampled, where day 1 was 1st of January. In addition, Holand et al. (Reference Holand, Jensen, Tufto, Sæther and Ringsby2013) found substantial variation in prevalence among years. A random intercept for year was therefore included in all models. To test if the effects of weather on prevalence varied during the season, we included the two-way interactions between weather variables and SDN. We also included second order terms of weather variables and the population density variable in order to evaluate nonlinear effects of these respective variables. No higher-order terms (interactions or quadratic terms) were included without the presence of the respective main effects of the term. The NAO index was included as a yearly variable (i.e. one estimate for each year in the study). To increase interpretability of interaction terms, we centred SDN and the two weather variables on zero (i.e. mean = 0). In order to prevent possible effect of multicollinearity, all explanatory variables were assessed for collinearity visually, by the use of Pearson's correlation coefficient (r p) and variance inflation factors (see Dormann et al., Reference Dormann, Elith, Bacher, Buchmann, Carl, Carré, Marquéz, Gruber, Lafourcade, Leitão, Münkemüller, McClean, Osborne, Reineking, Schröder, Skidmore, Zurell and Lautenbach2013). Candidate models were ranked using Akaike information criterion corrected for small sample sizes (AICC), which penalizes models with a high number of parameters relative to sample size (Burnham and Anderson, Reference Burnham and Anderson2002). Estimates from models are reported as mean ± 1 standard error (s.e.).
We also tested the correlation between the observed annual mean prevalence in July and the winter NAO index (n = 7). July was the month with the largest sampling size of feces in our study system (Holand et al., Reference Holand, Jensen, Tufto, Sæther and Ringsby2013).
Results
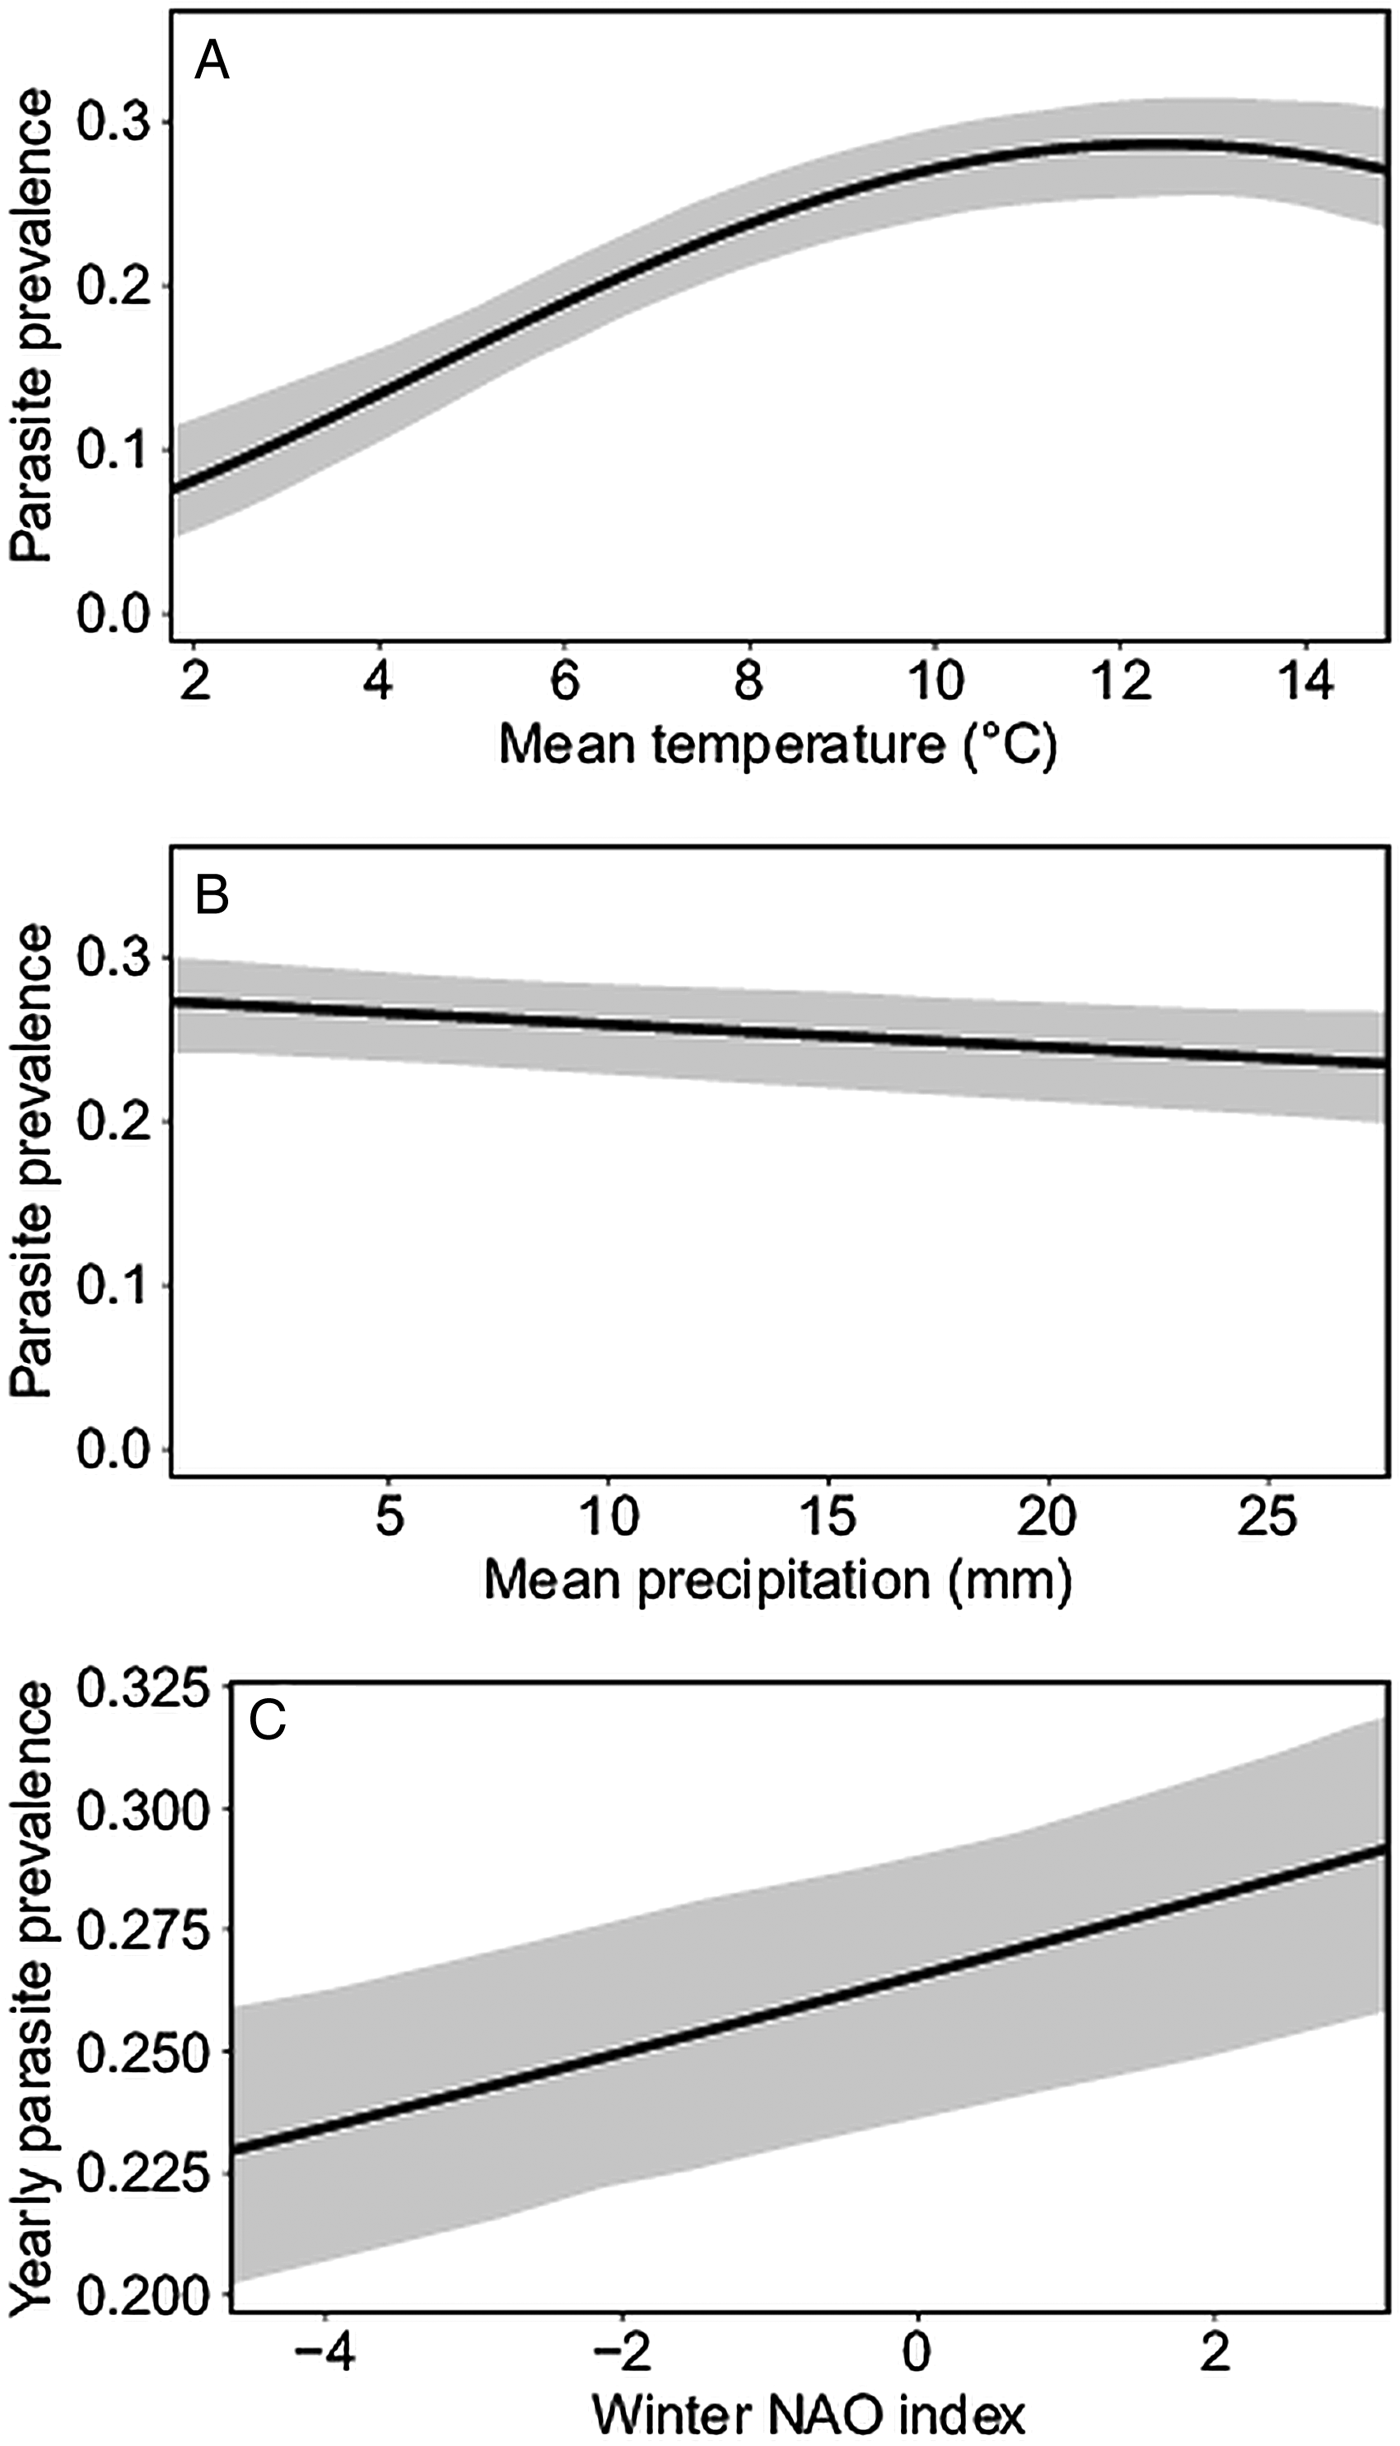
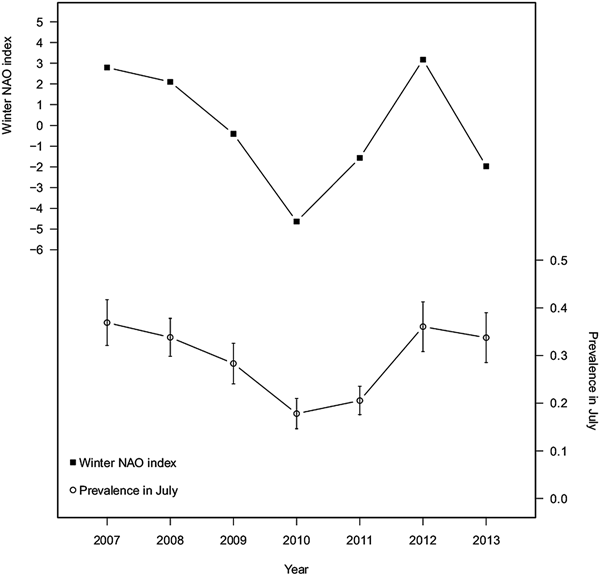
Six models obtained a ΔAICC < 2 in our model comparison (Table 1). Among these, the second highest ranked model contained the fewest number of parameters and may be considered the most parsimonious. The five alternative models contained some of the parameters that were present in the second highest ranked model (Table 1). All of our highest ranked models contained a quadratic effect of temperature on parasite prevalence (Fig. 1A), which indicated that parasite prevalence increased to a peak at 12.37 °C and then levelled out at very high temperatures (see Fig. 1A and Table 1). All the highest ranked models also contained a negative effect of precipitation on parasite prevalence (see Fig. 1B and Table 1). The five alternative models also contained interactions between SDN and temperature and precipitation respectively, but the uncertainty of parameter estimates was large and impeded any interpretations. All of the six top models contained a positive effect of NAO on parasite prevalence (Fig. 1C and Table 1). Finally, there was a strong positive correlation between mean parasite prevalence in July and NAO (r p = 0.83, n = 7, t = 3.38, P = 0.02, Fig. 2).
Predicted values (solid line) from the most parsimonious model (based on AICC) for prevalence of the parasite Syngamus trachea in a metapopulation of house sparrows on the coast of Helgeland, Norway. (A) The effect of within-year variation in temperature, (B) precipitation and (C) winter NAO index. All predicted values are shown with 95% confidence intervals (grey).

The relationship between the winter NAO index and observed mean prevalence of the parasite S. trachea in a metapopulation of house sparrows on the coast of Helgeland, Norway, in the month of July. Estimates of mean July prevalence are shown with ±1 s.e.

Parameter estimates (±1 s.e.) of the six best models (according to AICC) of parasite prevalence (Syngamus trachea) in a metapopulation of house sparrows in Norway

T, temperature; P, precipitation; SDN, season day number; d.f., degrees of freedom.
Models were fitted using generalized linear mixed models. Estimates are shown for each variable contained in the model. In addition, all models also contained the main fixed effect of island, LSG (adult male, adult female, juvenile) and random intercept effects of individual identity and year.
All estimates are given with ±1 s.e.
Discussion
This study has found that climate and weather can be important factors in explaining variation in parasite prevalence patterns in natural populations of hosts. Our study also indicated that large scale climatic patterns measured as NAO, may have a substantial impact of parasite prevalence on wild populations of hosts.
Specifically, we found that within-year prevalence of S. trachea was positively associated with temperature (but less so at very high temperatures). This supports previous qualitative studies conducted by Barus (Reference Barus1966a, Reference Barus1966b, Reference Barus1966c), who observed that prevalence of S. trachea in domestic birds increased during the year as the temperature increased. Similar increases in prevalence within years have been found for other parasite species and hosts (e.g. Karvonen et al., Reference Karvonen, Rintamaki, Jokela and Valtonen2010; Paredes-Esquivel et al., Reference Paredes-Esquivel, del Rio, Monerris, Borras, Laglera and Miranda2012; Bottari et al., Reference Bottari, Liguori, Trilles, Giordano, Romeo, Perdichizzi and Rinelli2013). The underlying mechanisms for a positive relationship between parasite prevalence and within-year temperature may be difficult to determine. However, studies have shown that thresholds in temperature may make it very difficult for certain parasites to complete their life cycles due to reduced larvae survival probability or prolonged egg development time at certain temperatures (e.g. Barus, Reference Barus1966a; O'Connor et al., Reference O'Connor, Walkden-Brown and Kahn2006; Tinsley et al., Reference Tinsley, York, Everard, Stott, Chapple and Tinsley2011). This may typically limit transmission of parasites to the summer season in artic regions (Kutz et al., Reference Kutz, Hoberg, Polley and Jenkins2005; Jenkins et al., Reference Jenkins, Veitch, Kutz, Hoberg and Polley2006; Hoberg et al., Reference Hoberg, Polley, Jenkins, Kutz, Veitch and Elkin2008). Several studies have also shown that development rates of parasite eggs and larvae increase with temperature (Hoar et al., Reference Hoar, Ruckstuhl and Kutz2012; Leathwick, Reference Leathwick2013). This may increase transmission rate at higher temperatures (Kutz et al., Reference Kutz, Hoberg, Polley and Jenkins2005) and may lead to higher parasite prevalence.
Our results suggested that high levels of precipitation reduced parasite prevalence. However, we found only minor changes in predicted prevalence for each millimetre of increased precipitation (Fig. 1B). Although eggs and larvae of S. trachea may generally be susceptible to desiccation (see Materials and methods section), this does not seem to be a limiting factor in our study system. We found no effect of population density on prevalence of S. trachea in our subpopulations. This was somewhat surprising given that studies often suggest that prevalence should increase with increasing population density (see the Introduction). However, there may be a more complex relationship between population density and transmission rates in our populations. For example, parasite prevalence and transmission rates could be affected by heterogeneity in parasite resistance of individual hosts (Borg et al., Reference Borg, Pedersen, Jensen and Westerdahl2011, Lundregan et al., unpublished results). Alternatively, one or more of our assumptions used to estimate population density may have caused a weakening of the relationship between parasite prevalence and the true population density.
Interestingly, all the highest ranked models included the annual winter NAO index, where mild winters were associated with higher prevalence the following sampling period (1 May–8 November). This result was also shown as a very strong positive correlation between the winter NAO index and observed mean prevalence in July the following summer (Fig. 2). However, these results were based on only seven NAO values (7 years) and should therefore be interpreted with some caution. Given that this relationship is valid, it may be generated via several mechanisms. First, it is known that many free-living stages of parasites (including S. trachea) have a relatively low tolerance to temperatures below 0 °C and may suffer an increased mortality due to low temperatures during winter (Barus, Reference Barus1966a; O'Connor et al., Reference O'Connor, Walkden-Brown and Kahn2006; Descamps, Reference Descamps2013; Sherrard-Smith et al., Reference Sherrard-Smith, Chadwick and Cable2013). A mild winter may result in increased winter survival of eggs and larvae, which in turn may increase the parasite prevalence in the host population the following summer. Alternatively, mild winters may result in increased survival probability of host individuals with a poor body condition that may be more susceptible to infection the following summer. Second, a positive winter NAO index is often associated with milder spring temperatures (Helama and Holopainen, Reference Helama and Holopainen2012) and could therefore result in a longer transmission window for the parasite. Finally, a positive winter NAO index might lead to a higher abundance of paratenic hosts (insects) the following summer (Westgarth-Smith et al., Reference Westgarth-Smith, Roy, Scholze, Tucker and Sumpter2012), thereby facilitating the transmission of S. trachea to its avian hosts. Some climate models have predicted that frequencies of positive winter NAO index's may increase in the future (Kuzmina et al., Reference Kuzmina, Bengtsson, Johannessen, Drange, Bobylev and Miles2005). This could lead to significant changes in the parasite–host relationship in the future. For instance, as global warming is predicted to result in wetter and milder winter temperatures in northern Europe (Alcarro et al., Reference Alcarro, Moreno, Nováky, Bindi, Corobov, Devoy, Giannakopoulos, Martin, Olesen and Shvidenko2007), the current study suggests that parasite species which are limited by low temperatures during the winter season may extend their geographical distribution to higher altitudes and latitudes as a consequence. Understanding how climate impacts parasites and hosts may be vital in accurately predicting the changes in natural communities due to climate change (Altizer et al., Reference Altizer, Ostfeld, Johnson, Kutz and Harvell2013). Such knowledge may prove crucial in conservation and management efforts of threatened species and ecosystems (Harvell et al., Reference Harvell, Mitchell, Ward, Altizer, Dobson, Ostfeld and Samuel2002).
Supplementary material
The supplementary material for this article can be found at https://doi.org/10.1017/S0031182019000337.
Author ORCIDs
H. Holand, 0000-0001-9530-7096.
Acknowledgements
We would like to thank everyone involved in the house sparrow project for help with fieldwork and Grethe Stavik Eggen, Randi Røsbak and Henriette Vaagland for help with analysing fecal samples. We are also grateful to everyone at Centre for Biodiversity Dynamics (CBD), NTNU, for helpful comments and help with statistics in R.
Financial support
This study was funded by the Research Council of Norway (RCN grant no. 274930), the RCN's Centres of Excellence funding scheme (grant no. 223257) and the Norwegian University of Science and Technology.
Conflict of interest
None.
Ethical standards
The research was carried out in accordance with permits from the Norwegian Animal Research Authority, the Norwegian Environment Agency, and the Bird Ringing Centre at Stavanger Museum, Norway.