1. Introduction
Steep-fronted coastal structures such as breakwaters and sea walls can suffer severe damage during violent storms. When Oumeraci (Reference Oumeraci1994) reviewed the failures of 22 breakwaters of various types, he concluded that breaking waves were the most significant cause of damage and that greater knowledge was required of the associated impact loads. Subsequent attempts to obtain a detailed understanding of the temporal and spatial variations in the associated pressure, force and impulse have been complicated by the fact that significant quantities of air are usually entrained as bubbles within the water column due to wave breaking and earlier wave impacts. Additional air is often trapped as a pocket between the overturning breaker and the structure. This means that compressibility effects need to be taken into account even if the water is assumed to be incompressible.
Bagnold (Reference Bagnold1939) was one of the first to conduct laboratory experiments into breaking wave impacts on a vertical wall and found that the highest pressures occurred when a small pocket of air was trapped against the wall. This was confirmed by Hattori, Arami & Yui (Reference Hattori, Arami and Yui1994) who also observed that pressure waves propagated away from the impact zone at the speed of sound, i.e. as acoustic waves in the fluid. Other findings regarding the characteristics of violent wave impacts include the strong sensitivity of impact pressures to wave shape (Bagnold Reference Bagnold1939; Hattori et al. Reference Hattori, Arami and Yui1994; Peregrine et al. Reference Peregrine, Bredmose, Bullock, Hunt, Obhrai and Smith2006; Bullock et al. Reference Bullock, Obhrai, Peregrine and Bredmose2007), see also Chan & Melville (Reference Chan and Melville1988), and oscillatory temporal pressure variations following the main impact due to alternate compression and expansion of trapped air. The latter has often been found to lead to the occurrence of subatmospheric pressures at the end of the first and even subsequent expansion phases (Bullock et al. Reference Bullock, Obhrai, Peregrine and Bredmose2007). All of these phenomena were comprehensively reproduced in the results of Bredmose, Peregrine & Bullock (Reference Bredmose, Peregrine and Bullock2009), who developed a novel model of aerated flows and computed its solutions numerically. This study also showed how acoustic pressure waves can develop into shock waves in the more extreme cases and that reflection at the seabed can lead to large pressures at the toe of a structure which can propagate back to the impact zone after reflection. Semi-analytical solutions for the linear propagation and reflection of pressure waves in relation to violent wave impacts on vertical walls have been presented by Cooker (Reference Cooker2002) and Korobkin (Reference Korobkin2006). Recent computations by Plumerault, Astruc & Maron (Reference Plumerault, Astruc and Maron2012) indicate that if the reflected pressure waves are in phase with the oscillation of the air pocket, pressures higher than those caused by the initial impact may occur due to resonance.
Entrained air is usually associated with a reduction in impact pressure due to the cushioning effect of the air. In principle, this could be taken into account by use of a scale-dependent pressure reduction factor such as that described by Bullock et al. (Reference Bullock, Crawford, Hewson, Walkden and Bird2001). Conversely, the existence of a trapped air pocket may lead to an increase in the pressure impulse exerted at the wall, as shown by Wood, Peregrine & Bruce (Reference Wood, Peregrine and Bruce2000). This latter effect is also likely to be scale dependent, although there are no previous studies on how this might be accounted for.
The design of coastal structures is often based, at least in part, on small-scale physical model tests conducted in freshwater, designed according to the Froude law which preserves the ratio of the water’s inertial to gravitational forces. This model law implies that the pressures scale with the length scale ratio between model and prototype. If the impact pressures are generated by a breaking wave that in the field, even if not in the model, would be associated with appreciable quantities of entrained and/or trapped air, Froude scaling can lead to erroneous results.
The present paper aims to provide a better understanding of the effects of scale and entrained air on violent impact pressures, forces and impulses mainly by means of a detailed numerical investigation built upon fundamental physical principles. It is part of a combined field, laboratory and numerical study into Breaking Wave Impacts on Steep-fronted COastal STructures (BWIMCOST). The field measurements were taken at Admiralty Breakwater on Alderney in the Channel Islands, see Bullock et al. (Reference Bullock, Obhrai, Müller, Wolters, Peregrine and Bredmose2003). Most of the extensive laboratory test programme was conducted in the ‘Grosser Wellen Kanal’ (GWK or Large Wave Channel) in Hanover, Germany, using a vertical or sloping wall mounted on a 1:4 scale model of the mound of Admiralty Breakwater. The results of the regular wave tests have been presented in Bullock et al. (Reference Bullock, Obhrai, Peregrine and Bredmose2007), which is paper 1 of the present series. Paper 2 by Bredmose et al. (Reference Bredmose, Peregrine and Bullock2009) details the formulation of a numerical model for aerated flows and its application to wave impacts with entrained and trapped air.
In the present paper, the numerical model is applied to wave impacts over a range of different geometric scales and levels of ambient aeration. This permits a clear identification of the fluid dynamical processes and will potentially enable better account to be taken of aeration and scale in engineering design. The paper is structured as follows. First, a review of existing work on scale and aeration effects for violent wave impacts is given in § 2. Next, in § 3, a generalisation of the Bagnold–Mitsuyasu scaling law is derived. Section 4 presents the method and scope of the computations, while in § 5, pressure, force and impulse for a flip-through, a low-aeration and a high-aeration impact are described and the maximum impact pressures are compared with the Bagnold–Mitsuyasu scaling law. Results for different initial levels of aeration are described in § 6 and then compared with the approximate solution of Peregrine & Thais (Reference Peregrine and Thais1996). A summary and discussion are given in § 7.
2. Review of the effect from scale and aeration
Froude scaling is the most commonly applied model law for scaled experiments with gravity waves and is based on the assumption that the influence from viscosity, surface tension and air can be neglected. For a length scale ratio of
 $S$
between prototype and model, it implies that velocity and time scale like
 $S^{1/2}$
, while pressures scale like
 ${\it\rho}_{w,proto}/{\it\rho}_{w,model}S$
. Here,
 ${\it\rho}_{w}$
is the density of unaerated water.
The presence of trapped and entrained air makes the Froude scaling law questionable for violent wave impacts. The violent impact pressures are influenced by (i) the scale effect associated with the change of dynamic fluid pressure relative to the atmospheric pressure and (ii) the aeration due to wave breaking and previous wave impacts which introduces compressibility effects. A review of the existing literature on these two effects is given below. In many cases, the two influences cannot easily be separated, as, for example, the level of aeration often increases with the scale. Throughout the paper
 $p$
denotes absolute pressure and
 $p_{0}$
atmospheric pressure, such that
 $p-p_{0}$
is the gauge pressure.
2.1. Scale effects
Blackmore & Hewson (Reference Blackmore and Hewson1984) obtained field data from Ilfracombe sea wall, UK, and studied the relation between the maximum wave-impact pressure
 $(p_{max}-p_{0})$
and the rise time,
 $(t_{r})$
, from the background pressure up to maximum pressure. They found empirically that a curve of the form
 $p_{max}-p_{0}=k/t_{r}$
provided a good fit to the upper envelope of the measured peak pressures,
 $k$
being a dimensional constant. Further, analysis of six sets of field data and three sets of laboratory data led to a suggested formula for the peak pressures,
 $p_{max}-p_{0}={\it\lambda}{\it\rho}_{w}Tc_{b}^{2}$
, where
 $(T,c_{b})$
are the period and phase speed of the impacting wave and
 ${\it\lambda}$
is a parameter with units of
 $\text{s}^{-1}$
. Although the pressures for each data set showed considerable scatter, values for
 ${\it\lambda}$
between 1.0 and 10 at model scale and between 0.1 and 0.5 for field data were suggested. Based on the two upper limits and Froude scaled wave motion at a scale ratio of 1:20, this relation implies a pressure ratio of
 $(p_{max,proto}-p_{0})/(p_{max,model}-p_{0})\approx 20^{1/2}\approx 4.5$
which is well below the Froude law value of 20.
Lugni et al. (Reference Lugni, Miozzi, Brocchini and Faltinsen2010b
) studied a wave impact with an enclosed air cavity in a 2D sloshing test. Their measured time histories of pressure in the air pocket showed the characteristic oscillation associated with cyclic compression and decompression of the air pocket. The experiments were carried out in a closed tank which allowed the air pressure in the initial situation of calm water, the ullage pressure, to be varied. The air pocket evolution was studied in terms of the Euler number and cavitation number, which in our notation are
 $\mathit{Eu}=2(p_{0}-p_{ullage})/({\it\rho}_{w}u_{0}^{2})$
,
 $\mathit{Ka}=2(p_{ullage}-p_{v})/({\it\rho}_{w}u_{0}^{2})$
, where
 $p_{v}$
is the vapour pressure. The compressibility of the air pocket was quantified in terms of the ratio of pocket area at its most compressed and expanded states, which was found to increase with the Euler number and to decrease with the cavitation number. For
 $\mathit{Eu}\in [0;30]$
the growth was quasilinear, then for
 $\mathit{Eu}\in [28;38]$
a plateau regime was identified where the pocket compression varied little with
 $\mathit{Eu}$
. For
 $\mathit{Eu}>40$
, where
 $\mathit{Ka}<4$
the compression ratio grew strongly again, due to cavitation during the pocket expansion. The observation of increased pocket compression at increased Euler number is in agreement with the numerical results of Peregrine et al. (Reference Peregrine, Bredmose, Bullock, Hunt, Obhrai and Smith2006). Further, it was found that the frequency of the pocket oscillations decreased with the Euler number. A detailed study of the dynamic pressure in the cavity and surrounding fluid was provided in a separate paper (Lugni, Brocchini & Faltinsen Reference Lugni, Brocchini and Faltinsen2010a
). Analytical formulae for the pocket frequency have been published by Abrahamsen & Faltinsen (Reference Abrahamsen and Faltinsen2012), where it was found that the position of the free surface affects the oscillations strongly. The decay and damping of the pocket oscillations have been investigated by Abrahamsen & Faltinsen (Reference Abrahamsen and Faltinsen2011), who found that air escape causes an initial decay in the pocket oscillations. Additionally, pockets that closed against a wall showed a damping, and here it was found that heat exchange to the surrounding water can explain this damping.
Many authors have worked with the 1D piston analogy of Bagnold (Reference Bagnold1939) for wave impacts that trap a pocket of air. In this model a mass of water is released at a velocity
 $u_{0}$
and compresses a volume of air that is initially at atmospheric pressure
 $p_{0}$
. The effect of gravity is neglected such that the only force to decelerate the piston is due to the pressure difference between the air pocket and the ambient air. Bagnold calculated time series of pressure at two scales from the model and found that for maximum pressures in the range of 2–10 atmospheres, the
 $p_{max}$
were given to within
 $\pm 10\,\%$
by
 $p_{max}-p_{0}=2.7{\it\rho}_{w}u_{0}^{2}K/D$
, where
 $K$
and
 $D$
are the initial lengths of the impacting water and the trapped air pocket and
 $p_{0}$
is the atmospheric pressure. If the parameters
 $u_{0},K$
and
 $D$
are scaled using the Froude model law, the above relationship implies that
 $p_{max}-p_{0}$
scales in proportion to the length scale. Mitsuyasu (Reference Mitsuyasu1966) extended the Bagnold model to cover air leakage from the pocket during compression and, for the case of no leakage, also derived an expression for
 $p_{max}$
. Lundgren (Reference Lundgren1969) discussed the scaling implication of this result and presented a scaling curve with
 $p_{max}$
as function of a dimensionless wave height. However, application of these results to real wave impacts is not straightforward due to the need to convert the parameters of the wave into the
 $K$
,
 $D$
and
 $u_{0}$
. Takahashi, Tanimoto & Miyanaga (Reference Takahashi, Tanimoto and Miyanaga1985) applied the model to slamming beneath bridge decks, where air can be trapped, and noted that the maximum pressure is a function of the dimensionless group
 $\mathit{BgN}={\it\rho}_{w}Ku_{0}^{2}/(p_{0}D)$
. He called this group the ‘Bagnold number’.
Bredmose & Bullock (Reference Bredmose and Bullock2008) (see also Bullock & Bredmose Reference Bullock and Bredmose2010) extended the derivation of the Bagnold–Mitsuyasu model to 2D and 3D axisymmetric air pockets and demonstrated that the resulting pressure laws were identical to the 1D case. They were also able to show that the Bagnold number is directly proportional to the length scale in cases where the hydrodynamics is Froude scalable. This means that precise values of
 $K$
,
 $D$
and
 $u_{0}$
are not needed for application of the scaling law. Bredmose & Bullock (Reference Bredmose and Bullock2008) next compared some early numerical results for scaled wave impacts with their proposed scaling curve and found an encouraging level of agreement. Recently, Cuomo, Shimosako & Takahashi (Reference Cuomo, Shimosako and Takahashi2009) have applied the pressure model of Takahashi et al. (Reference Takahashi, Tanimoto and Miyanaga1985) to the analysis of the pressures due to ventilated wave impacts on the underside of decks. Cuomo, Allsop & Takahashi (Reference Cuomo, Allsop and Takahashi2010b
) (see also Cuomo et al.
Reference Cuomo, Allsop, Bruce and Pearson2010a
) have also provided a way of estimating
 $K$
,
 $D$
and
 $u_{0}$
from the wave parameters that allows prediction of prototype pressures with inclusion of air leakage.
More recently, Abrahamsen & Faltinsen (Reference Abrahamsen and Faltinsen2013) derived a second-order ordinary differential equation (ODE) for the dynamics of the pressure in a trapped air pocket of arbitrary shape. The model has two free parameters that for a measured pressure history can be fitted to match the maximum pressure and rise time. Next, the model can be scaled to prototype and solved to yield the maximum pressure and rise time at full scale. Abrahamsen & Faltinsen applied the scaling procedure to a problem of air pocket compression in the upper corner of a sloshing tank and obtained a close match to the results of a mixed Eulerian Lagrangian numerical model.
Research into the scaling effects of liquid-impact pressures has also been the focus of the Sloshel project on the sloshing problem for LNG tankers (e.g. Brosset et al. Reference Brosset, Mravak, Kaminski, Collins and Finnigan2009). In this project Braeunig et al. (Reference Braeunig, Braeunig, Brosset, Dias and Ghidaglia2009) found that for an impact to scale consistently, not only must the flow prior to impact be Froude scalable, but also the density ratio and sound speed ratio of the liquid and the ambient gas must be preserved. Bogaert et al. (Reference Bogaert, Kaminski, Léonard and Brosset2010) compared Froude scaled experiments for freshwater wave impacts at two scales and found a good agreement with a surrogate piston model for the scaling of pressures. However, they noted that use of the results of Kimmoun, Ratouis & Brosset (Reference Kimmoun, Ratouis and Brosset2010) from two smaller scales would have led to a different scaling relation. This confirms the difference of scaling implied by the Bagnold–Mitsuyasu law. Recently, Lafeber, Bogaert & Brosset (Reference Lafeber, Bogaert and Brosset2012) compared carefully Froude scaled wave flume impacts at two scales and found a good match to the Bagnold–Mitsuyasu scaling law.
2.2. Aeration effects
Deane & Stokes (Reference Deane and Stokes2002) investigated bubble formation processes in a laboratory wave channel filled with seawater and found that two mechanisms controlled the distribution of bubble sizes within the plume formed by plunging breakers approximately 0.1 m high. Bubbles larger than 2 mm in diameter were created as the air pocket trapped below the crest fragmented. Smaller bubbles, down to at least 0.2 mm, were mainly formed when the overturning crest plunged into the water in front of the wave. Analysis of bubble size spectra suggested that bubbles of less than 2 mm in diameter were unlikely to break up. The distributions of bubble size within spilling breakers in the field were found to have similar spectra despite the difference in geometrical scale. This implies that, even if seawater were to be used in a small-scale physical model, bubble fragmentation would not scale because the Weber number, that is, the ratio of the fluid inertia forces and surface tension forces, would be different.
A number of factors have been identified that may cause bubbles to be smaller in saltwater and seawater than in freshwater (Scott Reference Scott1975; Slauenwhite & Johnson Reference Slauenwhite and Johnson1999). Because small bubbles rise up to the surface at a slower speed than large bubbles, this enables entrained air to persist for longer in seawater than in freshwater. Bullock et al. (Reference Bullock, Crawford, Hewson, Walkden and Bird2001) conducted laboratory tests of wave impacts on a vertical wall in freshwater and seawater and detected significantly higher aeration levels in seawater than in freshwater. This contrasts with the results of Blenkinsopp & Chaplin (Reference Blenkinsopp and Chaplin2007b , Reference Blenkinsopp and Chaplin2011), who found the bubble plumes to be very similar when they studied plunging breakers up to 0.1 m high in a laboratory wave channel filled with freshwater, artificial seawater and natural seawater. As noted by Blenkinsopp & Chaplin (Reference Blenkinsopp and Chaplin2011), the difference may be due to the almost double wave height of Bullock et al. relative to Blenkinsopp & Chaplin, which may have increased the air entrainment for each wave and thus led to a stronger accumulation of small air bubbles in the saltwater over time.
An increase in scale implies an increase in aeration level, due to the fact that the distance an entrained air bubble needs to travel to escape from the water increases directly with the length scale, while the wave period scales with the square root of the length scale. This effect was examined by Blenkinsopp & Chaplin (Reference Blenkinsopp and Chaplin2007b ) for the evolution of their measured plumes by means of a Lagrangian simulation model that tracked the development of each individual bubble under the influence of turbulent diffusion, bubble dissolution, buoyancy and hydrostatic bubble expansion. This indicated that, at 20 times the physical model scale, a significant number of bubbles could persist for several wave periods, leading to an appreciable ambient level of aeration.
The effect of entrained air on impact pressures was investigated by Bullock et al. (Reference Bullock, Crawford, Hewson, Walkden and Bird2001), who conducted comparative laboratory drop tests in freshwater and seawater with controlled aeration. While for the drop tests, the freshwater pressures were only slightly larger than for saltwater, the regular wave tests showed a significant reduction in impact pressures of approximately 10 % associated with saltwater. This was attributed to the difference in average aeration level, which for the freshwater tests was measured to be 0.2 % while the seawater value was 3.1 %. Bullock et al. further presented field data from the Admiralty Breakwater which showed that aeration levels of 40 % (at atmospheric pressure) were not uncommon at the time of maximum pressure in the measured violent wave impacts.
The cushioning effect of entrained air on a flip-through wave impact (Cooker & Peregrine Reference Cooker and Peregrine1990) was investigated by Peregrine & Thais (Reference Peregrine and Thais1996). Their model was the compressible extension of the work of Peregrine & Kalliadasis (Reference Peregrine and Kalliadasis1996) for the ‘filling flow’ of a liquid container. Given (in our notation) the inflow speed
 $v_{0}$
, the ambient pressure
 $p_{0}$
, the initial aeration at the inflow
 ${\it\beta}_{0}$
, the container height
 ${\hat{H}}$
and the inflow height
 ${\hat{h}}$
, the model provides a solution for the maximum pressure
 $p_{max}$
and all other parameters of the flow. Peregrine & Thais (Reference Peregrine and Thais1996) also presented an approximate solution valid for small values of
 ${\it\varepsilon}=1-{\hat{h}}/{\hat{H}}$
and air fraction
 ${\it\beta}_{0}$
. For
 $p_{max}$
this reads
 $$\begin{eqnarray}\frac{p_{max}-p_{0}}{\frac{1}{2}{\it\rho}_{w}v_{0}^{2}}=\frac{1}{({\it\varepsilon}+{\it\beta}_{0})^{2}},\end{eqnarray}$$
which illustrates how the entrained air acts to reduce the impact pressures. The parameter
 ${\it\varepsilon}$
is a measure of the impact violence. The smaller the value, the greater the violence.
3. Scaling analysis for aerated wave impacts
3.1. Dimensional analysis
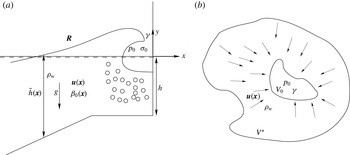
We consider the situation sketched in figure 1(a), where a free-surface gravity wave is about to break against a vertical wall, at a fixed instant of time
 $t_{0}$
prior to impact. A Cartesian coordinate system
 $(x,y)$
is defined, where
 $x$
is the horizontal coordinate, positive in the direction of wave propagation with origin at the wall, and the
 $y$
-axis points upwards from the still water level. It should be noted that although the analysis is carried out for two-dimensional waves, the results are valid in three dimensions. The density of unaerated water is denoted by
 ${\it\rho}_{w}$
, the gravitational acceleration by
 $g$
and the position of the free surface by the vector curve
 $(x,y)_{free\,surface}=\boldsymbol{R}({\it\xi})$
, where
 ${\it\xi}$
is a parameter specifying the surface. The still water depth is denoted
 $\tilde{h}(x)$
, the internal velocity field is
 $\boldsymbol{u}(\boldsymbol{x})=(u(x,y),v(x,y))$
and the fluid is considered to be a mixture of unaerated incompressible water and compressible air with local air volume fraction
 ${\it\beta}=\text{Vol}_{air}/\text{Vol}_{mixture}$
. The corresponding air volume fraction at atmospheric pressure is denoted by
 ${\it\beta}_{0}(\boldsymbol{x})$
. The compression of air is assumed to happen adiabatically such that
 $p_{air}=p_{0}({\it\sigma}/{\it\sigma}_{0})^{{\it\gamma}}$
, where
 $p_{0}$
is the atmospheric pressure,
 ${\it\sigma}_{0}$
is the air density at atmospheric pressure,
 ${\it\sigma}$
is the instantaneous air density and
 ${\it\gamma}=1.4$
is the exponent of adiabatic compression. As a first approximation, and well in accordance with most wave theories, the effects of viscosity and surface tension will be neglected. This makes the maximum wall pressure in the subsequent wave impact
 $p_{max}$
a function of all of the above parameters
 ${\it\rho}_{w},g,\tilde{h}(x),\boldsymbol{R},\boldsymbol{u}(\boldsymbol{x}),{\it\beta}_{0}(\boldsymbol{x}),p_{0},{\it\sigma}_{0},{\it\gamma}$
. Normalisation with
 ${\it\rho}_{w}$
,
 $g$
and the still water depth at the foot of the wall,
 $h$
, gives
 $$\begin{eqnarray}\frac{p_{max}-p_{0}}{{\it\rho}_{w}gh}=f\left(\frac{\tilde{h}(x)}{h},\frac{\boldsymbol{R}}{h},\frac{\boldsymbol{u}(\boldsymbol{x})}{\sqrt{gh}},{\it\beta}_{0}(\boldsymbol{x}),\frac{p_{0}}{{\it\rho}_{w}gh},\frac{{\it\sigma}_{0}}{{\it\rho}_{w}},{\it\gamma}\right),\end{eqnarray}$$
where
 $(p_{max}-p_{0})/({\it\rho}_{w}gh)$
is the normalised maximum wave-impact pressure.
(a) Approach of a gravity wave towards impact at a wall. (b) An air pocket of arbitrary shape prior to compression by an incompressible fluid.

We now consider a situation where a specific wave impact is scaled to a new length scale, as would be the goal of a model scale experiment. While the two first parameters on the right of (3.1) are invariant to a change of length scale, the third is scale-independent only if the velocity field
 $\boldsymbol{u}$
scales as the square root of the length scale, which defines Froude scaling of the flow. Hence, in the case of Froude scaled flow and no air, so that the other four dimensionless factors do not feature in
 $f$
, we deduce that
 $f$
is a constant and the impact pressures scale directly with the density and the length scale.
For an impact process in which air plays a significant role, it is necessary to consider all of the parameters of the functional dependence in (3.1). The parameters
 ${\it\sigma}_{0}/{\it\rho}_{w}$
and
 ${\it\gamma}$
, however, are scale-independent. Hence, for the case of Froude scaled initial flow (3.1) can be written
 $$\begin{eqnarray}\frac{p_{max}-p_{0}}{p_{0}}=f\!\left({\it\beta}_{0}(\boldsymbol{x}),\frac{{\it\rho}_{w}u_{0}^{2}}{p_{0}}\right),\end{eqnarray}$$
where
 $u_{0}$
is a reference velocity picked from
 $\boldsymbol{u}(\boldsymbol{x})$
and the invariance of
 $u_{0}/({\it\rho}_{w}gh)$
under Froude scaling has been utilised. From this result, the normalised maximum gauge pressure
 $(p_{max}-p_{0})/p_{0}$
for a specific Froude scaled wave impact is a function of the initial aeration and the ratio of dynamic pressure to the atmospheric pressure
 $({\it\rho}_{w}u_{0}^{2})/p_{0}$
. The latter parameter is seen to scale directly with the length scale and may therefore, for a specific wave impact, be represented directly by a measure of the length scale. This forms the basis for the parametric investigations of §§ 5–6, and the aim of the paper is to explore the form of
 $f$
.
3.2. Generalisation of the Bagnold–Mitsuyasu scaling law
Bredmose & Bullock (Reference Bredmose and Bullock2008) showed that the Bagnold–Mitsuyasu scaling law can be generalised to include also the 2D and 3D axisymmetric cases. Here, we show that the scaling law is even more general, as it applies to any situation in which all the kinetic energy within a certain fluid region goes into the compression of an air pocket. We note that this assumption may be questionable for a wave impact since kinetic energy is also used to accelerate the fluid away from the impact zone and as the balance between the relative amounts of work for compression and acceleration may not be invariant to scale. We further note that the recent scaling procedure of Abrahamsen & Faltinsen (Reference Abrahamsen and Faltinsen2013), which is also valid for pockets of arbitrary shape, also allows for the scaling of rise time. The scaling procedure proposed here is more simplistic as it only concerns the maximum pressure. Apart from the generalisation of the Bagnold–Mitsuyasu scaling law’s applicability, one of the aims of the present study is therefore to investigate its validity for wave impacts by the computations of § 5.
Consider the liquid region of volume
 $V^{\ast }$
in figure 1(b) which encloses an air pocket of volume
 $V_{0}$
that is initially at atmospheric pressure. If the liquid has density
 ${\it\rho}_{w}$
and the velocity field
 $\boldsymbol{u}$
, its kinetic energy is
 $$\begin{eqnarray}E_{kin}=\frac{1}{2}\int _{V^{\ast }}{\it\rho}_{w}\boldsymbol{u}\boldsymbol{\cdot }\boldsymbol{u}\text{d}V.\end{eqnarray}$$
The air is assumed to obey the adiabatic compression law
 $$\begin{eqnarray}\frac{p}{p_{0}}=\left(\frac{{\it\sigma}}{{\it\sigma}_{0}}\right)^{{\it\gamma}}=\left(\frac{V_{0}}{V}\right)^{{\it\gamma}},\end{eqnarray}$$
where
 $V$
is the instantaneous volume of the pocket. The work needed to compress the air to the pressure
 $p_{max}$
is
 $$\begin{eqnarray}W=\int _{p=p_{0}}^{p_{max}}(p-p_{0})\text{d}V,\end{eqnarray}$$
and from (3.4) we have
 $$\begin{eqnarray}V=V_{0}\left(\frac{p}{p_{0}}\right)^{-1/{\it\gamma}},\quad \text{d}V=-\frac{1}{{\it\gamma}}\frac{V_{0}}{p_{0}}\left(\frac{p}{p_{0}}\right)^{-({\it\gamma}+1)/{\it\gamma}}\text{d}p.\end{eqnarray}$$
We may now express the assumption that all the kinetic energy goes into compression of the air by equating (3.3) to the result of (3.5) after integration,
 $$\begin{eqnarray}W=-\frac{p_{0}V_{0}}{{\it\gamma}-1}\left[\left(\frac{p_{max}}{p_{0}}\right)^{({\it\gamma}-1)/{\it\gamma}}+({\it\gamma}-1)\left(\frac{p_{max}}{p_{0}}\right)^{-1/{\it\gamma}}-{\it\gamma}\right]=\frac{1}{2}\int _{V^{\ast }}{\it\rho}_{w}\boldsymbol{u}\boldsymbol{\cdot }\boldsymbol{u}\text{d}V.\end{eqnarray}$$
Upon definition of
 $$\begin{eqnarray}\displaystyle & \displaystyle \mathscr{P}=\frac{p_{max}-p_{0}}{p_{0}}, & \displaystyle\end{eqnarray}$$
 $$\begin{eqnarray}\displaystyle & \displaystyle \mathscr{F}(\mathscr{P})=\left(\mathscr{P}+1\right)^{({\it\gamma}-1)/{\it\gamma}}+({\it\gamma}-1)\left(\mathscr{P}+1\right)^{-1/{\it\gamma}}-{\it\gamma}, & \displaystyle\end{eqnarray}$$
 $$\begin{eqnarray}\displaystyle & \displaystyle C=-\frac{{\it\gamma}-1}{V_{0}}\frac{1}{2}\int _{V^{\ast }}\frac{\boldsymbol{u}\boldsymbol{\cdot }\boldsymbol{u}}{u_{0}^{2}}\text{d}V, & \displaystyle\end{eqnarray}$$
 $$\begin{eqnarray}\mathscr{F}(\mathscr{P})=C\frac{{\it\rho}_{w}u_{0}^{2}}{p_{0}},\end{eqnarray}$$
where
 $C$
is a scale-independent constant. If the inverse of
 $\mathscr{F}$
is applied on both sides of this equation, one obtains
 $\mathscr{P}=\mathscr{F}^{-1}(C{\it\rho}_{w}u_{0}^{2}/p_{0})$
, which is of the form postulated by (3.2), when the effects of entrained air are neglected.
For a given topography and velocity field,
 $C$
can be evaluated and (3.11) solved for
 $p_{max}$
. Even without knowledge of the velocity field and topography, however, a scaling law can be derived by evaluation of (3.11) at two different scales under the assumption that the velocity fields are Froude scalable. Denoting the scales by ‘1’ and ‘
 $S$
’ one obtains
 $$\begin{eqnarray}\mathscr{F}\left(\mathscr{P}^{[1]}\right)=C\frac{{\it\rho}_{w}u_{0}^{[1]\,2}}{p_{0}},\quad \mathscr{F}\left(\mathscr{P}^{[S]}\right)=C\frac{{\it\rho}_{w}u_{0}^{[S]\,2}}{p_{0}}=C\frac{{\it\rho}_{w}u_{0}^{[1]\,2}S}{p_{0}},\end{eqnarray}$$
where under Froude scaling
 $u_{0}^{[S]}=\sqrt{S}u_{0}^{[1]}$
. Thus, we deduce
 $$\begin{eqnarray}\mathscr{P}^{[S]}=\mathscr{F}^{-1}\left(S\mathscr{F}(\mathscr{P}^{[1]})\right).\end{eqnarray}$$
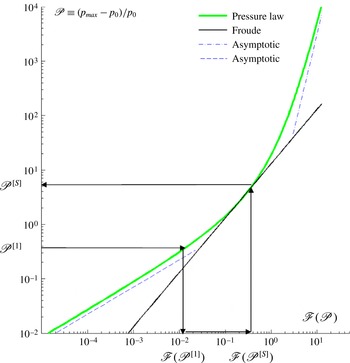
The implication of the scaling relation is illustrated in figure 2 where
 $\mathscr{P}$
is plotted against
 $\mathscr{F}(\mathscr{P})$
. For a given pressure
 $\mathscr{P}^{[1]}$
, the scaled pressure
 $\mathscr{P}^{[S]}$
can be obtained graphically by reading off
 $\mathscr{F}(\mathscr{P}^{[1]})$
on the horizontal axis, multiplying it by
 $S$
to obtain
 $\mathscr{F}(\mathscr{P}^{[S]})=S\,\mathscr{F}(\mathscr{P}^{[1]})$
and subsequently reading off the corresponding value for
 $\mathscr{P}^{[S]}$
on the vertical axis. It should be noted that no knowledge of wave shape or physical geometry is needed for its application. Furthermore, as no assumption for the shape of the cavity has to be made, it is valid for 2D and 3D pockets of arbitrary shape. As long as uniform pressure can be assumed, the scaling law is even valid for the case where the air pocket is subdivided into a number of smaller pockets.
Scaling curve for the Bagnold–Mitsuyasu scaling law. The arrows demonstrate the scaling procedure which is based solely on the measured pressure at one scale.

To aid the interpretation of the scaling curve, a solid line with slope unity has been added to figure 2. This slope corresponds to Froude scaling of the pressure and is tangent to the curve at
 $\mathscr{P}=3.18$
. This value was found by solving the equation
 $\text{d}\log \mathscr{P}/\text{d}\log \mathscr{F}=1$
and corresponds to a gauge pressure of
 $3.18\,p_{0}=318~\text{kPa}$
. Further, the asymptotic limits
 $$\begin{eqnarray}\displaystyle \mathscr{P}\sim S^{1/2},\quad \mathscr{P}\ll 1, & & \displaystyle\end{eqnarray}$$
 $$\begin{eqnarray}\displaystyle \mathscr{P}\sim S^{7/2},\quad \mathscr{P}\gg 1 & & \displaystyle\end{eqnarray}$$
Because the scaling factor for pressure from one scale to another is determined by the slope of the chord passing through
 $(\mathscr{F}^{[1]},\mathscr{P}^{[1]})$
and
 $(\mathscr{F}^{[S]},\mathscr{P}^{[S]})$
on the curve, figure 2 indicates that the following three types of situation can arise.
-
(a)
 $P^{[1]}<3.18$
and
$P^{[S]}<3.18$
. Here, the relatively gentle chord slope implies that the use of Froude scaling would lead to an overestimation of the prototype pressure by comparison with the Bagnold–Mitsuyasu law. This is consistent with the widespread belief among practising engineers that Froude scaling of laboratory wave-impact pressures often leads to unrealistically high predicted pressures. The numerical results of § 5, however, demonstrate that the Bagnold–Mitsuyasu law is not relevant in this situation.
-
(b)
$P^{[1]}<3.18$
and
$P^{[S]}>3.18$
. In this intermediate situation, the slope of the chord, and hence the implications by comparison with Froude scaling, will depend on the particular circumstances. -
(c)
$P^{[1]}>3.18$
and
$P^{[S]}>3.18$
. Here, the steeper chord slope implies that the use of Froude scaling can lead to a serious underestimation of the prototype pressure by comparison with the Bagnold–Mitsuyasu law. Little consideration is given to this possibility in engineering design. Although pressures at model scale are often below 318 kPa, many waves in the study of Bullock et al. (Reference Bullock, Obhrai, Peregrine and Bredmose2007) generated pressures in excess of this value, a few even exceeding 1 MPa. For such a 1 MPa pressure, measured at scale 1:4, the Bagnold–Mitsuyasu law would suggest a prototype scale pressure of 13 MPa, which is more than three times larger than the Froude scaled value of 4 MPa.


4. Numerical computation of violent wave impacts
4.1. Numerical set-up
The numerical set-up is identical to that of Bredmose et al. (Reference Bredmose, Peregrine and Bullock2009) apart from a slightly larger vertical extent of the compressible-flow domain and a modification of its offshore boundary condition which is detailed below. A vertical wall is placed at
 $x=0~\text{m}$
on top of a 3 m high, 18 m long semi-elliptical mound. At the offshore depth of 4.25 m, a unidirectional wave group is used as initial condition, formed by modulation of a 50 m long regular stream function theory wave (Fenton Reference Fenton1988).
Because aeration effects are relatively unimportant away from the wall and prior to impact, the nonlinear wave propagation and transformation over the mound was calculated by an incompressible potential-flow solver (Dold & Peregrine Reference Dold, Peregrine, Morton and Baines1986; Tanaka et al. Reference Tanaka, Dold, Lewy and Peregrine1987; Cooker et al. Reference Cooker, Vidal, Dold and Peregrine1990; Dold Reference Dold1992). To account for the effects of trapped and entrained air, the final propagation to the wall and the subsequent impact were computed using a compressible-flow model for aerated water. The model is a two-phase finite-volume solver for the conservation equations of density, horizontal and vertical momentum, air density and energy density. The model and its numerical implementation in the finite-volume framework Clawpack (LeVeque Reference LeVeque2002) are described in detail in Bredmose et al. (Reference Bredmose, Peregrine and Bullock2009). Here, the convergence properties and model limitations in terms of creation of spurious pressure oscillations in front of transmitted shock waves that propagate from air into water are further discussed. The latter effect is caused by numerical smearing of the air–water interface and requires a sufficiently refined numerical grid to be kept under control.
The initial condition for the computation was taken from the incompressible-flow solution when the wavefront was approximately 0.5 m from the wall. Moreover, the offshore boundary condition was taken from the incompressible-flow solution. In Bredmose et al. (Reference Bredmose, Peregrine and Bullock2009), however, this could for some impacts lead to propagation of spurious pressure waves from the offshore boundary. These waves were caused by the instantaneous propagation of the impact pressure in the incompressible-flow solution, which led to large pressures at the offshore boundary which would next be imposed on the compressible flow. To overcome this, a pragmatic approach was utilised in the present study, where the smallest of the incompressible-flow pressure and the pressure in the first inner point of the compressible-flow domain was applied at the offshore boundary. This method was found to reduce the propagation of spurious pressure waves significantly with little change of other flow aspects.
The compressible-flow model has been validated successfully against a one-dimensional piston test for compression of an air pocket and the fully nonlinear potential-flow solution for a flip-through impact in Bredmose et al. (Reference Bredmose, Peregrine and Bullock2009). The extraordinary variability found in physical tests makes the case-specific pressure records obtained for violent wave impacts unsuitable for detailed comparison. In controlled laboratory tests using regular waves, not only do the measured pressures vary greatly from wave to wave, causing Hattori et al. (Reference Hattori, Arami and Yui1994) to describe wave breaking as an extremely unstable phenomenon, but Bullock et al. (Reference Bullock, Obhrai, Peregrine and Bredmose2007) measured pressures an order of magnitude different in the same wave at locations at an identical elevation just 1 m apart. Similar behaviour has also been recorded using highly repeatable focused wave groups (Peregrine et al. Reference Peregrine, Bredmose, Bullock, Hunt, Obhrai and Smith2006). Reproduction of the fine detail of breaker shape that leads to such variability in physical models is outside the scope of the present investigation and may well be impossible using a 2D simulation. However, the numerical model has already been shown to reproduce a strong sensitivity to wave shape in line with the overall trends found in experiments (Bredmose et al. Reference Bredmose, Peregrine and Bullock2009). A direct comparison with a small-scale high-aeration impact has also been presented in Jayaratne et al. (Reference Jayaratne, Hunt-Raby, Bullock and Bredmose2008). Despite observable three dimensionality and notable differences in the final shape of the air pocket, the model showed a generally good agreement with the measured pressures including the oscillation in the trapped air. It should be noted that this test was made with a preliminary version of the model that utilised an explicit equation of state rather than conservation of energy. As demonstrated by Bredmose et al. (Reference Bredmose, Peregrine and Bullock2009), the two formulations are mathematically identical for flows without shock waves, as was the case for the reproduced experiment. In this paper, the updated model was further shown to be able to reproduce the oscillatory and subatmospheric pressures in trapped air pockets and the compression of aerated water by the impact pressures, further to the strong sensitivity of the impact pressures to the wave shape. Consequently, there is good reason to suppose that the model is capable of correctly identifying the overall influences of both scale and the level of entrained air, which are the objectives of the present paper.
4.2. Three impact types
Numerical results for eight different wave impacts at one scale and water with an initial aeration of 5 % were presented in Bredmose et al. (Reference Bredmose, Peregrine and Bullock2009). Three of these, which are respectively typical of a flip-through impact, a low-aeration impact and a high-aeration impact, have been selected as the basis for the present study.
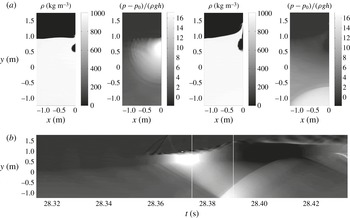
A flip-through impact is characterised by a rapid focusing of surface points in the wave trough and crest just as the breaker reaches the wall. This leads to the formation of a jet of water up the wall, which prevents any air from being trapped between the wave and the wall. Lugni, Brocchini & Faltinsen (Reference Lugni, Brocchini and Faltinsen2006) measured vertical accelerations up to 1500g for a flip-through impact in a sloshing tank, while Cooker & Peregrine (Reference Cooker, Peregrine, Banner and Grimshaw1991) reported numerical flip-through accelerations in excess of 10 000g. A combined experimental and numerical study for a flip-through impact on an idealised coastal structure has been presented by Bredmose et al. (Reference Bredmose, Hunt-Raby, Jayaratne and Bullock2010). In a low-aeration impact, the wave crest turns over slightly and traps a small pocket of air. This type of event is often associated with the highest impact pressures. A high-aeration impact is characterised by significant overturning prior to impact, leading to the entrapment of a much larger pocket of air. Detailed results for the flip-through and low-aeration impacts may be found in Bredmose et al. (Reference Bredmose, Peregrine and Bullock2009). Similar information for the evolution of the high-aeration impact is presented here in figure 3.
Density and pressure variation during a high-aeration impact: (a) the density and pressure fields at
 $t=(28.374,28.390)~\text{s}$
; (b) the pressure at the wall in the
 $(t,y)$
-plane with the pressure scale identical to that of (a). The time instants of the snapshots are marked by solid vertical lines in (b).

The snapshots of density and pressure for
 $t=28.374~\text{s}$
show the impact close to the instant of maximum pressure where an air pocket has been trapped and compressed against the wall. The strong impact pressure propagates away from the impact zone and down the wall. Reflection of these waves at the bed leads to the formation of a region of high pressure at the toe of the wall (
 $t=28.390~\text{s}$
). The expansion associated with decompression of the air pocket can be seen in the corresponding density plot and leads to negative (subatmospheric) pressures in the air pocket. Further inspection of the computational results shows how air leakage leads to the formation of an escape flow out of the pocket prior to its closure.
Figure 3(b) gives a compact view of the pressure time history at the wall, in terms of a
 $(t,y)$
-plot of the wall pressure. Visible in the plot are the early stages of impact before pocket closure (
 $t\approx 28.36~\text{s}$
), the pocket closure and continued compression to maximum pressure, the vertical distribution of the impact pressure within the pocket, the propagation of pressure waves down the wall that initiate before the time of maximum impact pressure, the reflection of the pressure wave at the bed, the uprush along the wall that follows the maximum impact pressure (from
 $t\approx 28.38~\text{s}$
) and the expansion of the pocket that leads to a distributed subatmospheric pressure (
 $t=28.40~\text{s}$
). The plot also indicates that two mechanisms can lead to the recurrence of high pressures in the impact zone: (a) the second and subsequent compression phases of the oscillation of the air pocket and (b) the return of reflected pressure waves from the bed.
5. Variation of scale for the three wave impacts
The effect of scale has been investigated for the three wave-impact types by running the compressible-flow model at the scales of
 $(1/16,1/8,1/4,1/2,1,2,4,8,16)$
, where the scale 1 model has identical dimensions to those used by Bredmose et al. (Reference Bredmose, Peregrine and Bullock2009). Thus, this scale corresponds to the scale of the GWK experiments and is approximately
 $1/4$
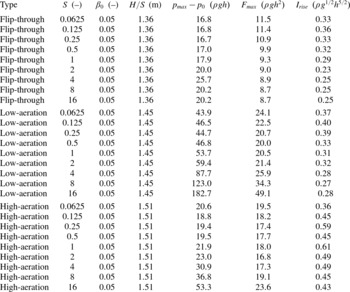
of the size of the breakwater on Alderney. As the initial and boundary conditions for the scale 1 computation were taken from an incompressible potential-flow solution with no aeration effects, initial and boundary data for the other scales could be calculated by simple application of the Froude law. An initial aeration of 5 % was used in all computations. The parameters for the associated 27 computations are listed in table 1 along with the results for maximum gauge pressure
 $p_{max}-p_{0}$
, maximum force per unit width
 $F_{max}$
and rise-time impulse
 $I_{rise}$
, which is defined in § 5.3. All results are normalised with the still water depth at the wall
 $h$
, the gravity
 $g$
and
 ${\it\rho}={\it\beta}_{0}{\it\sigma}_{0}+(1-{\it\beta}_{0}){\it\rho}_{w}$
, which is the density at atmospheric pressure of the air–water mixture with aeration
 ${\it\beta}_{0}$
.
Computational parameters and results for investigation of the scale effect for the three impact types. The results are shown in terms of dimensionless maximum gauge pressure, dimensionless maximum force per unit width and dimensionless impulse over the rise time of the impact force.

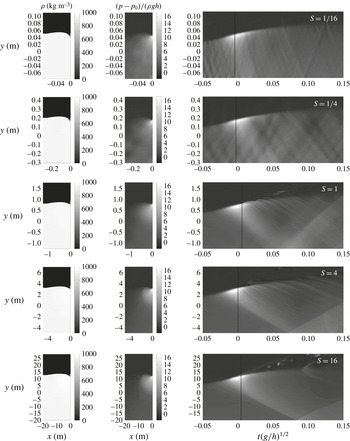
Flip-through impact at varying scale. In each row, the two first frames show snapshots of density and gauge pressure at a time close to the instant of maximum pressure. The right frame shows a contour plot of gauge pressure in the
 $(t,y)$
-plane. The vertical black line marks the time for the snapshots. The gauge pressure is shown in units of
 ${\it\rho}gh$
while the time in the
 $(t,y)$
-plot has been normalised with
 $(h/g)^{1/2}$
. The scale is written in the upper right corner of each row, increasing from top to bottom.

5.1. Temporal variation of pressure and force
Figure 4 shows results for flip-through impacts at five different scales in terms of snapshots of density and pressure close to the time of maximum impact pressure, and
 $(t,y)$
-plots of the wall pressure. The spatial coordinates
 $(x,y)$
are shown in dimensional units to give an impression of size. However, time and gauge pressure are presented in normalised values. Consequently, results that are Froude scalable yield identical plots, while scale effects that differ from Froude scaling can be assessed by cross-comparison between the scales. Generally, the flip-through impacts are characterised by a localised region with a large impact pressure that moves up the wall. At the same time, the impact pressure propagates down the wall in terms of a pressure wave which is subsequently reflected at the seabed. In the Froude scaled variables, the propagation speed of the pressure wave is equal to the slope
 $s$
of the pressure trace in the
 $(t,y)$
-plot. This can be expressed as
 $$\begin{eqnarray}s=\frac{\displaystyle \frac{{\rm\Delta}y}{h}}{{\rm\Delta}t(g/h)^{1/2}}=\frac{{\rm\Delta}y}{{\rm\Delta}t}(gh)^{-1/2}=c(gh)^{-1/2},\end{eqnarray}$$
where
 $c$
is the speed of the pressure wave. From Bredmose et al. (Reference Bredmose, Peregrine and Bullock2009)
 $c=({\it\gamma}p/{\it\beta}{\it\rho})^{1/2}$
, which may for simplicity be evaluated at atmospheric pressure for the initial aeration
 ${\it\beta}_{0}$
and with the approximation
 ${\it\beta}{\it\rho}={\it\beta}({\it\beta}{\it\sigma}_{0}+(1-{\it\beta}){\it\rho}_{w})={\it\beta}{\it\rho}_{w}+O({\it\beta}^{2})$
. This leads to
 $$\begin{eqnarray}s\cong \left(\frac{{\it\gamma}p_{0}}{{\it\rho}_{w}gh^{[1]}}\right)^{1/2}\left({\it\beta}_{0}S\right)^{-1/2},\end{eqnarray}$$
where
 $h^{[1]}$
is the still water depth at the wall at scale 1, and which confirms that the slopes in the figure decrease for increased scale
 $S$
. We note also that the slope
 $s$
is related to the Mach number
 $\mathit{Ma}$
of the aerated water by
 $$\begin{eqnarray}\mathit{Ma}=\frac{u}{c}=s^{-1}\frac{u}{\sqrt{gh}}\sim \left({\it\beta}_{0}S\right)^{1/2},\end{eqnarray}$$
where the last result follows from the invariance of
 $\sqrt{gh}/u$
under Froude scaling.
For the flip-through impact, the
 $(t,y)$
-plots show that the impact pressure increases slightly more with scale than the Froude law would suggest. This can be attributed to the compressibility of the water phase, in the present case resulting from the initial aeration, as the perfectly incompressible solution will have Froude scalable pressures. For increased scale, the front of the pressure wave that moves down the wall becomes increasingly steep. This can be linked to the increase of Mach number with scale. Further, at the smallest scale, the pressure field in the air has increased importance relative to the hydrodynamic pressures and is able to induce several smaller pressure pulses that travel into the water column.
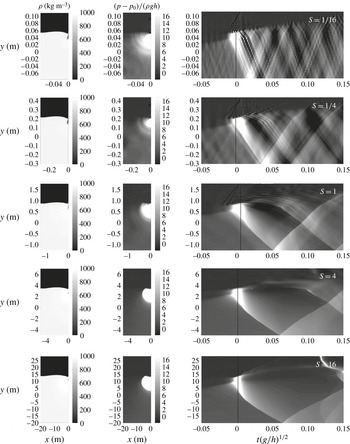
The scale dependence for the low-aeration impact is presented in figure 5. The small trapped air pocket can be seen to distribute the impact pressure over its full extent, which leads to a larger zone of high pressure relative to the flip-through impact. Further, the air pocket becomes increasingly compressed as the scale is increased and the maximum impact pressure becomes much greater than Froude scaling would suggest. At scale 1 and above, the pressure wave that propagates down the wall develops into a shock wave, as can be seen from the
 $(t,y)$
-plots in which the distinct sloping lower edge of the high-pressure region delineates the pressure discontinuity. At scale 16, the dependence of the shock waves propagation speed on pressure also becomes evident, in that the slope of the boundary is largest where the pressure differential is greatest. It is also noticeable at the larger scales that the pocket pressure for the present geometry emerges from the lower edge of the air pocket.
Low-aeration impact at varying scale. See figure 4 for detailed explanation of the figure layout.

The oscillation of the air pocket subsequent to impact is observable through recurrence of large pressure in the impact zone, e.g. at
 $t\sqrt{g/h}=0.08$
for scale 1. By comparison of scales, the Froude scaled period of the air pocket oscillation increases with scale. This agrees with the findings of Topliss, Cooker & Peregrine (Reference Topliss, Cooker and Peregrine1992), who derived an expression for the oscillatory frequency of an air pocket close to the free surface. For Froude scaled geometry and outer flow, their result implies the scaling
 $T_{r}\sim R_{b}\sim S$
, where
 $T_{r}$
is the oscillation period and
 $R_{b}$
is the bubble diameter. This result exceeds the Froude scaled result of
 $T_{r,Froude}\sim S^{1/2}$
.
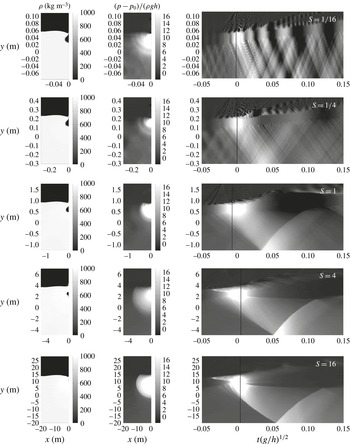
High-aeration impact at varying scale. See figure 4 for detailed explanation of the figure layout.

Results for the high-aeration impact are given in figure 6. Compared with the low-aeration impact, the larger pocket leads to a longer duration of the large impact pressure. Further, the compression of the air pocket and the Froude scaled impact pressure increase significantly at scales above 1. The last two observations indicate that the air is relatively softer at large scale, in agreement with the Bagnold–Mitsuyasu scaling law. At the smaller scales of
 $1/4$
and
 $1/16$
the change of pocket size is less pronounced and, for all scales below 1, the pocket does not close against the wall at the time of maximum impact pressure. Such behaviour was also observed by Lugni et al. (Reference Lugni, Miozzi, Brocchini and Faltinsen2010b
).
By scale 16 the pocket is divided into two by a developed Rayleigh–Taylor instability which also separates a section of the pocket from the wall. As for the flip-through and low-aeration impacts, the propagation of pressure waves down the wall shows a decreasing slope for increased scale. Only at the largest scales, however, is the impact pressure strong enough to form a shock wave. Further, at large scale, the
 $(t,y)$
-plots show that the overturning wave crest generates a substantial pressure when it hits the wall, an effect that is not significant at small scale. This occurs before the time at which maximum impact pressure associated with compression of the air pocket is reached and is higher up the wall.
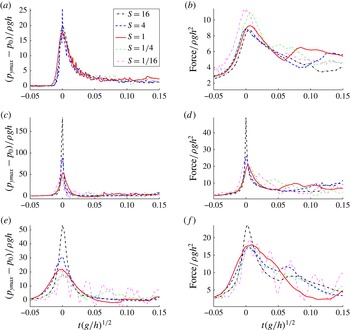
Froude normalised time series of pressure and depth-integrated force per unit width on the wall for the three impact types are presented in figure 7. The pressure record shown for each scale is for the
 $y$
-elevation where the largest pressure occurred. Consequently, the different curves may not be associated with similar elevations on the wall. For the flip-through impact the slight increase in the Froude scaled
 $p_{max}$
with scale is seen to be associated with a slight reduction in the Froude scaled duration of the pressure peak.
Time series of pressure (a,c,e) and force per unit width (b,d,f) for different scales: (a,b) flip-through impact; (c,d) low-aeration impact; (e, f) high-aeration impact. All quantities are made dimensionless such that the curves are invariant to pure Froude scaling.

The low- and high-aeration impacts are similar in that their pressure records show the previously mentioned significant increase in the Froude scaled
 $p_{max}$
for scales larger than 1 and pressures that seem almost Froude scalable at smaller scales. Oscillatory fluctuations in pressure occur after the main peak in both types of impact, with Froude scaled periods that increase with scale, as already discussed in relation to the
 $(t,y)$
-plots of pressure.
For all impacts, the pocket oscillations and/or the reflection of pressures at the seabed lead to oscillations in pressure and force histories following the main impact. For the high-aeration impact at scale
 $1/16$
, the period of the bed reflection coincides with two periods of the pocket oscillation and resonance occurs. A similar match of periods occurs for the low-aeration impact, but in this case the resonance is much less pronounced.
5.2. Comparison of
$p_{max}$
with the Bagnold–Mitsuyasu scaling law

The
 $p_{max}$
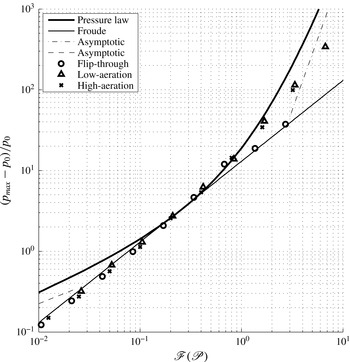
values computed for all scales and types of impact are compared with the Bagnold–Mitsuyasu pressure law in figure 8. Here, the fact that
 $\mathscr{F}(\mathscr{P})$
is proportional to the length scale has been utilised, see (3.11), such that the horizontal placement of each point was determined as
 $\mathscr{F}=k_{i}S$
, where
 $(k_{1},k_{2},k_{3})$
are fixed constants chosen for the flip-through, low-aeration and high-aeration impacts respectively to obtain the best fit to the pressure law.
Numerical values of
 $p_{max}$
compared with the Bagnold–Mitsuyasu scaling law and the Froude scaling law.

The flip-through values only deviate slightly from the Froude relationship, most notably at scale 4, where
 $p_{max}-p_{0}=25.7\,{\it\rho}gh$
, see table 1. The resemblance to Froude scaling can be attributed to the fact that no air is trapped by this type of wave impact. Consequently, the deviations from Froude scaling are associated with the initial 5 % entrained air fraction and possibly the surrounding air flow prior to impact.
Unlike the flip-through values, the low- and high-aeration values broadly follow the Bagnold–Mitsuyasu law in the region where this predicts a stronger increase with scale than the Froude law. In § 3.2 this was found to occur for
 $(p_{max}-p_{0})/p_{0}>3.18$
. The broad agreement in this region implies that for
 $p_{max}$
above about three atmospheres, the scaling of the impact pressures in these types of impact is mainly governed by compression of the air pocket and thus exceeds what the Froude law would predict. The fact that the
 $p_{max}$
values computed for the largest scales do not increase as much as the Bagnold–Mitsuyasu law would suggest may be due to air leakage effects and compression of the aerated water. Since the Mach number (5.3) for the aerated water increases with scale, the cushioning effect of this compression will increase with scale even for fixed initial aeration. Another effect that may explain the deviation is compression of the air pocket to such a small size that it has a much reduced effect on the flow. It should be noted though that the deviation from the Bagnold–Mitsuyasu law occurs at scales 16 and 8, which are larger than the prototype scale of the Alderney breakwater (scale 4). Hence, for the present examples of impacts, the deviation occurs outside the range of practical application.
When
 $(p_{max}-p_{0})/p_{0}<3.18$
, the
 $p_{max}$
values are seen to follow the Froude law. This implies that at these smaller scales, the air pocket has very little influence on the scaling. This may be attributed to the relatively large stiffness of the air pocket at small scales and the fact that the pressure variations associated with the fluid motion become quite small relative to atmospheric pressure. Consequently, the impact often has little effect on the air pocket. In the regime of very small scale, the air pocket is as stiff as the wall and there is no scaling behaviour associated with compression of the air. In such circumstances the Froude law is the relevant scaling relationship. This behaviour is contrasted by the Bagnold–Mitsuyasu scaling law which predicts a pressure increase that is smaller than Froude scaling for gauge pressures below 318 kPa. However, this model is based on the assumption that all the kinetic energy of a geometrically scalable fluid region goes into compression of the air pocket. At small scale, where the pocket is stiff, no work is associated with pocket compression. The initial kinetic energy is instead used to accelerate the vertical uprush from the impact zone and the Bagnold–Mitsuyasu law is therefore not relevant.
On the basis of the present results, a scaling law for impacts with trapped air pockets at fixed aeration can be proposed which combines the Froude curve of figure 8 for
 $(p_{max}-p_{0})/p_{0}<318~\text{kPa}$
and the upper branch of the Bagnold–Mitsuyasu curve for
 $(p_{max}-p_{0})/p_{0}>318~\text{kPa}$
. As illustrated by the results in the figure, such a curve is likely to overpredict the pressures at very large scale and does not take the effect of changed aeration with scale into account. Nevertheless, it provides an improvement over the underprediction by Froude scaling at large pressures and the irrelevance of the Bagnold–Mitsuyasu law at small pressures.
5.3. Maximum force and rise-time impulse
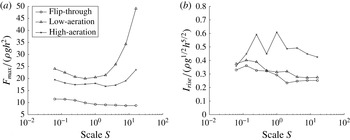
Figure 9(a) shows the maximum force per unit width,
 $F_{max}$
, for all impacts. For the flip-through impact,
 $F_{max}$
decreases with scale whereas
 $p_{max}$
exhibits a slight increase. These apparently contradictory observations can be reconciled by noting that, in relative terms, the impact pressures propagate down the wall more rapidly at small scale than at large scale – see figure 4. Consequently, there is greater temporal overlap of high values in the vertical pressure distribution at small scale and hence a relatively greater force. This can be linked to the increase of the Mach number of the aerated water (5.3) with scale.
(a) Maximum force per unit width as a function of scale. (b) Rise-time impulse as a function of scale.

The Froude scaled force also decreases with scale for both the low- and high-aeration impacts for scales below
 $1/4$
, which might also be explained by the increased Mach number. At larger scales, however,
 $F_{max}$
increases. This is not surprising given that, in both cases, not only do the impact pressures increase above Froude scaling but the higher pressures also increase the velocity at which they propagate down the wall. Thus, although the velocity down the wall still tends to be greater at small scale than at large scale, the difference is less marked than it was for the flip-through impact.
The total impulse from the impact on the wall can be assessed by the rise-time impulse defined by
 $$\begin{eqnarray}I_{rise}=\int _{t_{0}}^{t_{max}}\frac{F}{{\it\rho}gh^{2}}\text{d}t,\end{eqnarray}$$
where
 $F$
is the force at the wall per unit width,
 $t_{0}=-0.05(h/g)^{1/2}$
and
 $t_{max}$
is the time of maximum force. Although an impulse definition that takes the force history after the instant of maximum force into account would be beneficial for the analysis, it was found that the associated definition of the upper time limit for the integration was non-trivial, given the many time scales involved for the impacts. On the contrary, (5.4) is simply the area under the force curves in figure 7 from the left border at
 $t(g/h)^{1/2}=-0.05$
until the time of maximum force and is thus associated with the force history during the rise time of the impact pressure. The rise-time impulses for all impacts are shown in figure 9(b). Except at the smallest scales, the high-aeration impulses are larger than for the flip-through and low-aeration impacts. This can be linked to the broader spikes in the force curves caused by the temporal spread of the impact pressures by the air pocket. While no clear trend with respect to scale can be deduced for the high-aeration impact, the flip-through and low-aeration impacts show a broadly constant variation, with a slight overall decrease as a function of scale. The decrease is attributed to the Mach-number effect which makes the aerated water relatively softer at large scale.
6. Variation of initial aeration for the three wave impacts
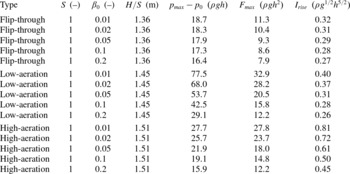
The dependence of the impact pressure, force per unit width and impulse on the level of initial aeration has been investigated for the three impact types at scale 1 by means of computations in which
 ${\it\beta}_{0}=(0.01,0.02,0.05,0.10,0.20)$
. While
 ${\it\beta}_{0}(\boldsymbol{x})$
generally varies in space and depends on the history of previous wave breaking and impacts, a uniform distribution was chosen due to its generic character. The results and computational parameters for the 15 associated model runs are listed in table 2.
Computational parameters and results for investigation of the aeration effect for the three impact types.

6.1. Temporal variation of pressure and force
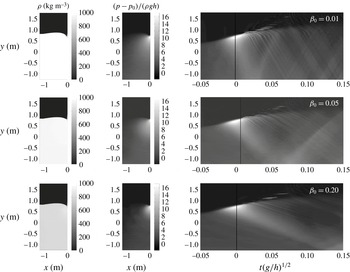
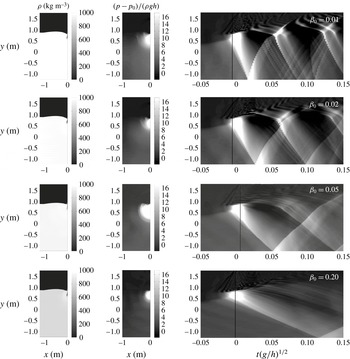
The aeration dependence of the flip-through impact is shown in figure 10 for
 ${\it\beta}_{0}=(0.01,0.05,0.20)$
. The main effects of an increased initial air fraction are to lessen the impact pressure and to decrease the slope of the pressure-wave trajectory in the
 $(t,y)$
-plot. The latter effect is confirmed by (5.2) and the computational results of Plumerault et al. (Reference Plumerault, Astruc and Maron2012). It is due to the fact that, within the range of
 ${\it\beta}_{0}$
values used in the present investigation, the propagation speed of pressure waves reduces as the amount of entrained air increases. Ultimately, when air predominates, the propagation speed starts to increase again, but this is not relevant to the conditions considered here.
Flip-through impact for different initial levels of aeration, as indicated by the value of
 ${\it\beta}_{0}$
in the upper right corner of each row. See figure 4 for detailed explanation of the figure layout.

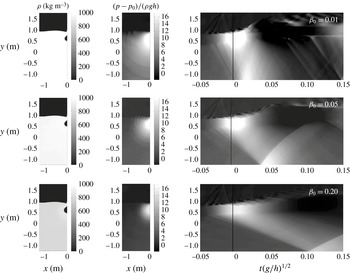
Similar effects are seen for the low-aeration impact in figure 11. However, because the impact pressures are now larger than for the flip-through impact, the reduction in propagation speed with increased aeration is more likely to turn the pressure wave into a shock wave. The pressure discontinuities at the lower edges of the pressure waves in the
 $(t,y)$
-plots for
 ${\it\beta}_{0}\geqslant 0.05$
indicate that shock waves have formed.
Low-aeration impact for different initial levels of aeration, as indicated by the value of
 ${\it\beta}_{0}$
in the upper right corner of each row. See figure 4 for detailed explanation of the figure layout.

The link between propagation speed and aeration level also changes the way in which oscillatory and reflected pressures interact in the impact zone. Thus, while the first recompression of the air pocket seems to occur at the same time
 $t(g/h)^{1/2}\cong 0.07$
for all levels of aeration, the arrival of the first reflected pressure wave from the bed is increasingly delayed as the level of aeration is increased. Resonance occurs for
 ${\it\beta}_{0}=(0.01,0.02)$
, where the reflected wave arrives at almost the same time as the recurrence of the oscillatory pocket pressure.
Increased levels of aeration also act to reduce impact pressures and increase pressure-wave travel times in the high-aeration impacts shown in figure 12. However, at the present scales, the maximum pressures are not strong enough to form shock waves and the time scale of the pocket oscillation is too large to be resonant with the reflection of impact pressure from the bed.
High-aeration impact for different initial levels of aeration, as indicated by the value of
 ${\it\beta}_{0}$
in the upper right corner of each row. See figure 4 for detailed explanation of the figure layout.

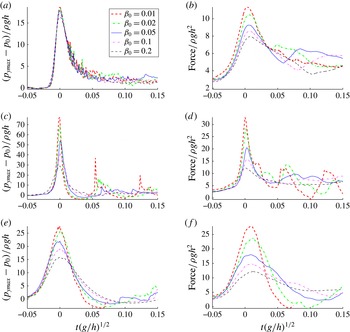
Time series for Froude scaled pressure and force per unit width are presented for the three types of impact in figure 13. In each case, increased aeration leads to a reduction of
 $p_{max}$
, in agreement with Bullock et al. (Reference Bullock, Crawford, Hewson, Walkden and Bird2001) and Peregrine & Thais (Reference Peregrine and Thais1996), but the magnitude of the reduction is case-specific. For example, over the whole range of
 ${\it\beta}_{0}$
values,
 $p_{max}$
is reduced by 12 % from
 $18.7\,{\it\rho}gh$
to
 $16.4\,{\it\rho}gh$
for the flip-through impact, while for the low-aeration impact it is reduced by 62 % from
 $77.5\,{\it\rho}gh$
to
 $29.1\,{\it\rho}gh$
and for the high-aeration impact it is reduced by 43 % from
 $27.7\,{\it\rho}gh$
to
 $15.9\,{\it\rho}gh$
.
Time series of pressure (a,c,e) and force per unit width (b,d,f) for varying initial aeration: (a,b) flip-through impact; (c,d) low-aeration impact, (e,f) high-aeration impact. All quantities are made dimensionless such that the curves are invariant to pure Froude scaling.

The cushioning of the impact pressures also leads to a reduction in
 $F_{max}$
as the aeration increases. For the low-aeration impact, the resonance between pocket oscillation and reflected impact pressure is clearly seen in the force time series for
 ${\it\beta}_{0}=(0.01,0.02)$
. Further, for the high-aeration impact and for
 ${\it\beta}_{0}=(0.01,0.02)$
, negative forces occur, caused by the pocket oscillation. At larger values of initial aeration, the negative pocket pressures are compensated by the positive impact pressures that propagate down the wall. For the two lowest levels of initial aeration, however, these waves travel fast enough to have practically disappeared at the time of negative pocket pressure.
6.2. Comparison with the model of Peregrine & Thais (Reference Peregrine and Thais1996)
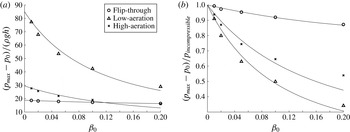
The cushioning effect of entrained air is further illustrated in figure 14(a), where the dimensionless maximum gauge pressures are plotted against the initial aeration
 ${\it\beta}_{0}$
. A fitted version of the approximate solution of Peregrine & Thais (Reference Peregrine and Thais1996), see (2.1), has been added to the plot for each type of impact. For the gauge pressure, normalised by
 ${\it\rho}gh$
, their solution yields
 $$\begin{eqnarray}\displaystyle \frac{p_{max}-p_{0}}{{\it\rho}gh} & = & \displaystyle \frac{\frac{1}{2}{\it\rho}_{w}v_{0}^{2}}{{\it\rho}gh}\frac{1}{({\it\varepsilon}+{\it\beta}_{0})^{2}}\cong \frac{{\it\rho}_{w}v_{0}^{2}}{2{\it\rho}_{w}(1-{\it\beta}_{0})gh}\frac{1}{{\it\varepsilon}^{2}(1+{\it\beta}_{0}/{\it\varepsilon})^{2}}\nonumber\\ \displaystyle & = & \displaystyle \tilde{K}\frac{1}{(1-{\it\beta}_{0})}\frac{1}{(1+{\it\beta}_{0}/{\it\varepsilon})^{2}},\end{eqnarray}$$
where the constant
 $\tilde{K}$
is defined through the last equality. The curves used in the plot were obtained by choosing best-fit values of
 $\tilde{K}$
and
 ${\it\varepsilon}$
, and are seen to match the numerical results for the flip-through impacts well. For the low- and high-aeration impacts, a fair match is seen, with slight underprediction of the cushioning effect for small values of
 ${\it\beta}_{0}$
and overprediction for larger values of
 ${\it\beta}_{0}$
.
(a) Maximum pressure for the three impacts for varying initial aeration. The lines through the points represent a fit of the approximate solution of Peregrine & Thais (Reference Peregrine and Thais1996). (b) The same data, plotted in terms of pressure reduction factors through normalisation with the maximum pressure for incompressible impact.

The value of
 $\tilde{K}$
provides an estimate for the incompressible impact pressure at
 ${\it\beta}_{0}=0$
, extrapolated through the fit of (6.1) to the results at finite levels of aeration. In figure 14(b) the maximum pressures have been normalised with this value for each impact type, to form pressure reduction factors. This plot illustrates that the cushioning from entrained air is most pronounced for the most violent impacts, as previously noted by Peregrine & Thais (Reference Peregrine and Thais1996) and Bullock et al. (Reference Bullock, Crawford, Hewson, Walkden and Bird2001). While the good match between the numerical results and the model of Peregrine & Thais could be expected for the flip-through impact, the match for the low- and high-aeration pressures is a surprise. This suggests that the softening from aeration of the water around the air pocket affects its maximum compression and thereby
 $p_{max}$
.
6.3. Maximum pressure, maximum force and rise-time impulse
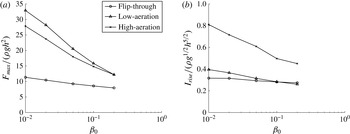
The values of maximum force per unit width and rise-time impulse are plotted against initial aeration in figure 15. The plots confirm that the maximum force and rise-time impulse decrease for increased initial aeration. This can be linked to the Mach-number effect, also discussed for the variation of scale: by (5.3), the Mach number increases with
 ${\it\beta}_{0}$
and thus makes the fluid relatively softer. This cushions the impact and leads to a reduced force. As for the pressures, the force reduction is strongest for the low-aeration impact, followed by the high-aeration impact, while the reduction for the flip-through impact is modest. A similar trend is observable for the rise-time impulse. While the impulses are largest for the high-aeration impact due to the increased duration of impact pressure from the air pocket, the decrease in impulse is also largest for this impact.
(a) Maximum force as a function of initial aeration. (b) Rise-time impulse as a function of initial aeration.

7. Summary and discussion
The roles of scale and aeration in violent breaking wave impacts on a vertical wall have been investigated. By dimensional analysis, the effect of trapped and entrained air for otherwise Froude scalable wave impacts has been shown to depend on scale through the Bagnold number and on the level of initial aeration. The Bagnold–Mitsuyasu pressure law has been generalised to 3D air pockets of arbitrary shape, including subdivided air pockets, and a simple scaling procedure has been suggested, which is based solely on the measured impact pressure. In terms of the generalised scaling law, impact gauge pressures larger than 318 kPa increase more with scale than implied by Froude scaling.
Numerical computations at varying scale and initial aeration have been undertaken for a flip-through impact, a low-aeration impact and a high-aeration impact. For variation of scale, the flip-through impact pressures were found to be broadly Froude scalable, while the low- and high-aeration impacts were found to follow Froude scaling for
 $p_{max}<318~\text{kPa}$
and to almost follow the Bagnold–Mitsuyasu scaling law for
 $p_{max}>318~\text{kPa}$
. The first observation disagrees with the Bagnold–Mitsuyasu scaling law and has been explained in terms of the increase of relative air stiffness at small scale, which eventually makes the air behave like a rigid boundary. This finding is also in contrast to the results of Abrahamsen & Faltinsen (Reference Abrahamsen and Faltinsen2013) for water wave slamming of an air pocket trapped in a corner, bounded by rigid boundaries. However, the geometry of their configuration is different from what we have computed in this study. In particular, the presence of the free surface provides an extra degree of freedom to the motion and, as described above, we suggest that it is this effect that leads to the recovery of Froude scaling when the overall scale of the flow is relatively small. This highlights the complexity of the interactions and the care needed when applying prototype and laboratory scales to full-scale installations.
For large scale, the smaller deviations from the Bagnold–Mitsuyasu scaling law may be caused by the increased Mach number for the aerated water, which leads to increased cushioning, air leakage effects and compression of the air pocket to such an extent that it loses its influence on the flow. These deviations occurred for scales that are larger than typical prototype scales. The present results hereby suggest that the pure scale effect can be described by a pressure law that resembles Froude scaling for impact pressures below 318 kPa and the Bagnold–Mitsuyasu law for impact pressures above 318 kPa. To this end, the upper branch of the Bagnold–Mitsuyasu scaling law could even be modified to include the effect of pressure cushioning from the aerated water phase at large scale. Such an extension is subject to current work in relation to the Sloshel project (L. Brosset 2013, private communication).
For the flip-through impacts, the Froude scaled maximum force decreases with scale. This effect has also been explained in terms of the increased Mach number which increases the relative propagation speed for the impact pressure over the extent of the wall. The low- and high-aeration impacts show a similar behaviour at small scale, while the increase in
 $p_{max}$
relative to Froude scaling at large scales leads to increased Froude scaled values of
 $F_{max}$
. The rise-time impulses for the flip-through and low-aeration impacts are broadly constant, with a slight overall decrease with scale that can probably be attributed to the increased Mach number. No clear trend was deduced for the high-aeration impact.
The effect of aeration has been investigated at scale 1. For all three impact types,
 $p_{max}$
,
 $F_{max}$
and the rise-time impulse decrease with initial aeration due to the cushioning by the aerated water. Our computations confirm that the pressure reduction factor increases with impact violence, as suggested by the Peregrine & Thais (Reference Peregrine and Thais1996) model. The pressure reductions for the flip-through and high-aeration impacts were found to agree well with their asymptotic model and with some deviation for the low-aeration impact. The good agreement for the high-aeration impact implies that the aeration of the surrounding water is still able to reduce the maximum pressure, although this appears inside the air pocket. The explanation may be that, although the air pocket is deformable, it will be quasistatic in shape at the time of maximum compression and thus for a short instant resemble the behaviour of a rigid wall. In this situation, the aeration of the surrounding water will still cushion the large pressures at the air–water interface in a similar way to that for a rigid wall.
Both the impact pressure and the Mach number depend on scale and aeration, which variously affect the oscillation of trapped air pockets, the propagation of pressure waves and their possible development into shock waves. For certain combinations of impact type, scale and aeration, resonance can occur between the pocket oscillations and the returning pressure waves. This means that values higher than those caused by the initial impact could occur, as predicted by Plumerault et al. (Reference Plumerault, Astruc and Maron2012). Unfortunately, the resonance is not easily predicted by small-scale model tests, as the phenomenon depends on the scale as well as aeration.
From the present investigation, the effect of scale acts to preserve and possibly increase the Froude scaled impact pressures, while aeration acts to reduce the impact pressures. The likely increase of aeration level for increased scale may in some circumstances reduce the full-scale impact pressures to below the values predicted by the Froude law. This possibility could be investigated by means of the present model, which could be extended by adding a predictive model for the level of aeration similar to that of Blenkinsopp & Chaplin (Reference Blenkinsopp and Chaplin2007a , Reference Blenkinsopp and Chaplin2011). This might help to justify the widespread belief among practising engineers that Froude scaling of laboratory freshwater impact pressures leads to the prediction of unrealistically large full-scale pressures. The present study indicates that pressures below those predicted by the Froude law must be due to increased aeration rather than the pure scale effect and that, in the absence of aeration, pressures significantly above the Froude level are possible.
Acknowledgements
This work was mainly supported by the UK Engineering and Physical Sciences Research Council (grants GR/R29772/01, EP/C515072/1 and GR/R29789/01). Professor R. LeVeque is thanked for valuable inputs on the numerical solution of the aerated-flow model. The authors are indebted to Professor H. Peregrine who initiated this aspect of the BWIMCOST research and shortly before his decease suggested investigation of the behaviour at small scale. We are grateful for the inspiration and the many stimulating discussions we had with Howell over the years.