

It should come as no surprise that large and complex archaeological sites often have complicated histories (e.g., Cook Reference Cook2007; Davis, Walker, and Blitz Reference Davis, Walker and Blitz2015; Prentiss et al. Reference Prentiss, Foor, Cross, Harris and Wanzenried2012), yet this has not been the guiding assumption through much of archaeology's history. Trigger (Reference Trigger1989:286, 383) notes that while culture historians were ostensibly amenable to models of relatively rapid cultural change explained by diffusion and migration, in practice the reliance on relative chronologies and the tendency to see Native American societies as relatively static resulted in abbreviated chronologies wherein major changes were seen to occur only infrequently. The mid-century advent of radiocarbon dating revealed longer sequences more accommodating of internal transformations, compatible with the neo-evolutionary approaches that came to dominate archaeology (Taylor Reference Taylor1995:172; Trigger Reference Trigger1989:286). But combined with the imprecision of conventional radiocarbon dating, especially in the absence of reliable calibrations, the result was simply longer chronologies with equivalent infrequence of cultural change (Gowlett Reference Gowlett and Bintliff2006:199; Trigger Reference Trigger1989:383).
Applied at the level of individual sites, both cultural historical and neo-evolutionary perspectives on change are consistent with what Isbell (Reference Isbell, Canuto and Yaeger2000:246–247) has referred to as the “natural community” approach, which views communities as bounded, homogeneous, slow-changing, and isolated. Communities are seen as “natural” in that they are assumed to have a cohesiveness defined by face-to-face social interaction within a limited space (e.g., Kolb and Snead Reference Kolb and Snead1997). Isbell contrasts this with what he terms the “imagined community” approach, drawing from Benedict Anderson's famous description of modern nation-states as imagined in the sense that although members of even the smallest nation would never know or even hold much in common with their compatriots, each nevertheless held in his or her mind “the image of their communion” (2006:6). Imagined community approaches emphasize the social construction of community and its strategic deployment by individuals or factions.
The imagined community approach is concurrent with but largely uninformed by improvements in the precision and modeling of radiocarbon dates that have the potential to more fully reveal the dynamism of past communities. Improvements in accelerator mass spectrometry dating allow us to date smaller samples with greater precision (Bayliss Reference Bayliss2009; Taylor Reference Taylor1995) at costs increasingly commensurate with those of conventional radiocarbon dating, which permits the retrieval of more dates. Bayesian statistics permit formal date estimates of much greater precision, allowing us to approach changes in communities at generational or even decadal scales (Bayliss et al. Reference Bayliss, Ramsey, McCormack, Healy, Whittle, Whittle, Healy and Bayliss2011). Despite these advances, but consistent with much of postprocessual theory, imagined community approaches tend to focus less on cultural change than on time itself, understanding this as a cultural construction related to ritual, materiality, and remembrance (Robb and Pauketat Reference Robb, Pauketat, Robb and Pauketat2013:17; see also Whittle, Healy, and Bayliss Reference Whittle, Healy, Bayliss, Whittle, Healy and Bayliss2011:2–4). As useful as such insights have been, the reliance on imprecise chronologies runs the risk of obscuring short-term changes (Whittle, Healy, and Bayliss Reference Whittle, Healy, Bayliss, Whittle, Healy and Bayliss2011:4). As Whittle, Healy, and Bayliss note,
So far there has been little attempt to exploit the detailed biographies of particular sites . . . to examine the pace of change or to untangle webs of inter-related development at the temporal scale of the people and communities who experienced them [2011:4].
We present a revised biography of the community represented by Kolomoki (9ER1) and related sites of the Middle and Late Woodland periods (ca. 200 BC to AD 1050) in the uplands of the lower Chattahoochee Valley of southwestern Georgia (Figure 1). As a site recognized by archaeologists for more than a century, Kolomoki's importance came into sharper focus with the archaeological investigations by Sears (Reference Sears1950, Reference Sears1956) and, later, Pluckhahn (Reference Pluckhahn2003). The latter described the site as, for its time, perhaps the largest village north of Mexico, with a discontinuous habitation area a kilometer in diameter (Pluckhahn Reference Pluckhahn2003:198). The site's nine mounds (Figure 2) include what may be the largest Woodland period platform mound (Mound A) in eastern North America (Wood and Pluckhahn Reference Wood and Pluckhahn2017), two elaborate burial mounds (Mounds D and E; Sears Reference Sears1951a, Reference Sears1953, Reference Sears1956:11–12, 94–99), two small platform mounds (Mounds F and H; Sears Reference Sears1956:13), and three mounds of uncertain purpose (Mounds B, C, and K; Fairbanks Reference Fairbanks1941a; Sears Reference Sears1956:10–11; see also Pluckhahn Reference Pluckhahn2003: 51–73).
Location of Kolomoki and other sites mentioned in the text relative to the approximate extent of Swift Creek and Weeden Island pottery (adapted from Milanich et al. Reference Milanich, Cordell, Knight, Kohler and Sigler-Lavelle1997:11; Williams and Elliott Reference Williams, Elliott, Williams and Elliott1998:6).

Map of Kolomoki.

Previous interpretations of Kolomoki are mostly consistent with a natural community perspective, with an assumption of gradual and incremental change. We present a revised chronology based on new investigations in some of the lesser-known portions of the site and a doubling of the number of absolute dates. Bayesian modeling of 30 dates from the village reveals four phases of occupation; eleven dates from mounds allow us to tentatively place these features relative to the village chronology. Our analysis reveals that, far from the gradualist assumption of previous work, the community at Kolomoki was dynamically transformed several times in its history, reaching its greatest spatial extent and formal complexity in two relatively short-lived phases. In these intervals, the village incorporated permanent residents and visitors into a single community in which daily face-to-face interactions were minimized even as communal identity was celebrated. In this sense, the community at Kolomoki may have been more imagined than natural, although we follow recent authors in envisioning a combination of both (Gerritsen Reference Gerritsen and Bintliff2006:146; Harris Reference Harris2014:79; Varien and Potter Reference Varien, Potter, Varien and Potter2008:3–4).
Archaeological Investigations at Kolomoki
The impressive scale of the Kolomoki site was established in the 1800s when the number, size, and extent of its mounds were first mapped by antiquarians (Jones Reference Jones1873; McKinley Reference McKinley1873; Pickett Reference Pickett1851; White Reference White1854). Little attention was devoted to evidence for habitation, although Charles C. Jones noted that “arrow and spear heads, stone axes, fragments of quartz—not native to this region—and numerous sherds of earthen vessels . . . are turned up by the ploughshare in every direction” (1873:173). All of these early accounts made note of a discontinuous earthen “wall” or “enclosure” surrounding the major mounds, a feature later found to be associated with domestic habitation.
About a decade later, Edward Palmer (Reference Palmer1884) completed excavations in 10 of the mounds and various parts of the village. He described his excavations in the mounds and also recorded evidence for dense habitation in several areas of the site, most prominently in the area north of Mound A, where he observed an apparent pit house “three feet [91 cm] deep and 5 to 6 feet [1.5–1.8 m] square” (Palmer Reference Palmer1884:148). Palmer also saw evidence for intensive settlement south of Mound A, although here the effects of erosion and looting were more severe.
Lieutenant J. L. Valliant later completed a brief but detailed letter report describing the Kolomoki site, observing that “after four days’ surface examination I am convinced that this was a large and important town and that it was occupied for a long period of time” (Valliant to the Director, Department of Archaeology, October 28, 1937, on file at the University of Georgia Laboratory of Archaeology, Athens). Valliant described the ground around the enclosure at the southern end of the site as “littered with potsherds.” An accompanying map includes notations of “many sherds” in the areas south of Mound A and near the northern arc of the enclosure, corresponding with Palmer's observations.
In the early 1940s, Charles Fairbanks (Reference Fairbanks1941a, Reference Fairbanks1941b, Reference Fairbanks1946) conducted surface collections and excavations in two small mounds in advance of park improvements. Fairbanks described the site as “approximately 2,500 feet [762 m] long from east to west and 1,500 feet [457 m] from north to south” (Reference Fairbanks1946:258). He was the first to assign the major occupation chronologically, placing it earlier than mound sites such as Etowah and Moundville based on the abundance of Swift Creek Complicated Stamped pottery, as well as the less common incidence of various types of the later Weeden Island complex. Fairbanks described the Swift Creek village as “extensive” and “one of the larger settlements of these people” (Reference Fairbanks1946:259).
William Sears undertook extensive work at Kolomoki in the later 1940s and 1950s. His (1951a, 1953, 1956:11–12) excavations in the two burial mounds were thoroughly documented and revealed elaborate mortuary regimens. Mound E was composed of a central burial shaft with additional graves above and a small ceramic cache on the mound's eastern side (Sears Reference Sears1951a, Reference Sears1956:12), the latter a feature common to the region (Moore Reference Moore1901, Reference Moore1902, Reference Moore1903, Reference Moore1918). Mound D produced hundreds of interments taking a variety of forms, including primary burials in individual rock- or log-lined tombs, comingled primary and secondary burials in log crypts, cremations in place, and scattered skulls and bone bundles (Sears Reference Sears1953, Reference Sears1956:11). The ceramic cache included hundreds of whole and partial vessels, many in the form of animal and human effigies.
Sears (Reference Sears1951b, Reference Sears1956:8–10) also completed excavations and surface collections in off-mound areas, but these are unfortunately vastly underreported. Sears's treatments of both mounds and village were further flawed by his inversion of the ceramic chronology to force the dominant occupation closer to the Mississippian period, when large villages with platform mounds became more common in the region (Knight and Schnell Reference Knight and Schnell2004; Pluckhahn Reference Pluckhahn2003, Reference Pluckhahn2007, Reference Pluckhahn and Alt2010a; Sears Reference Sears1992; Trowell Reference Trowell1998; Williams Reference Williams1958). Nevertheless, Sears (Reference Sears1956:94–95) described changes in the village in general terms, and we may reorder these in the context of contemporary understandings of ceramic chronology: a formal U-shaped village centered on a plaza (Kolomoki period) was replaced by a linear village plan (Weeden Island I period), and this was replaced by a series of scattered middens (Weeden Island Ib period; Figure 3).
Sears's (Reference Sears1956:7) representation of the mounds and habitation areas at Kolomoki, viewed from the northeast.

Pluckhahn's (Reference Pluckhahn2003) investigations began a half century later. Systematic sampling of the off-mound areas with shovel tests and controlled surface collections at 20-m intervals documented the sprawl of the residential areas (Figure 4). Where Sears suggested that Kolomoki's village was confined to the edges of the central plaza, Pluckhahn (Reference Pluckhahn2003:91–120) demonstrated that this “near-plaza” artifact scatter (referred to here as the “inner village”) was paralleled by a larger and generally more dense ring of residential debris (herein the “outer village”) roughly coterminous with the earthen enclosure as reported in early accounts of the site (but dismissed by Sears [Reference Sears1951b:1–2]). Swift Creek and Weeden Island ceramics were found to overlap more substantially than Sears imagined, albeit with notable differences (Figure 5): Swift Creek was ubiquitous in both the inner and outer villages, while Weeden Island pottery was more strongly associated with the latter (Pluckhahn Reference Pluckhahn2003:92–99).
Pluckhahn's (Reference Pluckhahn2003) shovel tests and controlled surface collections at Kolomoki.

Kriging interpolations of the weights (in grams) of Swift Creek (top) and Weeden Island (bottom) pottery in Pluckhahn's shovel tests and controlled surface collections at Kolomoki.

Pluckhahn's (Reference Pluckhahn2003:130–139, 148–179) test units and small block excavations in the northern arc of the outer village revealed numerous features and a small, semisubterranean “keyhole” structure (of dimensions similar to those reported by Palmer), confirming that this was an area of intensive habitation. In contrast, the limited density of artifacts and features in the inner village called into question the permanence of settlement here, although this portion of the site was more heavily impacted by erosion (Pluckhahn Reference Pluckhahn2003:185–189; Figure 6). Likewise, reduced artifact density in the southern arc of the outer village also suggested less permanent (perhaps seasonal) habitation, but variations in sampling complicated the interpretation (Pluckhahn Reference Pluckhahn2003:189).
Extent of erosion at Kolomoki, as indicated by the maximum depth (in centimeters below the surface [cmbs]) to artifacts in shovel tests and by the depth to subsoil in shovel tests and test units.

Drawing from regional chronologies that assumed a gradual shift from Swift Creek to Weeden Island to Wakulla Check Stamped pottery (Knight and Mistovich Reference Knight and Mistovich1984:219–221; Percy and Brose Reference Percy and Brose1974; Willey Reference Willey1949), and anchoring this for Kolomoki with eight radiocarbon dates from mound and village contexts, Pluckhahn (Reference Pluckhahn2003:15–22) described four 100-year phases of occupation covering the interval from AD 350 to 750. The outer and inner villages were assumed to have formed early in the site's history, concomitant with the construction of most of the mounds (Pluckhahn Reference Pluckhahn2003:183–207). Ceramic changes, dated to around AD 550, marked a shift from the formal, circular village plan to a more haphazard arrangement that coincided with a decline in mound construction (Pluckhahn Reference Pluckhahn2003:207–219).
Karen Smith (Reference Smith2009; see also Smith and Neiman Reference Smith and Neiman2007) conducted frequency seriation and correspondence analysis of 99 ceramic assemblages from 32 sites in the lower Chattahoochee and Apalachicola valleys, including several generated by Pluckhahn's work at Kolomoki. Her (2009:88, 92) analysis demonstrated a longer span for Swift Creek pottery than previously assumed and a more abrupt transition to later Weeden Island types. Smith (Reference Smith2009:87–89) defined eight phases of 100–200 years duration for the first millennium AD. Variability in interassemblage distance and intra-assemblage diversity suggested to Smith (Reference Smith2009:176–177) intervals of greater and lesser mobility and social interaction. Heightened mobility was found to be associated with intervals of prolonged below-average rainfall, as reconstructed from the Palmer Drought Severity Index.
Around the same time, Pluckhahn's (Reference Pluckhahn2010b, Reference Pluckhahn2011, Reference Pluckhahn and Carballo2013, Reference Pluckhahn, Thompson and Cherkinsky2015) additional block excavations targeting an area of later occupation south of Mound A likewise suggested a relatively sudden increase in the frequency and variety of Weeden Island pottery around AD 750. The Block D excavation also indicated that the occupation of Kolomoki persisted a century or so later than previously assumed, to at least around AD 900.
New Insights on Community at Kolomoki
Methods
Recent work by Smith and Pluckhahn made apparent the need to revisit the occupational history of Kolomoki. Toward this end, we initiated (1) new fieldwork in the little-studied southern portion of the village and (2) absolute dating of materials retrieved from this fieldwork and collections generated by earlier work at the site. Investigations in the southern half of the site, summarized in greater detail by Menz (Reference Menz2015) and West (Reference West2016), included systematic surface survey, geophysical prospection, and test excavations to complement Pluckhahn's (Reference Pluckhahn2003) work of similar scope on the northern portion of the site.
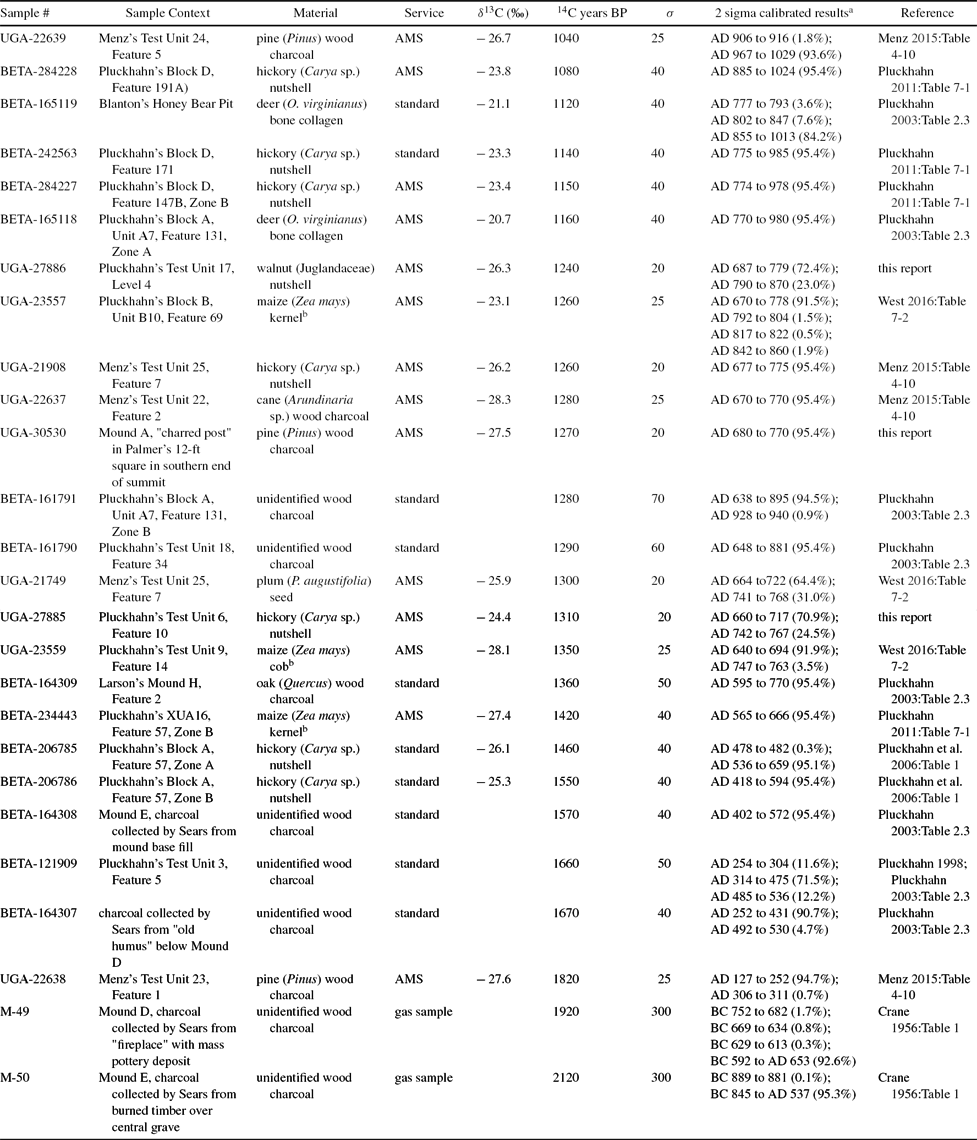
Radiocarbon samples from Kolomoki have been processed by the University of Michigan, Beta Analytic, Inc., and the University of Georgia Center for Applied Isotope Studies. Table 1 lists the 26 radiocarbon dates from Kolomoki, including five recently retrieved from new work in the southern portion of the site and six recently obtained on materials generated by previous excavations (see also Supplemental Table 1).
Radiocarbon Dates from Kolomoki.

a Calibrated using OxCal 4.2 (Bronk Ramsey 2009) with the IntCal13 curve (Reimer et al. Reference Reimer, Bard, Bayliss, Warren Beck, Blackwell, Ramsey, Buck, Cheng, Lawrence Edwards, Friedrich, Grootes, Guilderson, Haflidason, Hajdas, Hatté, Heaton, Hoffmann, Hogg, Hughen, Felix Kaiser, Kromer, Manning, Niu, Reimer, Richards, Marian Scott, Southon, Staff, Turney and Plicht2013).
b These specimens were identified as maize (Bonhage-Freund Reference Bonhage-Freund2002, Reference Bonhage-Freund2010; Pluckhahn Reference Pluckhahn2003:189), but isotope values are inconsistent with this identification; see Simon (Reference Simon2017) for a discussion of similar issues with maize identifications in the Midwestern US.
To the extent possible, our strategy for radiocarbon dating has followed general principles of chronological hygiene (e.g., Nolan Reference Nolan2012), favoring materials of relatively short life span, such as nutshells and seeds, from secure contexts. Unfortunately this strategy was not possible for dating the mounds, where previous investigations collected little suitable for radiocarbon dating and in most cases nothing but wood charcoal (but see Cook and Comstock Reference Cook and Comstock2014 for a defense of the utility of charcoal dates from temperate environments). The utility of many of the mound dates is also limited by the coarse understanding of the sample context provided by the accounts of previous investigations.
Our chronological hygiene is better for off-mound contexts; with the exception of one sample (UGA-27886) on nutshell collected from the screening of a 10-cm level of matrix, all of these dates are taken from materials associated with feature contexts. Many of the dated features are small, relatively shallow, and unstratified, suggesting that they filled rapidly; in such cases, we assume that the dates correlate relatively closely with the period of feature use and abandonment. The association is less secure for larger, stratified features that presumably filled over longer intervals. This problem is epitomized by five dates associated with the keyhole structure in Block A. The measured radiocarbon ages for three of the dates from this feature span an interval of 130 years, with calibrated ranges spanning more than 400 years. Two additional dates are more recent and would extend the period of filling still further, although there are reasons to question these; one assay (Beta-165118) was obtained on a disarticulated deer bone that had been penetrated by small root hairs (thus perhaps accounting for its relatively recent dating), and the other (Beta-161791) was obtained on unidentified wood charcoal (thus possibly representing a more recent intrusion).
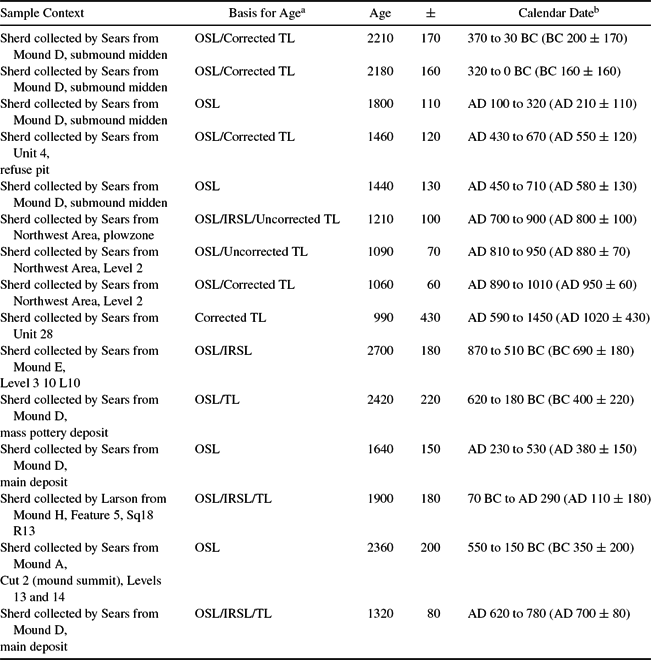
To compensate for the paucity of carbon samples from previous excavations, we obtained nine luminescence dates on ceramics from Sears's excavations in the village and six from his mound excavations (Table 2; Supplemental Table 2). The samples were processed by the University of Washington Luminescence Dating Laboratory using a combination of thermoluminescence, optically stimulated luminescence, and infrared stimulated luminescence, as described by Feathers (Reference Feathers2014, Reference Feathers2016). The age and error for both optically stimulated luminescence and thermoluminescence are calculated using a spreadsheet based on Aitken (Reference Aitken1985), with error terms reported at one sigma. Some of the sample ages were corrected for anomalous fading following procedures recommended by Huntley and Lamothe (Reference Huntley and Lamothe2001).
Luminescence Dates on Swift Creek Sherds from Sears's Excavations at Kolomoki.

a TL = Thermoluminescence, OSL = Optically Stimulated Luminescence, IRSL = Infrared Stimulated Luminescence.
b Calculated relative to the year 2010.
To model phases of off-mound settlement, we utilized the Bayesian modeling capabilities of OxCal 4.2 (Bronk Ramsey Reference Bronk Ramsey2009). As summarized by Bayliss and colleagues (Reference Bayliss, Ramsey, McCormack, Healy, Whittle, Whittle, Healy and Bayliss2011:19), this is a probabilistic and contextual approach, in which we analyze new data (observed likelihoods) in the context of our existing experience and knowledge (prior beliefs), which leads to a new understanding of the problem (posterior beliefs) through the use of formal probability theory, where the three elements of the model are expressed as probability density functions. Given the absence of stratigraphy in the village remains at Kolomoki, and the long duration of many of the diagnostic pottery types, we used hypothetical phases as prior beliefs and the radiocarbon and luminescence dates as observed likelihoods (Bayliss et al. Reference Bayliss, Ramsey, McCormack, Healy, Whittle, Whittle, Healy and Bayliss2011; Bronk Ramsey Reference Bronk Ramsey2009, Reference Bronk Ramsey2014). Luminescence dates were entered into OxCal as calendar dates, with attendant error ranges.
OxCal uses a Markov Chain Monte Carlo model to build up a representative sample of possible solutions (Bronk Ramsey 2014). The extent to which it is able to do so is measured by convergence, with good convergence indicated by a value above 95. The solution is also evaluated using an agreement index to determine whether the data are consistent with the model (Bronk Ramsey Reference Bronk Ramsey1995). OxCal calculates agreement indices for individual dates (A), the model (Amodel), and the overall agreement between the agreement indices (Aoverall). The critical value is 60.0; anything above this is considered significant agreement. Agreement indices are indicative of consistency but not necessarily the accuracy of the model.
We began with contiguous phase modeling, which assumes order but no hiatuses between phases (estimating transitions rather than boundaries; Bronk Ramsey Reference Bronk Ramsey2009:348–349; Burley et al. Reference Burley, Kevan Edinborough and Jian-xin2015), and ran numerous iterations, as summarized in Supplemental Figure 1. We started with the assumption of a single phase (Model 1.0), which provided agreement indices only slightly above critical thresholds. Taking advantage of an obvious break in the calibrated dates, we next developed a simple two-phase model (Model 2.0), which produced agreement indices indicative of greater consistency. Model 3.0 divided the earlier set of dates to create three phases, resulting in continuing improvement in the agreement indices. Our initial attempt at four phases (Model 4.0), by dividing the middle phase of Model 3.0, resulted in less overall consistency. However, rearrangement of individual dates based on their A values eventually resulted in a model (Model 4.4) with high overall agreement indices (Amodel = 134.5; Aoverall = 129.8) and correspondingly high agreement values (A > 100) for all but three individual dates. The exceptions include two thermoluminescence (TL) dates on Swift Creek pottery (UW-2897 and UW-2899) that are much older than the accepted range for this pottery type and one radiocarbon date (UGA-22639) on a sample of pine wood charcoal that is anomalously late relative to all other dates. Inclusion of these dates appeared to artificially lengthen the intervals for the first and last phases. Considering these three dates as outliers resulted in significant improvement to the final model (Model 4.5: Amodel = 152.8; Aoverall = 151.3), described more fully in Supplemental Table 3 and Supplemental Figure 2.
Supplemental Table 4 documents the relative frequency of ceramic surface treatments in the dated samples associated with the controlled excavations of features (and one excavation level) by Pluckhahn (Reference Pluckhahn2003), Menz (Reference Menz2015), and West (Reference West2016). With the exception of the very small assemblage from Feature 10, all of the assemblages associated with modeled Phases 1 and 2 exhibit large (>39%) relative frequencies of complicated stamped pottery (principally Swift Creek), with trace amounts (<2%) of other surface decorations. Despite the problems noted above with dating the keyhole structure in Block A, the assemblages associated with its two fill layers are generally consistent with others assigned to Phase 2.
The frequency of complicated stamping is more variable but generally reduced in the more robust assemblages assigned to modeled Phase 3. All of the larger assemblages assigned to Phase 3 include slightly higher frequencies of a diverse suite of other surface treatments, such as the red-filming and incising of the Weeden Island series.
A continued reduction in complicated stamping is evident in the two larger assemblages assigned to Phase 4. There is likewise a corresponding increase in the relative frequencies of other surface treatments, particularly red-filming. The assignment of Feature 131, the pit at the center of the keyhole structure, to this phase is obviously problematic given that the fill layers in the house basin above it are assigned to the earlier Phase 2. The pottery assemblage from the pit, although small, is more consistent with Phase 2.
Unfortunately, while the mounds are obviously stratified, we have few dates on most construction episodes and, owing to the incomplete reporting of much prior work at Kolomoki, poor provenience control over many of the dated samples. Thus, rather than attempt Bayesian modeling, we use the available dates only as terminus post quem (TPQ; i.e., the most recent) ages for the initiation of the mounds or, in at least a few cases, mound construction episodes. Examples of the latter include Mound E, where we have dates on both the central grave below the mound and the mound fill above this, and Mound D, where we have dates on the premound midden (which included burials) and others associated with a ceramic cache that was added sometime after most of the burials but before the mound was capped with a layer of clay (see Sears Reference Sears1953, Reference Sears1956). Possible stratigraphy in the two samples from Mound H is not borne out by the dates, so in this case we consider the more recent date as TPQ. Supplemental Table 5 lists the dates from the mounds and mound construction episodes, with the TPQ for each in bold.
Results
Our model suggests that Kolomoki was settled earlier than previously assumed, sometime between 86 cal BC and cal AD 317 (95% probability), probably between cal AD 78 and 233 (68% probability). This is consistent with Smith's (Reference Smith2009:87–89, 115–116) Kolomoki I phase for the valley as a whole; Swift Creek Complicated Stamped is the dominant pottery type, to the near exclusion of any others (see Supplemental Table 4). Preinundation surveys of riverine bottomlands revealed few sites from this interval, a pattern interpreted as reflecting a settlement shift from the central valley to the hinterlands (Belovich et al. Reference Belovich, Brose, Weisman and White1982:475; Knight and Mistovich Reference Knight and Mistovich1984:230). However, sites are also rare in the uplands in the vicinity of Kolomoki (Steinen Reference Steinen1976, Reference Steinen1995, Reference Steinen, Williams and Elliott1998). Pluckhahn's (Reference Pluckhahn2003:39–43) review of site files data suggests that Kolomoki may have been founded in an otherwise lightly settled area of the valley, midway between denser clusters of settlement to the north and south.
Of the five dates that define Phase 1, two come from the midden below Mound D (Figure 7a). This is unsurprising given its stratigraphic position and a relatively high frequency of rim forms and stamping characteristics common to early Swift Creek (Pluckhahn Reference Pluckhahn2003:81–82). Sears described the midden below Mound D as about 30.5 cm thick and “unusually rich” (1953:41). He (1953:6–7) mentions no features other than five log-lined graves below, and apparently predating, the mound.
(a) Phase 1 radiocarbon dates and community plan at Kolomoki; (b) Phase 2 radiocarbon dates and community plan at Kolomoki; (c) Phase 3 radiocarbon dates and community plan at Kolomoki; (d) Phase 4 radiocarbon dates and community plan at Kolomoki.

A third date that comes from this phase is from a pit feature in a test unit just to the north in the area of the inner village. Several other features were recorded in this unit (Pluckhahn Reference Pluckhahn2003:136), and a possible semisubterranean structure was identified in the adjacent Block C (Pluckhahn Reference Pluckhahn2003:169–179). Together these data indicate at least seasonally sedentary occupation during a portion of Phase 1. We have no other Phase 1 dates from elsewhere in the inner village and thus suggest, contrary to previous assumptions, that the formal, U-shaped community plan had yet to develop. Still, we note again that the inner village area has been more heavily impacted by erosion and may have also been remodeled by later activities, including the use of middens for mound fill (Caldwell Reference Caldwell1978:96; Sears Reference Sears1956:9).
The remaining two dates that make up Phase 1 are from features in the outer village. We are skeptical that these dates correctly characterize the timing of occupation in these areas, given that other assays from the same locations—and in the case of Block A, the same feature—are all more recent. However, we do not exclude the possibility that some sorts of activities, perhaps including ephemeral settlement, took place in these areas during this initial phase.
Mortuary ceremony may have been an integral part of the Phase 1 settlement at Kolomoki. The calibrated ranges for a radiocarbon date retrieved on a timber from the central grave in Mound E fall mainly within this phase; this is consistent with suppositions by both Sears (Reference Sears1956:94) and Pluckhahn (Reference Pluckhahn2003:66), based on the ceramic assemblage, that this mound dates relatively early in the site's history. Less securely, ritual activities may have begun in the area of Mound D if we assume that the midden here is only slightly antecedent to the intrusive burials at the base of the mound.
It is possible that Mound A may have also been initiated during Phase 1. Sears's (Reference Sears1956:10) excavations in Mound A were limited to two small cuts, and he describes only two strata in each (red clay over white clay mixed with black soil). A TL date on a Swift Creek sherd from Levels 13 and 14 in his Cut 2 (probably 1.82 to 2.13 m [6–7 ft] below the 19-m-tall summit) is earlier than the commonly accepted range of this pottery type, but only by a century or so when the error range is considered. However, Palmer's (1884) three excavations in the mound revealed more complicated stratigraphy perhaps indicative of a multistaged construction history, and as we note below, an accelerator mass spectrometry date on a sample of wood charcoal suggests that at least the upper portion of Mound A dates to Phase 3 or later.
Phase 1 may have lasted as long as 708 years (95% probability), probably between 332 and 526 years (68% probability). The longevity of this relative to later phases is difficult to reconcile with the apparently limited extent of habitation and infrequence of dated samples. Perhaps the site began as a vacant ceremonial center, as the comparatively early dates from Mounds A and E might suggest. If this is the case, the midden below Mound D may have resulted from short-term feasting events associated with mortuary ceremonies. On the other hand, the thickness of the midden below Mound D and the presence of features in several Phase 1 units suggest more permanent settlement. The most likely explanation may be that the site began as a vacant ceremonial center for populations that resided more permanently elsewhere but over time began to attract more habitation, perhaps coincident with the abandonment of the central valley as noted above.
Phase 2 provides better evidence for the U-shaped inner village fronting the plaza; four of the seven dates assigned to this phase are from an equal number of widely spaced test units in this area (Figure 7b). The other dates assigned to this phase include two from the same feature in the northern arc of the outer village and one from a unit near the center of the southern arc of the outer village. Phase 2 began between cal AD 490 and 651 (95% probability), probably between cal AD 557 and 636 (68% probability).
Phase 2 corresponds generally with Smith's (Reference Smith2009:87–89) Kolomoki II phase; Swift Creek Complicated Stamped remains the dominant pottery type, but with slightly increased frequencies of red-filmed, incised, and punctated pottery of the Weeden Island series (see Supplemental Table 4). Pluckhahn (Reference Pluckhahn2003:195–200) has suggested that the uniformity of midden assemblages associated with this and Phase 1 indicates a high degree of community cohesion, reinforced through ceremonies on the central plaza and in association with the mounds.
The ceramic cache on the east side of Mound D, with its mix of Swift Creek and Weeden Island vessels that were almost certainly deposited at the same time (Sears Reference Sears1953, Reference Sears1956:11–12), may also date to Phase 2. Three of the four dates we have on this cache overlap in the interval from cal AD 570 to 655. The most recent of these, a TL date (UW-3231) on a Swift Creek sherd, provides a TPQ of cal AD 570 to 870 (95.4%) for the cache. This is consistent with contemporary understanding of the spread of Weeden Island pottery (Smith Reference Smith2009:92–93) and positions the major construction in Phase 2 or 3.
Mound H, one of the two small platform mounds, would also have been added in Phase 2 or 3; the TPQ of cal AD 579 to 767 (95.4%) is provided by the radiocarbon date (Beta-164309) on charred twigs recovered by Larson (Reference Larson1952) from a feature below the mound. The summit of Mound H displayed evidence for burning and irregularly scattered postholes (Larson Reference Larson1952; Sears Reference Sears1956:13), a pattern that Knight (Reference Knight1990, Reference Knight, Dietler and Hayden2001) has described as typical of Woodland period platform mounds and interpreted as evidence of periodic feasting associated with the formation and maintenance of intervillage alliances.
Smith (Reference Smith2009:145–146) characterizes the Kolomoki II phase as marked by high mobility and dispersed settlement, perhaps initiated in response to a prolonged period of below-average rainfall from AD 388 to 420 and persisting through a second drought interval from AD 659 to 724. However, she also sees evidence for annual or semiannual aggregation at larger sites such as Kolomoki. The notion that the Phase 2 village at Kolomoki served as a periodic aggregation point for groups that resided elsewhere is consistent with Pluckhahn's (Reference Pluckhahn2003:185–189) suggestion of less permanent settlement of the inner village, perhaps seasonally or in association with ceremonies. Still, there also appears to have been a resident population, as indicated by Pluckhahn's (Reference Pluckhahn2003) excavation of a cold-weather pit structure in Block A; Palmer's account suggests that similar structures were present in this area. The associated botanical assemblage indicates year-round settlement, comprising plant remains associated with both warm (domesticated grasses and wild starchy/herbaceous and fleshy fruit seeds) and cool (nutshell) seasons (Bonhage-Freund Reference Bonhage-Freund2002; Pluckhahn Reference Pluckhahn2003:148–165; Pluckhahn, Compton, and Bonhage-Freund Reference Pluckhahn, Matthew Compton and Bonhage-Freund2006).
Although it may seem counterintuitive, Kolomoki's location in the uplands may have been a draw in periods of drought. A number of authors have commented on the abundance of springs in the vicinity. Valliant's letter describes the site as lying on a peninsula bordered by “strong springs all in easy reach, providing a water supply unusually easy of access for a large town” (Valliant to the Director, Department of Archaeology, October 28, 1937). Sears described the site as occupying an “elevated tongue of land” surrounded on three sides by spring-fed streams and further observed that “since these springs flow freely in the driest spells, always with cold clear water, they are probably one of the more important reasons for the intensive occupations of the site” (1951b:1).
The Phase 2 village at Kolomoki was poised to accommodate visitors, for both residence and ceremonies. The inner village measured about 300 m wide by 400 m long and defined a plaza about 150 m wide by 250 m long. In general outline, the community plan was similar to contemporaneous “ring middens” found throughout the region (Pluckhahn 2010c; Russo, Hadden, and Dengel Reference Russo, Hadden and Dengel2009; Russo, Schwadron, and Yates Reference Russo, Schwadron and Yates2006; Russo et al. Reference Russo, Dengel, Shanks and Stanton2011; Russo et al. Reference Russo, Dengel, Shanks and McFeaters2014; Stephenson, Bense, and Snow Reference Stephenson, Bense, Snow, Anderson and Mainfort2002; Willey Reference Willey1949:368–369). In size, however, it was already at least three times larger than the average village of its time. Stephenson, Bense, and Snow (Reference Stephenson, Bense, Snow, Anderson and Mainfort2002:342) describe a typical Swift Creek ring midden as about 100 m in diameter, consistent with Willey's estimate of “30 to 100 meters in diameter” (1949:368–369). Russo and colleagues (Reference Russo, Dengel, Shanks and Stanton2011:27) provide similar dimensions for a range of ring middens in northwest Florida.
The community plan at Kolomoki was exaggerated not only in scale but also in formal complexity. Many ring middens in the region are associated with small burial mounds; some (e.g., McKeithen) are also associated with small platform mounds (Milanich et al. Reference Milanich, Cordell, Knight, Kohler and Sigler-Lavelle1997). But the community plan that had developed at Kolomoki by Phase 2 is unique for the number, size, and elaboration of associated mounds. As Sears observed, the arrangement of the plaza fronting the large platform mound with the two burial mounds due west and the village surrounding together imply “a definite intent in city planning from all points of view” (1956:13).
The Phase 2 community at Kolomoki thus combined elements of both natural and imagined communities. It was a permanent home for some and a temporary, well-watered refuge for others. But it was also a community of exaggerated size and formality that would have impeded the sort of face-to-face interactions we normally associate with village life. Sears alluded to this contradictory nature in his observation that the village plan “was motivated far more by the ceremonial aspects of community life than by any such practical considerations as inter-house communication” (1956:94). Given this tension, it is not surprising that our modeling suggests that the formal, U-shaped village was relatively short-lived. Phase 2 lasted between 32 and 226 years (95% probability), probably between 57 and 155 years (68% probability). This is in line with Sears's estimation that the Kolomoki-period village “cannot have lasted much over a century at normally accepted scales” (1956:14).
The community plan at Kolomoki was radically restructured in the transition to Phase 3, which our modeling suggests started between cal AD 670 and 740 (95% probability), probably between cal AD 679 and 712 (68% probability). This phase comprises seven dates, all from the outer village (Figure 7c). The absence of dates associated with this phase from the inner village suggests that the earlier community plan was deliberately and perhaps suddenly abandoned in favor of a huge, discontinuous circular village.
The reorganization of the community at Kolomoki during Phase 3 is roughly coincident with recently documented changes at other sites in the Weeden Island area. Russo and colleagues (Reference Russo, Dengel, Shanks and McFeaters2014) have suggested similar shifts in the village plans at several sites in the panhandle of Florida. Farther south, Wallis, McFadden, and Singleton (Reference Wallis, McFadden and Singleton2015) note a disruption in the configuration of the Garden Patch site around cal AD 615. Sassaman and colleagues (Reference Sassaman, Wallis, McFadden, Mahar, Jenkins, Donop, Monés, Palmiotto, Boucher, Goodwin and Oliveira2017) suggest that the nearby Shell Mound site was abandoned around the same time. Similarly, Pluckhahn, Thompson, and Cherkinsky (Reference Pluckhahn, Thompson and Cherkinsky2015) describe a depopulation of the village at Crystal River beginning around the mid-sixth century.
Phase 3 is contemporaneous with Smith's Hare's Landing phase, named for a site excavated by Caldwell (Reference Caldwell1978). Seemingly contrary to the new evidence cited above for the Weeden Island area, Smith has characterized this interval as one of rebounding population, higher residential stability, and “increased and prolonged extra‐regional communication” (2009:116) based on regional settlement data and a trend toward higher decorative diversity in ceramic assemblages. Perhaps this phase began with a reorganization of settlement, followed by rebounding population.
Assemblages associated with this phase at Kolomoki are mostly consistent with Smith's (Reference Smith2009:113–114) valley-wide seriation, with higher frequencies of red-filmed, incised, and punctated pottery of the Weeden Island series than in previous phases (Pluckhahn Reference Pluckhahn2003:17–22; see Supplemental Table 4). Pluckhahn (Reference Pluckhahn2003:207–212) has interpreted the increasing diversity of ceramics, including the presence of some elaborate serving vessels identified as prestige wares (Cordell Reference Cordell1984; Kohler Reference Kohler1976, Reference Kohler, Nassaney and Cobb1991; Milanich et al. Reference Milanich, Cordell, Knight, Kohler and Sigler-Lavelle1997), as evidence for the greater autonomy of households, coincident with a decline of centralized authority indicated by a reduction in mound construction. Although Kolomoki is located near the northern periphery of the Weeden Island tradition, petrographic analysis suggests that Kolomoki potters may have produced a substantial portion of the prestige wares found on sites elsewhere in the region (Pluckhahn and Cordell Reference Pluckhahn and Cordell2011).
The northern and southern arcs of the Phase 3 outer village are each about 500 m long by at least 50 m wide; the eastern arc is roughly 300 m long by 100 m wide. Together, these three segments define an area around 850 m in diameter. Weeden Island ring middens are generally larger than their earlier counterparts; examples in north and northwest Florida typically range from around 100 to 250 m in diameter (Russo et al. Reference Russo, Dengel, Shanks and Stanton2011); McKeithen is around 450 m in diameter (Milanich et al. Reference Milanich, Cordell, Knight, Kohler and Sigler-Lavelle1997). The Phase 3 village at Kolomoki was thus more than three times the size of a typical Weeden Island village and roughly double the size of its closest peer. The size and formality of the village may have been augmented by the construction of the arcing enclosure, at least on the southern end. West, Pluckhahn, and Menz (Reference West, Pluckhahn and Menz2016) have elsewhere described this village plan as “hypertrophic,” in the same sense that artifacts are sometimes made in exaggerated size, to the point of sacrificing utilitarian function (e.g., Clark Reference Clark and Wailes1996; Malinowski Reference Malinowski, Evans-Pritchard, Firth, Malinowski and Schapera1934; Sassaman and Randall Reference Sassaman and Randall2007). Even more so than the inner village of Phase 2, the Phase 3 community was structured so as to minimize daily interactions among residents of different segments of the village. Nevertheless, an overall sense of community identity was maintained through the formal plan, with the circular village centered on the mounds and plaza.
Menz (Reference Menz2015) has identified variations in the lithic assemblages from the northern and southern arcs of the outer village. Specifically, the former is more strongly associated with local cherts, and the southern arc, with milky quartz (Menz Reference Menz2015:79–83), the origin of which is uncertain but probably not immediately local. West's (2016:142–143) comparison of artifact densities and feature volumes and densities suggests more permanent occupation of the north. Botanical assemblages reveal that the southern arc was limited to only warm-season resources. It thus seems that the northern arc of the outer village remained permanently settled by a group of related households, while the southern arc accommodated more distant relations for shorter-term visits in the spring or summer.
Those visits undoubtedly included the rites associated with the construction of mortuary and platform mounds. We noted above that Mound D dates to either this or the preceding phase. Just as the Phase 3 community at Kolomoki represents an exaggerated copy of a village plan common to the region, Mound D is an oversized and embellished version of the typical Swift Creek and Weeden Island burial mound.
Mound A, a greatly exaggerated copy of the small platform mounds relatively common to Middle and Late Woodland sites in the region (see Jefferies Reference Jefferies and Hally1994; Knight Reference Knight1990, Reference Knight, Dietler and Hayden2001; Pluckhahn 2010c), was also completed in Phase 3. We obtained a date of cal AD 680 to 770 (95.4%) on fragments of a “charred post” Palmer (Reference Palmer1884) recovered in a 12 × 12 ft square pit excavated from the southern third of the summit. He described the post as “inserted in the earth,” indicating a possible association with a “rather hard floor of two inches of compact red sand” that was also observed in this unit (Palmer Reference Palmer1884:144). However, his profile places the post a few feet above the floor, at a depth of around 1.5 m (5 ft) below the summit. Wood and Pluckhahn (Reference Wood and Pluckhahn2017:13) recently used terrestrial lidar mapping to calculate the volume of Mound A; at more than 67,000 m2, it is probably the largest extant Woodland period mound in eastern North America and perhaps second only to Mound A at Poverty Point among all pre-Mississippian mounds. In total, the mound would have required almost 90,000 earthmoving days, enough to occupy a 200-person workforce for well over a year. Even granting the possibility that the mound was initiated in earlier phases, the construction must have drawn on the labor of people from great distances, given that settlement in the vicinity of the site appears to have been very light (Belovich et al. Reference Belovich, Brose, Weisman and White1982:475; Knight and Mistovich Reference Knight and Mistovich1984:230; Pluckhahn Reference Pluckhahn2003:39–43; Steinen Reference Steinen1976, Reference Steinen1995, Reference Steinen, Williams and Elliott1998).
Thus, both mounds and village may have been part of a major restructuring of the community at the onset of Phase 3 to accommodate distant kin and kith. But whatever processes precipitated this restructuring did not sustain for very long; our model indicates that the hypertrophic outer village at Kolomoki may have been even more unstable than the smaller (if still oversized) inner village of Phase 2. Phase 3 lasted less than 212 years (95% probability), probably between 7 and 128 years (68% probability).
Phase 4 began between cal AD 715 and 912 (95% probability), probably between cal AD 729 and 888 (68% probability). This phase at Kolomoki corresponds roughly with Smith's Late Weeden Island and Sycamore phases, which she (2009:172) associates with a valley-wide population crash induced by a period of below-average rainfall between AD 811 and 891. Settlement of the valley appears to have contracted south, with Kolomoki now occupying the northern margin of an area of heavy but dispersed settlement (Pluckhahn Reference Pluckhahn2003:40–44). At the Sycamore site and elsewhere to the south of Kolomoki, assemblages are dominated by Wakulla Check Stamped (Milanich Reference Milanich1974; Smith Reference Smith2009:87), but the frequency of this type is attenuated with increasing distance north in the valley (Huscher Reference Huscher1959:112; Schnell Reference Schnell1981:21; Smith Reference Smith2009:59). Check stamping is a reliable but relatively infrequent marker of Phase 4 assemblages at Kolomoki (Pluckhahn Reference Pluckhahn2003:17–19, 2010b, Reference Pluckhahn2011).
The eight dates assigned to this interval were retrieved primarily from excavations in the area south of Mound A, although a few are associated with the northern arc of the outer village (Figure 7d). The pattern indicates less regard for community structure than in previous phases (Pluckhahn Reference Pluckhahn2003:212–219). Increases in storage associated with an ephemeral, single-set post structure in Block D (similar in form and size to one at Sycamore) suggested to Pluckhahn (Reference Pluckhahn2010b, Reference Pluckhahn2011, Reference Pluckhahn and Carballo2013, Reference Pluckhahn, Gilmore and O'Donoughue2015) that settlement at Kolomoki was impermanent during this interval. However, the macroplant assemblage included both warm-season plants and cool-season mast, revealing that the site was still occupied at various times of the year.
Phase 4 lasted no more than 317 years (95% probability), probably between 111 and 281 years (68% probability). The longer length of this phase may be partly a factor of calibration; Phase 4 corresponds to a portion of the calibration curve with considerable wiggle.
Kohler (Reference Kohler1976, Reference Kohler, Nassaney and Cobb1991:105) argued that the decline of the McKeithen site around this same time was due to an increase in shifting maize cultivation, as associated population dispersal and increased local autonomy reduced the importance of trade and elite authority. No maize macroplant remains were recovered from Block D at Kolomoki (Bonhage-Freund Reference Bonhage-Freund2010), although maize pollen and phytoliths were identified from a few features (Yost and Scott-Cummings Reference Yost and Scott-Cummings2010; see also Pluckhahn Reference Pluckhahn2010b, Reference Pluckhahn2011, 2015). Still, the limited commitment to maize agriculture here does not seem sufficient to explain the extensive changes in settlement at Kolomoki and farther afield. With the decline of Kolomoki, the central portion of the lower Chattahoochee Valley appears to have been a largely unoccupied zone between denser habitations to the north and south until Mississippian period migrants resettled it in the 1200s (Blitz and Lorenz Reference Blitz and Lorenz2006).
Conclusion
Bayesian modeling of radiocarbon and TL dates from Kolomoki reveals a complicated biography. Relative to the size of the site, the number of dates from off-mound contexts remains relatively low. In addition, most of the mounds are dated with only a small number of measurements, several of which are imprecise and most of which are of only general provenience. Finally, the chronology is impacted differentially by the resolution of the radiocarbon calibration curve. There is thus ample opportunity for further refinement of our chronology through a more robust dating program; still, the contrast between this revised chronology and previous ones is dramatic and likely to stand in outline, if not in exact detail.
In contrast to previous assumptions of gradual change, our modeling indicates not only continuity across one or two long periods but also shorter intervals marked by radical transformations. During Phase 1, which probably began between cal AD 78 and 233 (68% probability), an apparent vacant ceremonial center transitioned gradually over the course of several centuries into a small residential community. In Phase 2, probably beginning between cal AD 557 and 636 (68% probability), this community was elaborated into a formal arrangement of mounds and a circular village. This arrangement lasted no more than a few generations before, with the transition to Phase 3 between cal AD 679 and 712 (68% probability), the village expanded to a discontinuous oval nearly a kilometer across. This change in the village plan corresponds with the completion of Mound A, probably the largest platform mound of this time period ever constructed (Wood and Pluckhahn Reference Wood and Pluckhahn2017:10). Mound D, the most elaborate of the hundreds of Weeden Island burial mounds on the Gulf Coast, appears also to have been completed in this interval. But Phase 3 may have lasted a relatively short time before the formal community plan was abandoned, in favor of the smaller and less structured habitations associated with Phase 4, probably beginning between cal AD 729 and 888 (68% probability).
Our revised chronology reveals that the community at Kolomoki was periodically reimagined, sometimes dramatically. The Phase 2 circular village, an oversized copy of the community plan common to the region, seems to have been designed to simultaneously constrain and enable social interaction among dispersed groups that periodically aggregated at the site, drawing them together for the pooled labor required for mound construction and attendant ceremonies while also keeping houses and house clusters at arm's length. The further elaboration of this plan into the oversized village of Phase 3, coupled with the completion of Mounds A and D, suggests to us that by this point the community was more imagined than natural in the sense of spatial and social cohesiveness. The timing of this change in relation to settlement shifts at mound sites to the south suggests a broader shift in the social construction of communities in favor of the inclusivity of the imagined, with Kolomoki indexing (sensu Peirce Reference Peirce and Buchler1955) this region-wide integration. The more seasonal, less intensive habitation of the southern arc of the outer village relative to the north is intriguing given that many visitors might have come from this direction based on settlement trends (Pluckhahn Reference Pluckhahn2003:40–44), ceramic sourcing studies (Pluckhahn and Cordell Reference Pluckhahn and Cordell2011; Wallis, Pluckhahn, and Glascock Reference Wallis, Pluckhahn and Glascock2016), and lithic raw material distributions (Menz Reference Menz2015:79–83). Coupled with the bilateral north-south symmetry of the community plan, it calls to mind the directional associations of moieties and their migrations to pueblos in the Southwest (Fowles Reference Fowles2005; Ortman Reference Ortman, Varien and Potter2008, 2012). Cameron (Reference Cameron2013; see also Kowalewski Reference Kowalewski and Pluckhahn2006, Reference Kowalewski and Birch2013) has recently noted that the fusion of smaller social groups into larger villages in this region and elsewhere was a process requiring considerable negotiation and frequently resulting in inequalities; perhaps not surprisingly, such aggregations were prone to sudden fissioning. The spatially divided and socially differentiated nature of Kolomoki's Phase 3 village suggests that building a community of this scale and at this juncture was likewise a highly negotiated undertaking and, given its short duration, perhaps inherently unstable. The incorporation of seasonal occupants and visitors for ritual occasions suggests that Kolomoki's residents at any given time may have held manifold group affiliations that were only temporarily subsumed by “the image of their communion” (Anderson Reference Anderson2006:6).
To an extent, archaeologists have long recognized the limitations of viewing Kolomoki as a natural community defined by spatial propinquity. Sears was cognizant of the oversized scale and formality of the inner village and the limitations these must have placed on the personal interactions we associate with ordinary village life. Pluckhahn (Reference Pluckhahn2003:204–205, Reference Pluckhahn and Alt2010a, Reference Pluckhahn and Carballo2013) has described the tension between the ethos of community, as evidenced by the monotony of material culture and the inclusivity of public architecture, and the possible appropriation of this ethos by segments of the village. Yet the assumption of gradual change that underlay previous chronologies undermined our understanding of the extent to which community may have been reimagined by social actors under particular historical circumstances.
Anderson recognized that the imagined community was not limited to modernity: “All communities larger than primordial villages of face-to-face contact (and perhaps even these) are imagined” (2006:6). Archaeology has validated the claim that smaller communities of the past were imagined, in some cases in support of the interests of elites (Pauketat Reference Pauketat, Canuto and Yaeger2000; Pauketat and Emerson Reference Pauketat, Emerson and Robb1999), in other cases in opposition to such concerns (Davis-Salazar Reference Davis-Salazar2003; Wernke Reference Wernke2007), and in still others to serve the welfare of both elite and commoner, colonizer and colonized (Woolf Reference Woolf1997). Communities were imagined even where they would seem to have existed in natural isolation (Rainbird Reference Rainbird1999) or where dispersed settlement may have been an impediment to common social identity (Hutson et al. Reference Hutson, Hixson, Magnoni, Mazeau and Dahlin2013).
At the same time, an imagined community is not the same as an imaginary community, or one that simply did not exist, as Raab (Reference Raab2015:190) notes. Imagined communities also have an objective component: “The identity of a nation may not be timeless, but at a certain time and place, this identity (however defined) becomes a perfectly real and non-fictional component of historical subjects” (Raab Reference Raab2015:190). Consistent with this, recent authors, while granting that past conceptions of community “may have lacked sophistication” (Gerritsen Reference Gerritsen and Bintliff2006:146), take exception to such a hard-and-fast dichotomy between natural and imagined. Gerritsen (Reference Gerritsen and Bintliff2006:146–147) laments the narrow focus on identity inherent to imagined community approaches, wondering whether there is room for “traditional” interests such as the manner in which communities are influenced by ecology and economy or by articulation with larger social units and outside historical forces. Varien and Potter defend the assumption that people who lived in close proximity “interacted in the context of copresence” (2008:3–4) while acknowledging that we should not assume the nature of that interaction. Harris suggests that “the most useful approaches are those that link the two together, exploring both face-to-face interactions and the senses in which these communities were understood as dynamic, transformative and emergent through practice” (2014:79). In the case of Kolomoki, the oversized Phase 2 and Phase 3 villages appear to have served as homes to both resident populations and seasonally mobile groups, regional centers that assumed particular importance during times of drought. The residents of these villages clearly constituted a community, not only in the sense of spatial propinquity but also in the shared labor they expended in the construction and maintenance of mounds, as well as in attendant ceremonies. Understanding when and how natural communities become imagined ones requires that we know how large and complex archaeological sites, such as Kolomoki, changed over time.
Acknowledgments
Funding for work at Kolomoki has been supported by grants from the National Science Foundation (Grant No. 1111497), the National Geographic Society, the Humanities Institute at the University of South Florida, and the Society for Georgia Archaeology; a travel scholarship from the United Faculty of Florida; a John S. Freeman Award from the Department of Anthropology at the University of South Florida; and awards from local chapters of the Florida Anthropological Society, including the Time Sifters Archaeological Society of Sarasota and the Warm Mineral Springs/Little Salt Spring Archaeological Society of North Port. We thank the National Museum of Natural History, the Georgia Department of Natural Resources, Kolomoki Mounds State Historic Park (particularly Lauren Lambert and Jeff Bryant), the US Army Corps of Engineers, and the University of Georgia Laboratory of Archaeology for permission to work at Kolomoki and for access to artifact collections. For permission to work on privately owned portions of the site, we thank Mike and Meredith Whitehead, Buddy Jenkins, and Judy Moore. For assistance with fieldwork, we thank many students and volunteers but especially Christine Bergmann, Valeria Segui, and Liz Southard. For identification of plant species, we thank Mary Theresa Bonhage-Freund and Anna Dixon.
Data Availability Statement
Artifacts, notes, and other documentation from excavations at Kolomoki will be curated at the University of Georgia Laboratory of Archaeology, Athens.
Supplemental Material
For supplementary material accompanying this article, visit https://doi.org//10.1017/aaq.2017.62.
Supplemental Table 1. Additional Context Information and Commentary on Radiocarbon Dates.
Supplemental Table 2. Additional Context Information and Commentary on Luminescence Dates.
Supplemental Table 3. Summary of the Final Bayesian Model (Model 4.5) for Village Dates.
Supplemental Table 4. Relative Frequencies of Ceramic Surface Treatments in Dated Assemblages (Menz Reference Menz2015; Pluckhahn Reference Pluckhahn2003; West Reference West2016).
Supplemental Table 5. Summary of Dates for Mounds A, D, E, and H.
Supplemental Figure 1. Summary of iterations of modeling of dates from the village. All of these models were structured the same as the final model (see Supplemental Figure 2), except for the distribution of dates as shown.
Supplemental Figure 2. Plot of the final model of dates from the village. The distribution of prior likelihoods is shown in light gray, and the distribution of posterior density estimates is shown in dark gray, with the 95% range indicated by bars below the distributions.