


I. Introduction
It may come as no surprise that many scholars, researchers, and analysts leave the visual component of their communication efforts to the last minute. Yes, many make tables, graphs, and other aids as they learn about and analyze their data, but when the time comes to show those findings in a presentation or written report, the visuals are often thrown together without carefully considering the needs of the audience or readers (such as their expertise with the content) or what type of visual is best.
As you work with your data, it’s best not to start creating your graphs and tables at the very end. First, consider whether a visual is needed at all: many graphs are added to reports simply because the author believes the text needs a visual. Every visual should have a purpose. It should further the argument you are making or the story you are telling. You wouldn’t include unnecessary or extraneous variables in your regression models, nor would you include unnecessary words in your written text, so take the same approach with your tables, graphs, and diagrams. Second, remember that your reader may be seeing your content for the first time. Consider that you may need to explain both the content and the visualization type. You might include complex jargon or a dense scatterplot in an academic journal, but that same visual type may not work in a report to a state policymaker (Schwabish Reference Schwabish2020a, Reference Schwabish2020b).
The value of better, more effective tables and visualizations is not just that they “look better” or “pop.” Instead, they tap into humans’ innate ability to better recognize and recall content presented visually rather than as a dense table or bullet points. Creating better tables may take more time to create, and the people who benefit most may not even be readers of the Journal of Benefit-Cost Analysis (JBCA). Rather, consider how much a better table might help a government analyst or someone less familiar with the topic.
As you consider whether and how to communicate your work to a broader audience, create a strategic plan for your entire project. Effective data communication starts with good communications planning, and like any strategic planning, that starts with a goal. Who is your work for, and what do you want it to accomplish? (For more guidance, see Schwabish Reference Schwabish2020b.)
Because authors who publish in JBCA seem to prefer tables to charts, this article focuses on better table design. Across nearly 200 separate articles and 5,000 pages of JBCA back to 2010, authors published more than 750 tables and 300 figures. Among articles with at least one table, the average number of tables is 4.6; among those with at least one graph, the average number of graphs is 2.9. Tables tend to show summary statistics or regression results, though others show some smaller simulations or a smaller set of numbers.
Tables are a unique form of visualizing data because, unlike many charts, they are not usually intended to give a quick, visual representation of data. Instead, tables are useful when you want to show the exact values of your data or estimates. They are not the best solution if you want to show a lot of data or if you want to show the data in a compact space, but a well-designed table can help your reader find specific numbers and discover patterns and outliers.
II. The Proper Anatomy of a Table
Before we talk about better table design, let’s identify the different components of a table. Identifying the different pieces of a table can help us decide on the different style decisions that make a table effective. Some of these style decisions will be subjective and depend on nothing more than your preferences for shading colors, font size, and line width. Other decisions will help the reader more quickly and effectively see the patterns, trends, and outliers you are trying to communicate.
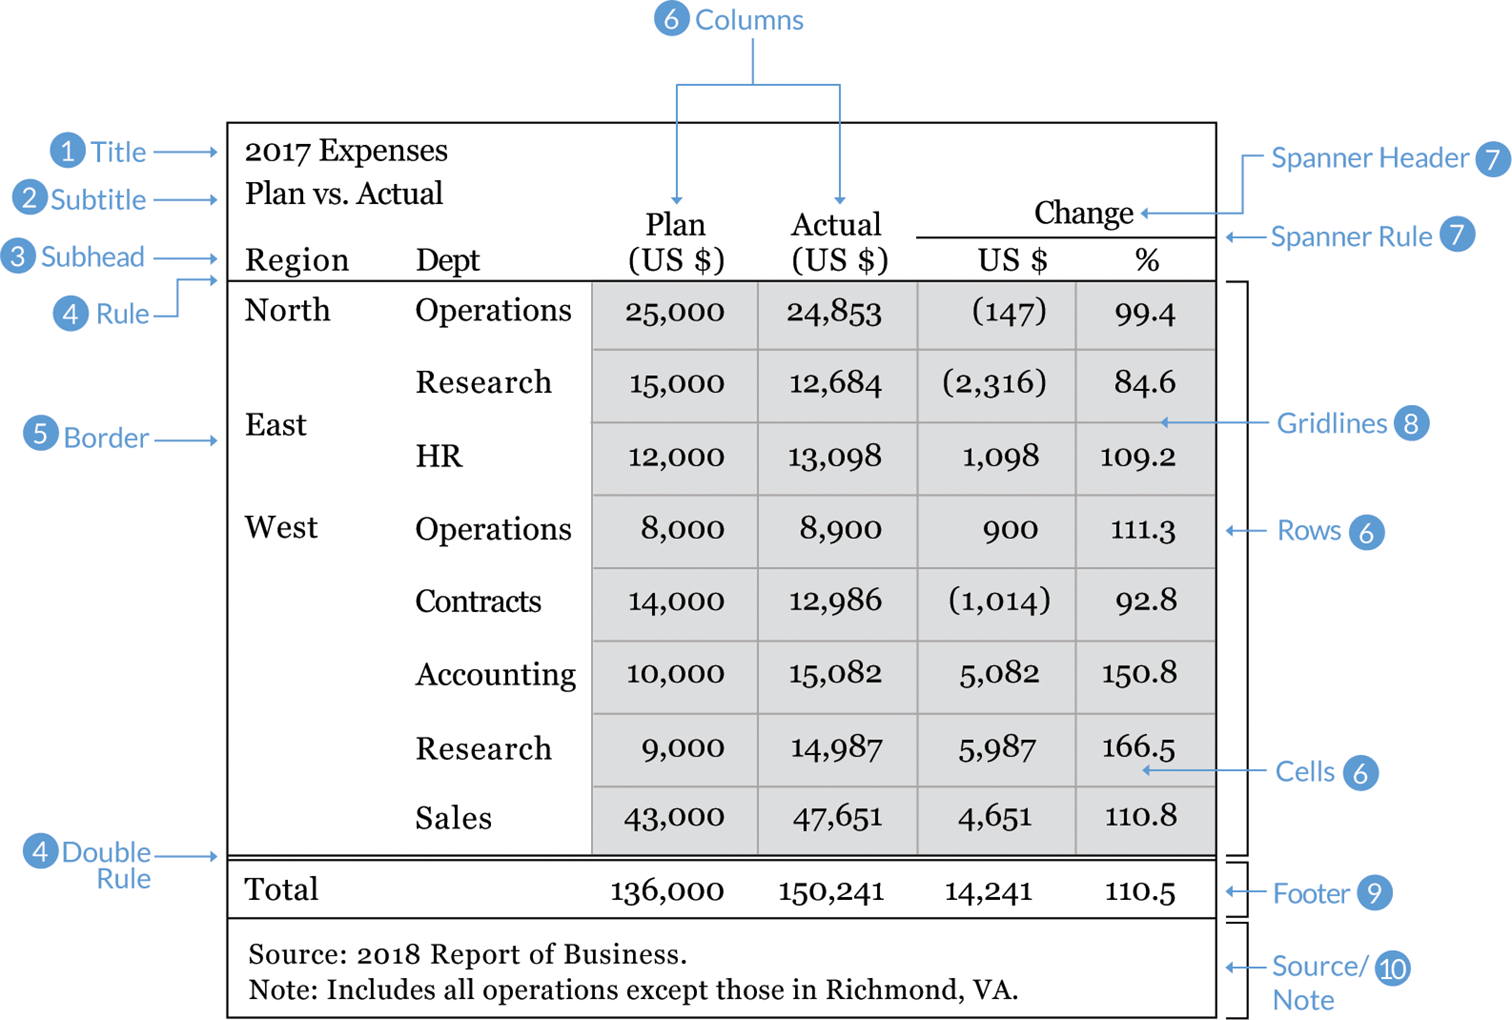
1. Title. Use concise, active titles. “Table 1. Regression Results” is not particularly informative. Instead, guide your reader to the conclusion with a title like “A one-year increase in work experience increases annual earnings 2.8 percent.” Left-aligning the title and subtitle will align with the rest of the table, creating a grid, which is easier to navigate.
2. Subtitle. This sits below the title, often set in a smaller font size or a different color. The subtitle should specify the units of the data in the table (such as “percent” or “thousands of dollars”) or make a secondary point (such as “the experience effect is greater for men than for women”).
3. Stub heads or column heads. These are the titles of your columns. Differentiate these from the rest of the table cells with boldface type or separate them with a line, also called a “rule.”
4. Rules. The lines that separate the parts of the table. At minimum, place rules below the stub heads and between the bottom row and any sources or notes.
5. Borders. Lines that surround the table. Whether to include a border around the whole table depends on how the table is arranged in the rest of the document. Sometimes you need to add a visual differentiator to set the table apart, and in those cases a border is useful. But if too many lines and borders clutter the document, omit the border altogether.
6. Columns, rows, and cells. Columns run vertically; rows run horizontally. The intersecting areas are called cells.
7. Spanner head and spanner rule. The text and line that span multiple columns. Text is usually centered over the columns even if the specific column headers are left- or right-aligned.
8. Gridlines. The intersecting lines within the table that separate the cells. Use a light touch with gridlines—heavy gridlines clutter the table and make it harder for the reader to clearly see the numbers.
9. Footer. The bottom area of a table where you might include a row for the total or average. As with the stub head, we should differentiate this row from the rest of the table. We can do so by bolding the numbers, separating them with a line, or shading the cells with color.
10. Sources and notes. The text below a table containing the citation or additional details or notes to the table. The Modern Language Association style, for example, suggests putting the sources first and the notes second.
III. Ten Guidelines for Better Tables
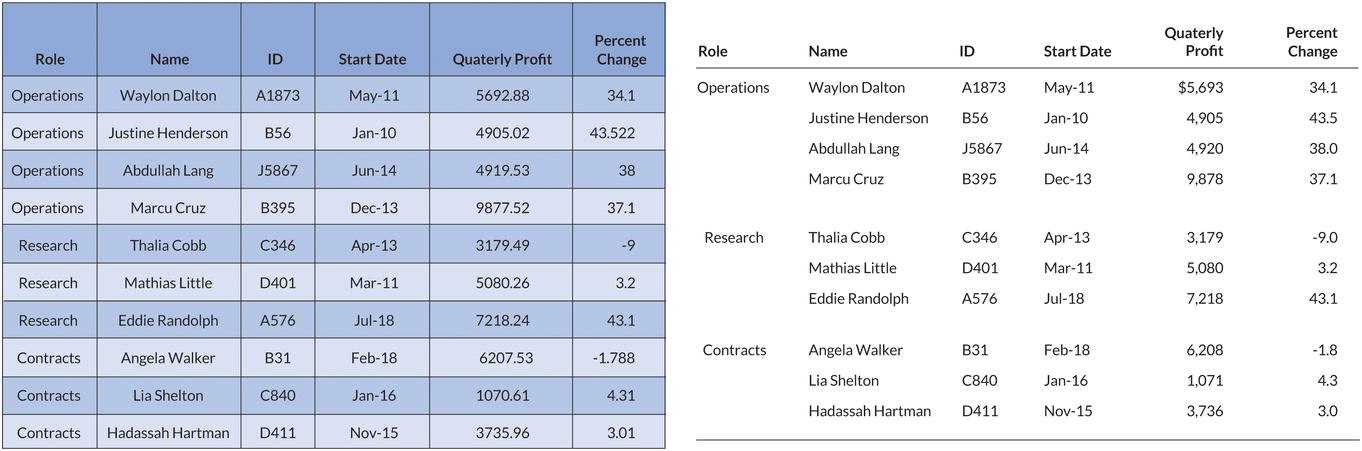
These guidelines will take us from tables that have too much color, too many lines, and clutter to ones that allow readers to easily see the important numbers and patterns. In general, these guidelines will move us from an example table on the left to a much clearer and readable table on the right.
Rule 1. Offset the Heads from the Body
Make your column titles clear. Try using boldface type or lines to offset them from the numbers and text in the body of the table. It should be clear that the heads are not data values but categories or labels. In this example, which shows growth rates in per capita gross domestic product (GDP) for six countries, the column labels are boldface and separated from the data with a single line.

Rule 2. Use Subtle Dividers Rather Than Heavy Gridlines
You can lighten or even remove many of the heavy borders and dividers in your tables. Every single cell border is rarely necessary. For series that show the total, use shading, boldface, or subtle line breaks to distinguish the values.
Notice in the table on the left how the two columns that show the average (between 2007 and 2011 and between 2012 and 2016) blend in with the other columns. At a quick glance we likely don’t notice that there is a break in the annual series. In the version on the right, a light shading in those columns sets them apart.

Rule 3. Right-Align Numbers and Heads
Right-align numbers along the decimal place or comma. We might need to add zeros to maintain the alignment, but it’s worth it so the numbers are easier to read and scan. Here, for example, it is much easier to compare the values in the far-right column, where the numbers are right-aligned, than in either of the other two columns. To maintain the grid layout, the column header is right-aligned with the numbers as well.

Similarly, choose the fonts in your tables carefully. Some fonts use what are called “oldstyle figures,” in which some numbers drop below the horizontal baseline, like the letters p or g or q do. This is fine when numbers are not data, such as when numbering chapters in a novel. But in data tables, oldstyle figures can be distracting and more difficult to read. Always use fonts that have “lining numbers,” meaning all the numerals rest on the baseline and none drop below it.
Notice how the commas and decimal points in this table don’t line up with custom fonts, such as Karla and Cabin. When choosing a font, be mindful that the numerals are not always the same size. Also be aware that oldstyle figures, such as those used in Georgia, drop some of the digits below the horizontal baseline (I’ve added an underline in each cell to make this clear).

Rule 4. Left-Align Text and Heads
Once we’ve right-aligned the numbers, we should left-align the text. The English language is read from left to right, so lining up the entries in that way generates an even, vertical border and is more natural for the reader. Notice how much easier it is to read the country names in the far-right column than in the other two columns.

Rule 5. Select the Appropriate Level of Precision
Precision to the fifth decimal place is rarely necessary. Consider a balance between necessary precision and a clean, spare table. The per capita GDP growth rate, for example, is never reported to five decimals—that would be unnecessary and suggest a level of precision not supported by the data. But don’t use too few digits, either. Reporting per capita GDP growth as whole numbers masks important variation across countries.

Rule 6. Guide Your Reader with Space between Rows and Columns
Your use of space in and around the table can influence the order in which someone reads the data. In the table on the left, for example, there is more space between the columns than between the rows, so the eye is drawn to read the table top to bottom rather than left to right. By comparison, the table on the right has more space between the rows than between the columns, so the eye is more likely to track horizontally rather than vertically. Use spacing strategically to match the order you want your reader to take in the table.

Rule 7. Remove Unit Repetition
Our reader knows that the values in the table are dollars because we told them in the title or subtitle. Repeating the symbol throughout the table is overkill and adds clutter. Use the title or column title area to define the units, or place them in the first row only (remembering to align the numbers along the decimal). If the table contains more than one unit, be sure to make the labels clear.

Rule 8. Highlight Outliers
Rather than showing just 6 countries and 3 years of data in the previous table, what if we need to show 20 countries and 10 years? In this case, we might want to highlight outlier values by making the text boldface, shading it with color, or even shading entire cells. Some readers will wade through all of the numbers in the table because they need specific information, but many readers likely only need the most important values. Guiding them to those important numbers lets them answer their own questions about the data or better understand your argument.

Rule 9. Group Similar Data and Increase White Space
Reduce repetition by grouping similar data or labels. Similar to eliminating dollar signs on every number value, we can reduce some of the clutter in our tables by grouping like terms or labels. In this example, grouping the names of the country regions reduces the amount of information repeated in the first column. We can also use spanner heads and rules to combine the cells and reduce unnecessary repetition. In this example, I’ve also applied some of the other guidelines discussed so far, such as left-aligning text, right-aligning numbers, and using boldface headers and footers.

Although grouping like elements helps reduce the amount of clutter on the page, posting tables online may require some concessions in this regard. If you post tables to websites as images, users will be unable to copy and paste data from the table, and screen readers (which iterate through the table cells and read the values out loud) will be unable to recognize the data values. Instead, because of current constraints in web programming languages and formats, you might need to forgo spanner heads and other special formatting decisions (depending on what tools you use to post your table).
Rule 10. Add Visualizations When Appropriate
We can make larger changes to our tables by adding small visualizations. Just like highlighting outliers with color or boldface, we can add many different small data visualizations to our table to make it easier to navigate and help your reader find the patterns and trends you want to highlight.
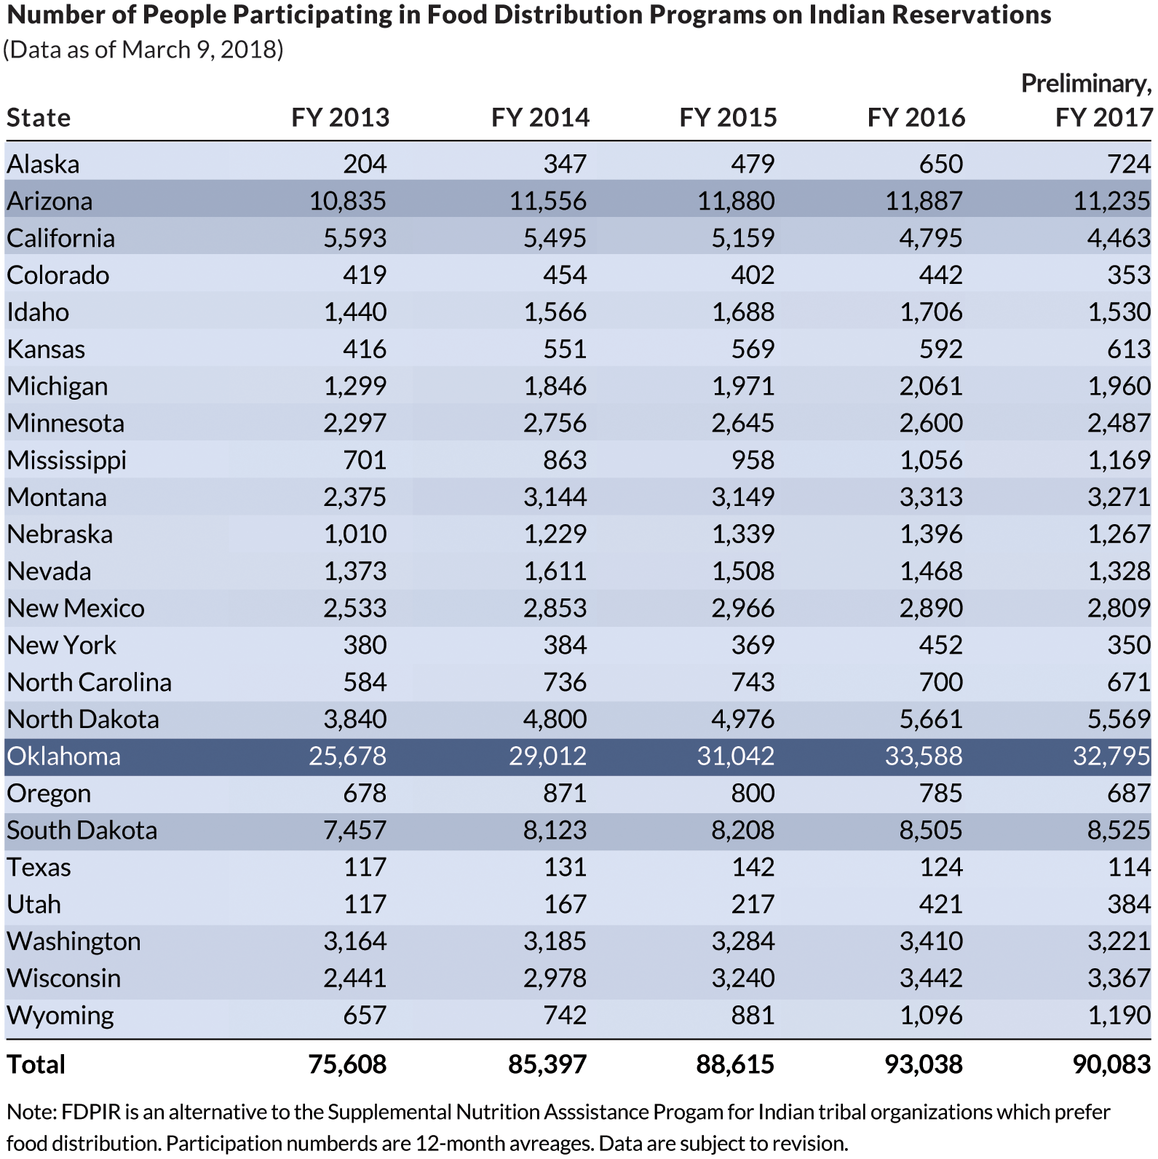
One way to demonstrate this rule is to consider how we might incorporate visuals into this table from the US Department of Agriculture’s Food and Nutrition Service. It shows the number of people who participate in the Food Distribution Programs on Indian Reservations, presenting participation estimates for 24 states over fiscal years 2013 through 2016 as well as preliminary estimates for fiscal year 2017. Note the very dark, thick gridlines, which clutter the table and make it difficult to read. If we zoom in, we can see that the numbers are top-aligned in each cell, which cuts them off ever so slightly.

Bar charts or icons. One simple approach is to use small bar charts or icons to illustrate a series. Quickly examining the original table, it’s tough to tell by how much program participation in Oklahoma exceeds the rest of the states, but after adding a small bar chart, the magnitude becomes much clearer. An alternative is to add an icon to mark increases or decreases over the entire period; the table on the right does so by including an upward or downward triangle to the end of each row.

Heatmap. Another way to add a visual element to a table is to convert it to a heatmap. Heatmaps use colors and color saturations to represent data values. Simply put, a heatmap is a table with color-coded cells. They are often used to visualize high-frequency data or when seeing general patterns is more important than exact values. This table could be reimagined as a heatmap, with lighter blue shades encoding smaller values and darker blue shades encoding larger values.
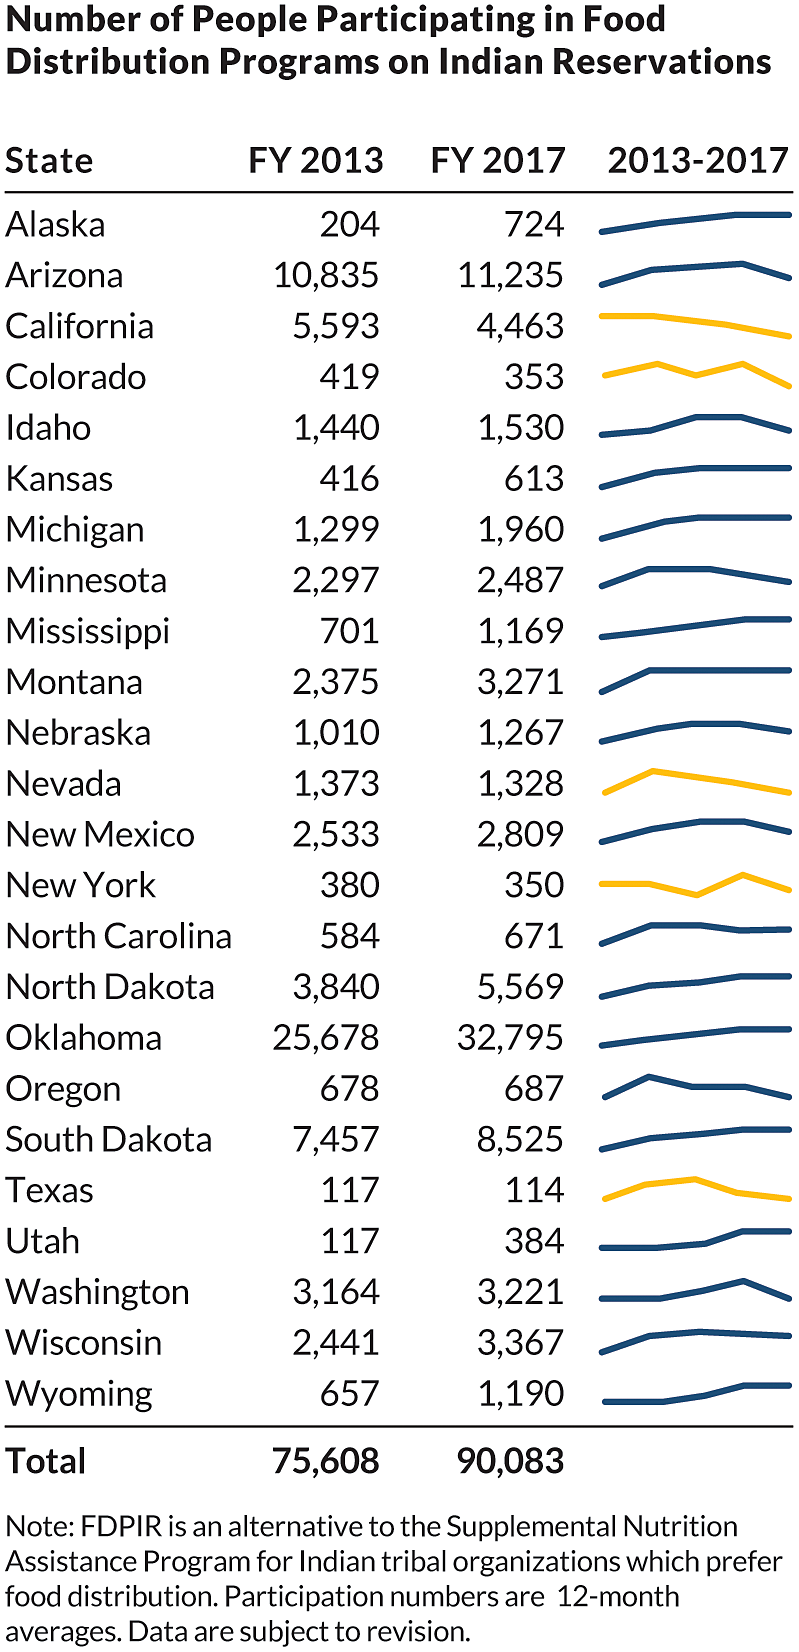
Sparklines. Another option is to add sparklines, small line charts that are typically used in data-rich tables and may appear at the end of a row or column. The purpose of sparklines is not necessarily to help the reader find specific values but instead to track general patterns and trends. In this example, we can show just the values for the first and last year in the data (2000 and 2015) but use the sparkline to help the reader quickly and easily see the pattern in the intervening years. So rather than providing a dense table with 16 data columns, we can use sparklines (with the addition of color to highlight the series that declined over the period) let the reader easily and quickly see the trends.
IV. Table Redesigns
With these guidelines in hand and the emphasis on publishing tables in JBCA, we can now turn to some practical examples of how to improve table design to more effectively communicate the content. The following tables were chosen as a representative set of visuals from JBCA that I felt could be improved. The changes I make are by no means the only ways to modify the tables, but my general approach is to try to follow the guidelines just discussed. In general, there is no “right” or “wrong” approach, just different ways of making improvements. As you develop an eye for better table design, you will develop your own aesthetic, approach, and preferences.
Another caveat about good table design is to consider the formatting decisions journal typesetters and copyeditors often make. At times, these formatting decisions go against best practices and may make the tables more difficult to read than the authors’ original. In addition to individual researchers learning how and why to create more effective tables, journal editors should also work with their staffs to improve the publication process.
My goal in this section is not to criticize these authors or their efforts. With help from the JBCA editor, authors of each table were contacted and their permission granted to use these tables in this article. I am grateful to those authors for granting me permission to use their work here and for the valuable feedback and suggestions they provided.
Example 1. Basic Tables
The first table we can rethink is a basic table of value of a statistical life (VSL) estimates for about a dozen countries around the world. (In simple terms, VSL is an estimate for how much people are willing to pay for improvements in safety or, similarly, reductions in risk.) Eight columns consist of a variety of income, consumption, and VSL estimates, with all but one representing income. There are a few obvious things we might want to change in this table: dollar signs appear in front of nearly every number, which adds unnecessary clutter; the numbers are centered, which makes them more difficult to compare across rows; and the entire table sits within a grid that, though not too visually heavy, could be lightened or removed. The authors include a very nice visual accent by using cell shading and boldface to indicate when future income exceeds the VSL estimate.
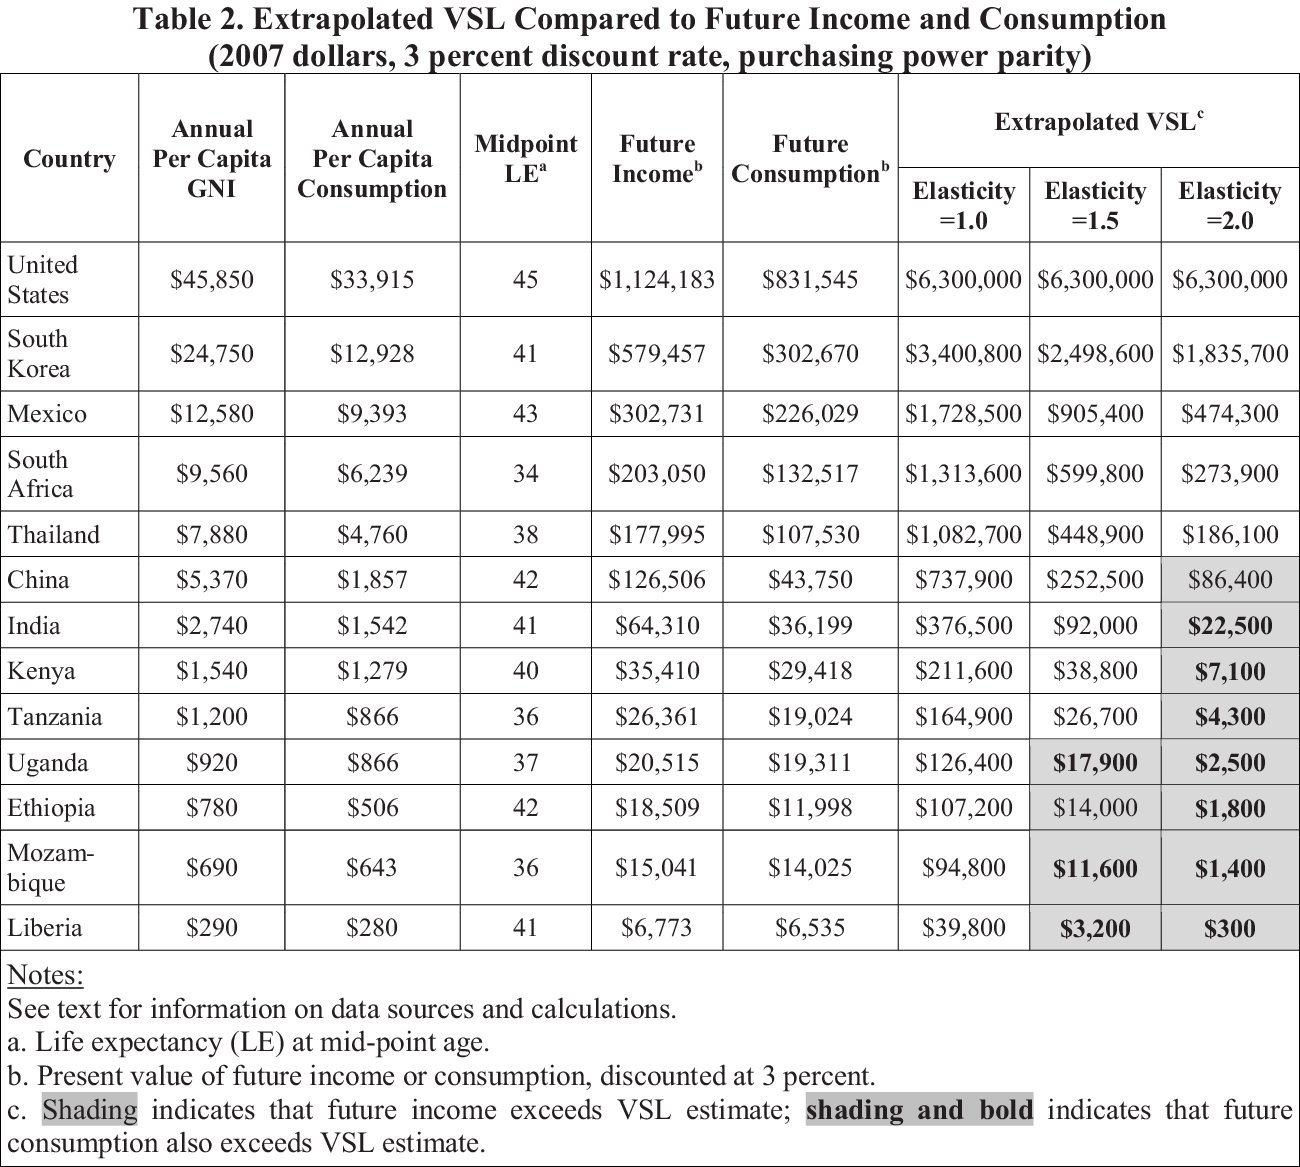
A redesigned version of this table doesn’t completely scrap all the elements. Instead of including dollar signs on every number, we include them only in the first row. We remove the internal grid, making the table lighter and easier to navigate. We left-align the title and subtitle to help build a grid for the entire visual. Column heads are right-justified along with the numbers in the table, which makes all of the content easier to read and compare.

Example 2. Regression Tables
Another common table type in JBCA is one that shows regression results. There are no shortage of tables that show point estimate after point estimate and standard error after standard error. Even though all the numbers are important, such tables can be improved to facilitate easier comparison of values (see also Schwabish Reference Schwabish2016).
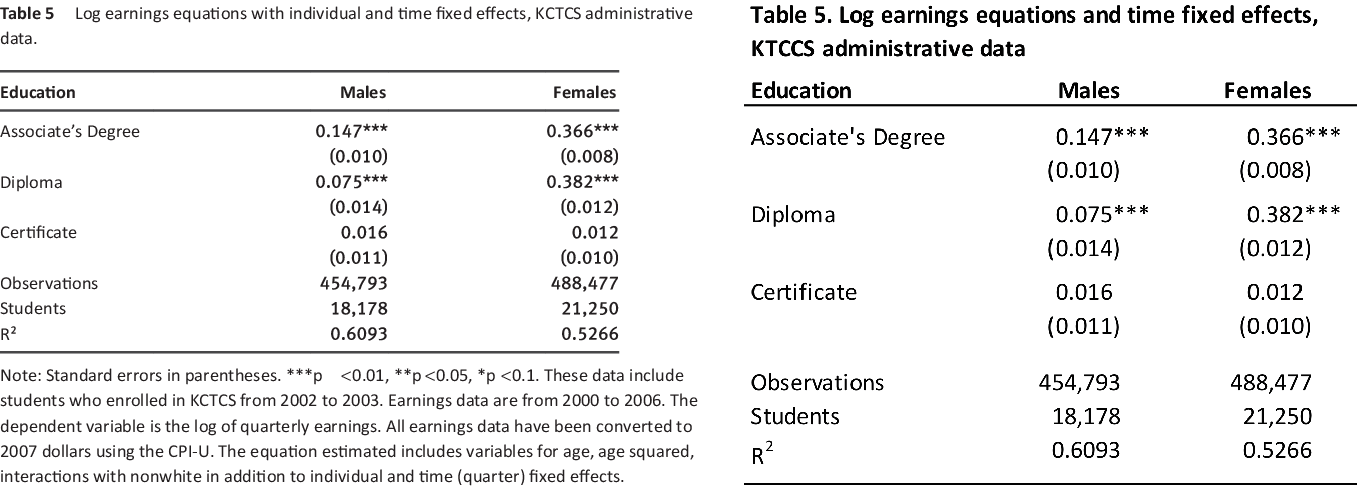
The table on the left (one of the simplest I could find with only two models and three point estimates) includes all of the standard material. But notice how the asterisks push the coefficient estimates in the first two rows to the left, making comparisons with the standard errors and the non–statistically significant estimate in the third column more difficult.
The redesigned table right-aligns all the numbers. Here, there is space for the asterisks and the closing parentheses to the right so that the decimals line up. A bit of space between the point estimates and the number of observations and R2 helps distinguish the two sections from one another. I also think additional white space lets us get away with not aligning these numbers with the point estimates above.
Example 3. Heatmaps
We now move from table redesigns that make changes that are primarily aesthetic to ones that are more substantial and that start adding more visual content. By using more visuals, such as small bar charts, lines, or colors we can highlight important trends or values for our reader.
One approach that I often use is to convert a basic table to a heatmap.
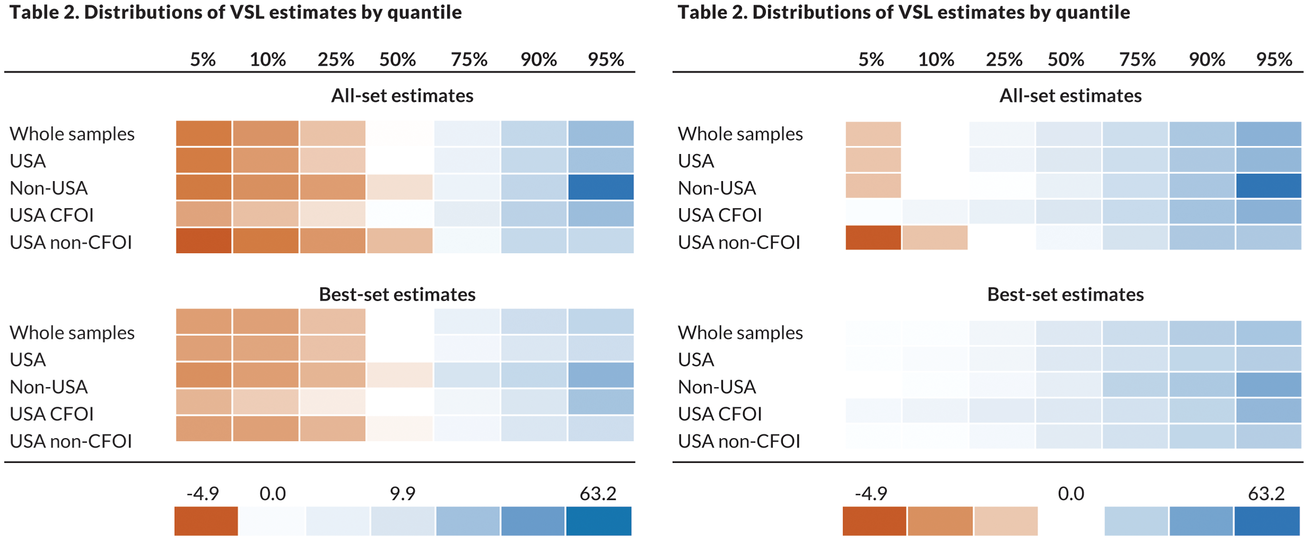
Two different examples can help demonstrate how best to use heatmaps. The first example uses this table that shows the distribution of VSL by quantile. Estimates are split across seven quantile points and separated into two major (all-set and best-set estimates) and six minor categories. In the published table, the negative numbers stand out—the minus sign is pretty obvious—as are the larger numbers to the right side of the table.

A heatmap, however, makes differentiating the values even easier. With this approach, we assign colors to the different values, here varying from orange for the lowest numbers to white for the median value (9.9) to blue for the highest numbers. Three approaches are shown below, one with the numbers included in the cells (notice how they are all aligned along the decimal) and two others without the numbers. The third option changes what the middle value is: rather than 9.9, the actual median value of the point estimates shown, we separate the estimates into positive and negative values and set the middle value to zero. Which approach is better depends on the context and content of the table.

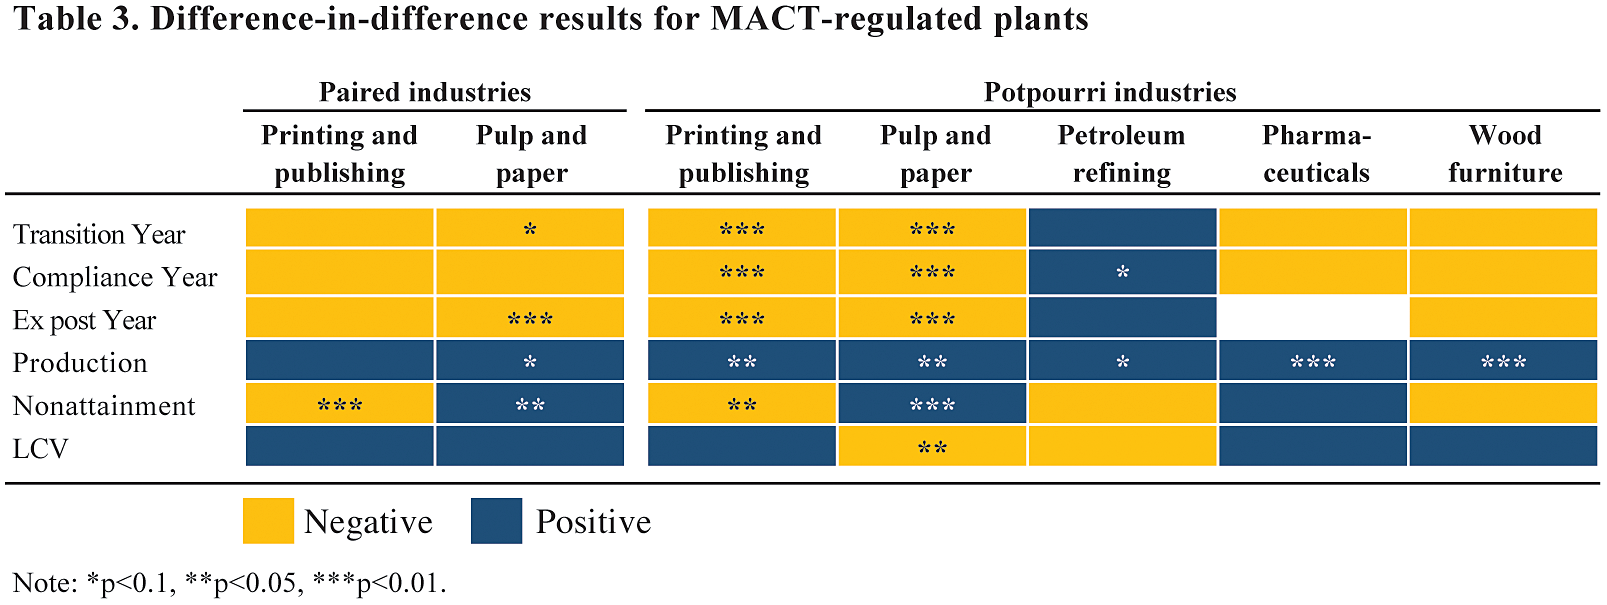
Another scenario to consider a heatmap is when presenting binary data. In this example, difference-in-difference results are summarized into negative and positive values. In many ways, it is refreshing that the authors decided not to show all of the exact point estimates for all of their models—how many readers spend the time necessary to decipher and digest all of the numbers and their meanings in such dense tables? Instead, the authors took a simple approach to summarize the sign (and statistical significance) of the estimates, which is presumably the most important message they wanted to convey.
We can take this one step further. Rather than using the words in each cell, what about using color? Here, yellow (light gray in the printed version) denotes negative values and blue (dark gray) denotes positive values, with statistical significance still indicated with asterisks. (It is best to avoid using a red-green color palette because about 10 percent of the population has a form of color vision deficiency, commonly known as color blindness, that makes discerning between reds and greens difficult).
Again, using color in this way helps draw the eye around the page and makes it easier and faster for the reader to grasp and process the data presented.

Example 3. Using Charts Instead
We have moved from redesigning simple tables with some basic cleanup and organization to heatmaps where we included some color in the cells. Next, we will dramatically modify tables to include charts and graphs. This is not to propose that tables be completely replaced with charts; instead, these examples show how to add more visual content to your tables. This lets the reader obtain the detailed values while more easily seeing the important trends and patterns.
The easiest way to implement this approach is to take a basic table and add a simple line or bar chart. In the table on the left, a reader can easily scan the table and see the values, but it’s harder to see the patterns in the data. It’s also slightly harder to compare the values because they are not aligned along the decimal. By contrast, the version on the right keeps the core table, aligns the numbers along the decimal point, and adds a small bar chart to the right. Here, we can clearly see a larger mass near the center of the values and a large spike in the final category.

In this next example, we move from a simple, basic table to a large, full-page (landscape-oriented) table. Here, with just four columns, the table contains enough names, labels, and numbers to make it difficult to read. The table is also sorted in the least useful way: alphabetically by author. To better understand how the point estimates in these papers compare, I would organize them by some other variable, such as year of publication, country of sample, or method.

To make this table easier to read, we can replace the list of numbers in the far-right column with a bar chart. The first step in this approach is to sort the data, first by country of sample and then by the value of the elasticities. A span chart (a type of bar chart), with the left edge marking the lower range of elasticities and the right edge marking the higher range, shows the gap and the magnitude of the estimated numbers. I have added some light gridlines to segment the table by five country groups.

This approach shows all of the information in the original table. We kept all the labels and all the numbers but added a visual element that makes the elasticity estimates easy to read and compare across the different cited papers. Rather than simply providing all of the information in a dense table that is difficult for anyone to read, this approach helps make an argument, which is the point of including the table.
So far, we’ve seen how to create cleaner tables that make it easier for us to find patterns and extreme values. But what about turning an entire table into a graph or chart?
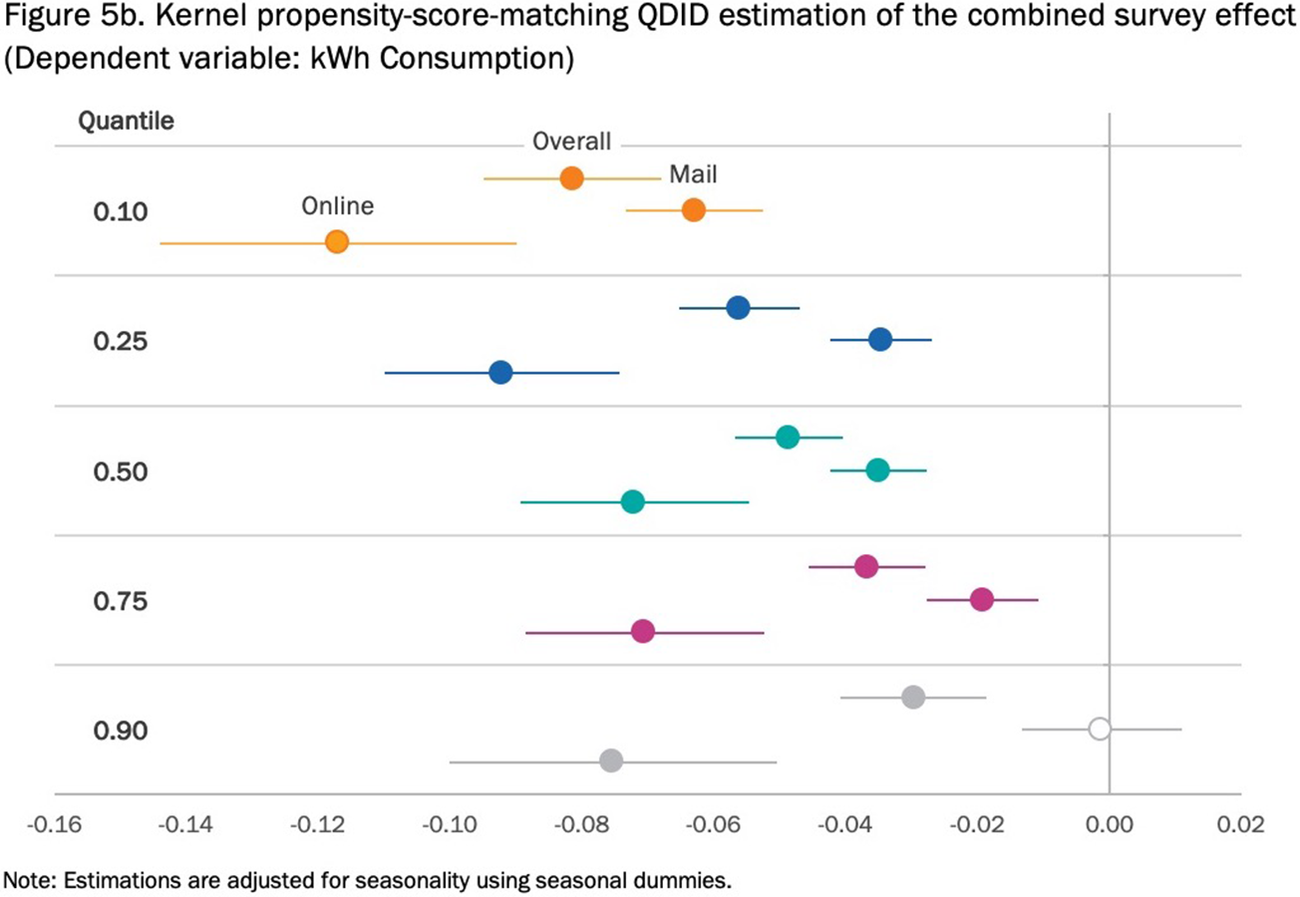
Here is an example of a regression table with more regression coefficients than we saw above. Here, there are three different quantile regression models estimated for five different quantiles. Our basic table guidelines would suggest (at least) using a shorter, more active title and aligning the decimals.

Instead of showing this as a detailed table, which requires readers to navigate the chart on their own, search for large and small values, and look for which estimates are statistically significant and which are not, let’s convert it to a simple bar chart. Here, the three models are arranged across the five quantile groups, with black error bars denoting the standard error. In this view, we more clearly see the relative magnitudes of the estimates, but we also see the declining values for the Overall and Mail groups as the quantile increases, and the slight curvature in the Online group.
But applying error bars to bar charts raises a potentially interesting complication: some research suggests that we tend to judge the points that fall within the bar as more likely than those outside the bar (known as “within-the-bar” bias, discussed by Correll and Gleicher Reference Correll and Gleicher2014), and other research has found that we can better judge uncertainty and the distribution with other types of graphs, such as the violin plot, stripe plot, or gradient plot (see Hullman, Resnick, and Adar Reference Hullman, Resnick and Adar2015).

Another option is to use what is called a “dot plot” or a “Cleveland dot plot” (sometimes also called a dumbbell chat, barbell chart, or gap chart). Here, each dot represents a single point estimate, with error bars (again) capturing the standard error. To help with clarity, the color of the dots and lines differs for each of the five quantiles. This graph has less ink than the bar chart, but it is perhaps more difficult to see the changes in the estimates across the distribution. (Another way to create the dot plot is to keep the dots on the same horizontal line, but that approach makes it more difficult to show error bars.)
V. Conclusion
For researchers, scholars, and practitioners who want their readers to understand their work quickly and accurately, presentation matters. Effective tables are well organized, reduce clutter to keep the focus on the important points, and will sometimes integrate visual components. With the increased flexibility of even basic software programs, scholars and analysts can learn and think about better visual presentation of their work with even less investment of time and energy.
Acknowledgments:
I would like to thank to Tom Kniesner for the invitation to write this article. I’m indebted to Filippo Teoldi for helping tabulate the types of tables and graphics in the JBCA. Finally, I’d like to thank the 14 JBCA authors who granted permission to use their tables in this article especially Glenn Blomquist, Art Fraas, James Hammit, Tom Kniesner, Clayton Masterman, Lisa Robinson, and Cass Sunstein. This article is based on a chapter in Elevate the Debate: A Multilayered Approach to Communicating Your Research (Schwabish Reference Schwabish2020b) and my forthcoming book, Better Data Visualizations: A Guide for Scholars, Researchers, and Wonks (Schwabish Reference Schwabish2020a).


