


Introduction
Polar ice cores offer a means of dating past snow deposits in the form of annual ice layers, which reflect past atmospheric composition. Trace substances in the cores are related to the past mid-tropospheric impurity load, this being due to the vast extent of the polar ice sheets (or ice caps), their surface elevations and remoteness from most aerosol sources.
By means of their eruptive products volcanic eruptions add to the rather low background impurity load, which in turn is reflected in the concentration of trace substances in the snow falling onto the ice sheet. Several well-known historical eruptions have marked the polar ice sheets with their widespread acid gas products (Reference HammerHammer 1977[b], Reference Hammer, Clausen and DansgaardHammer and others 1980, Reference Delmas and BoutronDelmas and Boutron 1980, Reference HerronHerron 1982, Reference Koerner and FisherKoerner and Fisher 1982).
How far back in time the polar ice sheets can be used indicators of widespread atmospheric impurity load depends on their flow history. From theoretical considerations and results obtained from deep cores it can be inferred that continuous records representing the past few hundred thousand years should be obtainable at ,carefully selected sites. The actual time limit can only be determined by drilling at the most favourable locations, and it may vary from a few hundred thousand years to perhaps most of the Quaternary era.
The value of the ice sheets as indicators of the influence of volcanism (or other sources of atmospheric trace substances) on the chemical composition of the atmosphere, over short- or long-time intervals, does, however, depend on our ability to relate concentrations in the deposited snow at a particular location to the local atmospheric concentrations. Very little happens to the concentrations when the snow is transformed into ice, at least in areas of high annual snow deposition (i.e. more than approximately 10 g of water cm-2 a-1). Glaciological and meteorological phenomena can cause a considerable noise in records by their influence on the top ~ 20 cm of snow. This is not discussed in this paper. This problem can be solved by having several cores from a location. If such a relation can be established with reasonable accuracy the next step is to relate local atmospheric composition to regional, hemispheric or global conditions. The latter may be quite complicated and each type of source of trace substance must be treated separately.
Ice Concentration to Air Concentration (Cice/Cair)
Reference JungeJunge (1977) has discussed the conditions under which the trace substance concentration in precipitation is proportional to that in the precipitating air mass. The conditions he stated are fulfilled for the most central parts of the polar ice sheets.
(a) ln-cloud riming
Junge did not discuss the possibility of in-cloud riming and further assumed that nearly all condensation nuclei were used up in the precipitation event. If in-cloud riming is effective during precipitation, this could have a serious effect on the relation between ice and air concentration of trace substances (Cice/Cair) (L A Barrie personal communication). Riming enrichments of trace substance concentrations of up to 50 times have been observed in continental precipitation. If in-cloud riming was a frequent and seasonally dependent phenomenon over the polar ice sheets, one would expect, a priori, a very strong seasonal variation as well as very abrupt changes in the impurity concentrations of the various snowfalls.
Average yearly peak values of dust in ice cores (Reference HammerHammer 1977[a]), sulphate (Reference Herron, Langway, Langway, Oeschger and DansgaardHerron and Langway 1985), sea salt (R C Finkel and others personal communication) and nitrate (Reference Risbo, Clausen and RasmussenRisbo and others 1981) occur in different seasons which probably relate to natural air concentration changes, rather than to riming. Further, if data from Greenland ice cores are used to infer mid-tropospheric aerosol load (in periods of little volcanism) the estimate is a few million tonnes, i.e. close to estimates based on direct or indirect atmospheric measurements (Reference JungeJunge 1974).
In-cloud riming is only possible if a large number of small supercooled water droplets coexist with the precipitating snow crystals. This situation is not very likely in the centre of ice sheets during the winter (apart from south Greenland). Apparently riming contributes little to the annual average values of impurity concentrations in the snow deposits, probably because of the clean-air regime over the ice sheets, but more research is needed on this important subject.
It is not so much the occurrence of riming, which is important for the interpretation of ice-core data, as how much its contribution to annual snow concentrations varies from year to year and/or over different climatic periods. A guideline may be obtained by comparing the seasonal deposition of volcanic products from several well-known large eruptions which show a deposition pattern from north to south Greenland which is not easily explained by riming (Reference HammerHammer 1984). In fact, the deposition pattern is much better explained by the general spreading of the volcanic aerosol in the atmosphere.
(b) Individual precipitations (Cice/Cair)
Ice-to-air concentrations are generally influenced by individual snowfall characteristics. The effect can only be described in a statistical manner because nearly all data obtained on individual snow- or rainfalls are derived from averages over a whole precipitation event (Barrie personal communication).
In order to correct for the effect of individual precipitations a number of assumptions must be made. It should, however, be emphasized that the correction for most polar ice cores will only be of the order of a factor of from 0.6 to 3, the largest correction being necessary for low accumulation areas (for an individual event, not for yearly averages!).
It is assumed that (1) snow and rain scavenging efficiencies are of the same order of magnitude, (2) relations between ice and air concentrations, based on data from outside the polar regions (excluding heavily-polluted areas), can be adapted to polar regions because the fundamental processes in washout are similar (though not identical), and (3) the average individual precipitation for an ice-sheet site is known. If these conditions are fulfilled it is possible to relate concentrations of trace substances in ice, Cice and air Cair (as a first order approximation):

(Reference JungeJunge 1963: 311–315). Choosing a situation, where the air concentrations at two different polar ice-sheet sites are equal, but having different average individual precipitations p1 and p2, we have for the corresponding ice concentrations:

Further, we have for the average individual precipitation Pi.
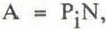
where A is the yearly precipitation and N the number of individual precipitations per year.
In Figure 1 Pi has been plotted against the value of A for various stations on the Antarctic and Greenland ice sheets. The values of Pi have been obtained from a number of pit studies and from the interpretation of continuous time series of dust and acidity along ice cores (1 mm resolution). The data from areas of low precipitation (such as the South Pole), i.e. less than 10 cm H2O, a−1, had to be partly guessed. The continuous profiles showed that blowing winds had almost obliterated the individual snowfall signature. However, it is reasonable that as A approaches zero so should Pi. This is not completely true due to the possibility of evaporation and drift accumulation which may be important for areas of low precipitation. In any case, areas of low precipitation are complicated and the phrase annual accumulation of snow is more appropriate so that Figure 1 is, therefore, only indicative for such regions.
Average individual precipitation at various polar ice-sheet sites, as derived from continuous ice core or snow pit measurements in the field.

From Figure 1 it can be seen that there seems to be a fairly simple linear relation between A and Pi for high precipitations. Evidently, the areas of low precipitation are isolated from meteorological phenomena associated with significant amounts of precipitation in the general circulation. High elevations, remoteness of water vapour sources and protection by geographical features all play a role in determining the relation between Pi and A; the linear relation between the chosen stations must be accidental. It should, however, be noted that all stations are far from the ice margin and give a fairly good coverage of the interior of the Greenland ice sheet. There are only two data sets from West Antarctica, but they are at least representative for large areas. The low-accumulation area of East Antarctica is only formally represented by the stipulated line in Figure 1.
Figure 2 shows the relation between A and (Cice/Cair)/k for a constant air concentration as calculated by Equation (1) and based on the observed values of Pi. Three important qualitative conclusions can be derived from Figure 2, even though Equation (1) is only a first approximation to the real conditions: (1) ice cores from areas of high precipitation reflect the local air concentrations of trace substances with less influence from the annual individual precipitation characteristics, (2) areas of low accumulation must be carefully scrutinized before air and ice concentrations can be related in a quantitative way, and (3) changes in annual precipitation due to climatic changes have only little influence on the relation between local air to local ice concentration, if the region is an area of high precipitation.
The relation between local air concentrations and ice concentration as a function of annual precipitation (accumulation) at the site in question.

The latter point has important consequences for the interpretation of ice-core data on trace substances covering glacial times when precipitation on the Greenland and Antarctic ice sheets was probably 2 to 5 times lower than today (Reference Hammer, Clausen, Dansgaard, Gundestrup, Johnsen and ReehHammer and others 1978, Raisbeck and others 1981, Reference Hammer, Clausen and LangwayHammer and others 1985).
During such times of smaller precipitation in the polar regions there is generally less washout of aerosols, which in turn results in higher air concentrations and a new washout equilibrium (disregarding other meteorological changes and changes in source regions). This increase in air (ice) concentration is not due to a local precipitation effect, but caused by regional or hemispheric changes. It is possible that the latter are reflected in a local lowering of precipitation but it is not a necessity, and it may be quantitatively different from the average behaviour.
I have treated the relation between Cice and Ciir in some detail, because it is essential to be aware of this relation before one undertakes a comparison of ice-core data from Antarctica and Greenland, or a comparison of ice-age data to Holocene data, or a comparison of, for example, Holocene time series of accumulation to the same time series of trace substance concentrations (be it on volcanic acids, sea salts. Be10, etc.).
Atmospheric Spreading of Volcanic Products
The spreading of volcanic submicron particles and gases in the upper atmosphere is governed by meteorological conditions which are more stable than the more complicated and noisy lower troposphere. The processes of wet removal in the lower troposphere are both more frequent and effective than in the upper atmosphere. Large tephra fragments usually fall out by gravity before they reach the ice sheets (see, however, Reference Gow and WilliamsonGow and Williamson 1971, Reference Kyle and JezekKyle and Jezek 1978, Reference Kyle, Jezek, Mosley-Thompson and ThompsonKyle and others 1981). The acid gas products from volcanoes that are remote from ice sheets only reach the latter if the products avoid the heavy washout which takes place in the low troposphere. Sulphur dioxide may spread further via the low troposphere than the more hydrophilic HCl and HF, but if the eruption took place for example, far south of Greenland, only insignificant amounts of material transported in the lower troposphere will reach the ice sheet. Eruptions remote from the ice sheets, but taking place in the same latitude zone, may in some cases contribute to the ice-sheet chemistry via gases transported in the lower troposphere.
A fairly large fraction of the volcanic acids, which caused the strongest signals in the Greenland ice cores, must have been transported in the upper atmosphere. In case of an eruption like Tambora 1815, the transport must have been via the stratosphere, but for a lava eruption like Lakigigar 1783, on Iceland, transport in the upper troposphere best explains the acid signal.
In order to judge the magnitude of eruptions, with respect to acid gas production from ice-core studies, it is necessary to rely on indirect evidence or on some average behaviour of the atmospheric transport of the products.
Nuclear Bomb Tests: Magnitudes and Latitudes of Eruptions
Data from the nuclear bomb tests since 1953 indicate that the transport, spreading and subsequent deposition of upper atmospherically-injected trace substances follow some average pattern. In wide latitude zones the fallout pattern in time does not vary much (but the average concentration does). Significant changes in the pattern are seen when the latitude zones 30 °N to 90°N, 30°N to 30 °S and 30 °S to 90°S are compared. For several years the radioactive aerosol was mainly caused by a few detonations which made it possible to relate ice concentrations to the magnitude of the detonations. From such data it was possible to relate ice concentration caused by a volcanic eruption to the total injected acid gases from the eruption. It is a prerequisite that the latitude zone of the eruption is known (Reference Hammer, Clausen and DansgaardHammer and others 1981). Such estimates are not ideal, but they are at least based on the measured spread of Sr90.
In Figure 3 relative air concentrations of Sr90 over different latitude zones are shown for two nuclear surface detonations of the same magnitude, one detonated in the high Arctic and one at the equator. The air concentration refers to the air of the precipitating air mass (not surface air) and the distribution pattern to the year following the detonation, except for the values south of the equator for the high Arctic detonation where the fallout could not be resolved from other and later detonations. Figure 3 is based on data from the United States Atomic Energy Commission Health and Safety Laboratory report (1974) and various data from Greenland and Antarctic ice cores.
The latitudinal distribution of Sr90 concentration (relative scale) in the precipitating air mass from two nuclear explosions of the same magnitude: (a) detonation in the high Arctic, (b) detonation at the equator (based on data from the report of the United States Atomic Energy Commission Health and Safety Laboratory (1974)) and various polar ice-sheet data.

Even though an explosive volcanic eruption is not a nuclear detonation and Sr90 is not an acid volcanic gas product, estimates of total volcanic acid products based on Sr90 data lead to reasonable results. Estimates of magnitudes of eruptions based on volcanological data and ice cores are in essential agreement (Reference ThorarinssonThorarinsson 1969, Reference StothersStothers 1984, H Sigurdsson personal communication). The agreement is only within a factor of 2, but that is acceptable, considering that most eruptions used in such a comparison took place before volcanic aerosols were monitored by instruments.
More recently, the data from satellites have greatly increased our knowledge of the atmospheric transport of volcanic products as in the case of the El Chicon 1982 eruption. However, the fission product data offer a direct comparison between magnitudes of material injected and ice-core concentrations. Another important advantage of the fisson product concentrations in ice cores is the pure signal, i.e. the natural background is negligible.
Comparison of eruptive volcanic signals in ice cores from north, south, and central Greenland even suggest that some information on the latitudinal zone of the eruption can be derived (Reference HammerHammer 1984). A particularly interesting large eruption around AD 1257–58 (though unknown) clearly marked the Greenland and Antarctic ice sheets with high acidity (maximum deposition year in Greenland AD 1259). Hence the eruption must have taken place in the equatorial zone.
In the absence of any information (indirect or direct) about the location of an eruption, causing a high acidity signal, the estimate of its contribution to the upper atmospheric impurity load will be less accurate. Typically an uncertainty of a factor of 2 to 3 may be expected. An additional source of error arises from the various meteorological conditions which reigned in the months and first few years following the eruptions. In few cases it could cause an error of a factor of 2. For small and moderately large eruptions, polar ice cores can be used to estimate the general contribution to atmospheric chemistry and aerosol load rather than to estimate the contribution from the individual smaller eruptions. For these smaller volcanic events it is not possible to estimate the contribution from various latitude zones. Comparison between well-dated and continuous records from ice cores in both the northern and southern hemisphere may help solve this problem, but changes in ice-core impurity concentrations due to climatic feedback mechanisms also have to be sorted out.
Nothing has been mentioned about the amount and type of material released in a particular type of eruption; this is a problem of votcanology rather than one of tracing the volcanic products from the eruption site to the ice cores.
Chemical Composition of Volcanic Products in Ice Cores
The bulk chemical composition of the Holocene volcanic aerosol reaching the ice sheets consists of components such as H2SO4, HCl and HF, their neutralized components such as (NH4)2SO4, NH4Cl, NH4HSO4, NH4F, and, to some extent, products of hydrolysis. (As mentioned previously, tephra may contribute in Antarctic ice cores.) The actual chemical composition varied from eruption to eruption, but H2SO4 was generally an important component.
During the last glacial period the acids were neutralized by alkaline material in the northern hemisphere and the volcanic products are mainly present in the cores as calcium salts (neutralized by calcium-rich carbonates) (Reference Hammer, Clausen and DansgaardHammer and others 1980, Reference Hammer, Clausen and Langway1985). The Antarctic snow remained acid during this period, because the southern atmosphere was less influenced by ocean-free continental shelves and loess sources.
While the contribution from volcanism to the atmospheric trace substance load (excluding low troposphere) averages some 10 to 15% over the Holocene period (Fig.4), less is known about the glacial period. During such times the climatic and environmental conditions were quite different from the Holocene and, hence, there is more uncertainty in translating ice concentrations to atmospheric load. Even if we assume that the stratospheric spreading of an eruption cloud did not differ from the present pattern, we will still be left with some problems: (1) how efficient was the transfer from stratosphere to mid-tropospheric precipitating air masses during glacial times? (2) how did the strong winds and different source regions change the non-volcanic background variability as compared to Holocene conditions? (3) how did the probably smaller precipitation in polar regions affect the polar aerosol load?
The influence of volcanism on the mid-tropospheric impurity load (given as excess acidity set out in black) over the northern hemisphere, as derived from the Camp Century, Greenland, ice core. The figure is based on ca. 10 000 individual measurements, but presented in 100 year mean values. Time scale is in Reference Hammer, Clausen, Dansgaard, Gundestrup, Johnsen and ReehHammer and others (1978).

These are only some of the problems, but recent data on volcanic signals in the Byrd core covering glacial times suggest that the most important correction is associated with the smaller precipitation in the polar regions (Hammer and others in preparation).
For marine- or continental-derived material changes in winds, source regions and precipitation are all important parameters which contribute to ice-core concentrations during glacial times.
Volcanism and Climate
The climatic implications of volcanism have been widely discussed throughout the last few decades. Apart from the problem of modelling the climatic effects of volcanic aerosols (see, for example. Reference HuntHunt 1977 and Reference Pollack, Toon, Sagan, Summers, Baldwin and Van CampPollack and others 1976), there is a need to compare palaeoclimatic and palaeovolcanic records. Data from the ice cores can also be used as input data in models, especially when more data on the chemistry becomes available.
Volcanic activity also plays an important role in the geochemical cycle and, even though the polar ice cores only cover a small time period, they do offer a fairly large data library on the frequency, mass and type of widespread volcanic aerosols.
Acknowledgements
I want to thank the organizing committee of the Trent 1984 Symposium and the Royal Society of Canada for making it possible for me to participate in the conference and finishing this paper. Also, I appreciate the help of R Koerner and D Fisher, Polar Continental Shelf Project, Energy, Mines and Resources Canada, who successfully tricked me into finishing this paper.



