I. INTRODUCTION
Polymer electrolytes are polymer-based systems that show ionic conductivity, which allows their use in solid-state devices such as batteries and capacitors.Reference Silva, Silva, Moreira and Pimenta1 However, conventional organic sol–gel electrolyte used in these devices is expected to be replaced by solid polymer electrolyte (SPE) in the near future.Reference Wu and Chang2 SPE offers several advantages to battery technology: low manufacturing cost and improved performance, economy of volume and mass, structural and chemical stability, low toxicity, and dual function as an electrode separator.Reference Noto, Vittadello, Lavina, Fauri and Biscazzo3 However, its lower ionic conductivity is the main hindrance to be extensively commercialized. Incorporation of room temperature ionic liquids is one of the many ways to overcome this difficulty. Ionic liquids are molten organic salts at room temperature. They are nonvolatile, highly ionic, and display wide electrochemical stability window, and most of them are transparent due to their nature.Reference Brazier, Appetecchi, Passerini, Vuk, Orel, Donsanti and Decker4
Poly(vinylidenefluoride-hexafluoropropylene) [P(VdF-HFP)] has been studied extensively for application in polymer electrolytes as it shows low crystallinity compared to PVdF.Reference Li, Zhang, Zhang, Li, Wu and Zhou5 It has been used as quasi-solid-state materials in dye-sensitized solar cellsReference Lee, Suryanarayanan and Ho6 and shown to have good compatibility with ionic liquid.Reference Reiter, Krejza and Sedlaříková7 To resolve the problem of low compatibility with polymer and safety problem faced by lithium-conducting SPEs,Reference Jeong, Jo and Jo8 it is essential to develop other alternatives to the lithium-based batteries. The search for magnesium containing SPE can be interesting not only for understating the multivalent cationic conductivity mechanism in the polymer but also due to their lower cost, ease of handling, and fabrication as thin film membranes,Reference Perera, Dissanayake and Bandaranayake9 as compared to its lithium counterpart.
Nevertheless, investigations on solid-state rechargeable magnesium batteries are scarce in the literature.Reference Kumar and Munichandraiah10 Here, we wish to report the temperature-dependent ionic conductivity, dielectric, thermal, and morphological properties, together with photoluminescence (PL) spectra to examine the concentration effect of 1-butyl-3-methylimidazolium trifluoromethanesulfonate (BMIMTf) on P(VdF-HFP)/MgTf-based SPE system.
II. EXPERIMENTAL
A. Materials
P(VdF-HFP) with average Mw = 455000 was obtained from Sigma-Aldrich (St. Louis, MO). Magnesium trifluoromethanesulfonate (MgTf) salt was obtained from Acros (Morris Plains, NJ) and dried at 100 °C for 1 h to eliminate trace amounts of water in the material, prior to the preparation of SPEs.BMIMTf was obtained from Agro Organics (Somerset, South Africa). Acetone of analytical grade was obtained from J.T. Baker (London, UK).
B. Preparation of thin films
The amounts of P(VdF-HFP) and MgTf have been fixed to be 0.60 and 0.40 g, respectively. The nomenclature of samples in this study, MB-XXX, is based on the amount of ionic liquid added into the P(VdF-HFP)-MgTf system on the basis of part by weight (pbw) with respect to the total amount of P(VdF-HFP)-MgTf system (1.00 g). The composition of all samples is tabulated in Table I. In this study, solution casting technique was used to obtain thin film samples with acetone as solvent. The thoroughly stirred mixture was then cast on a Petri dish and allowed to evaporate slowly inside a fume hood. This procedure yields mechanically stable and free-standing thin films. The resulting thin films were labeled as from MB-0 to MB-100, where the number designates the amount of BMIMTf in pbw doped into each sample. The thickness of thin films was measured using a micrometer screw gauge.
Compositions of samples MB-0, MB-25, MB-50, MB-75, and MB-100.

C. Instrumentation
The samples were cut out resembling the shape of stainless steel blocking electrodes used in this study and sandwiched between them. A HIOKI 3532-50 LCR Hi-Tester (Nagano, Japan) was used to perform the impedance measurements for each SPE over the frequency range of 50 Hz–1 MHz. The equation σ = l/R bA is used to calculate the ionic conductivity of thin film sample, where σ is conductivity in siemens per centimeter, l is thickness of thin film sample in centimeters, R b is bulk resistance in ohms obtained from Cole–Cole impedance plot, and A is surface area of stainless steel blocking electrodes in square centimeters. The same measurement was also performed for selected samples from 30 to 80 °C. Differential scanning calorimetry (DSC) was also performed with Mettler Toledo analyzer (Columbus, OH) that consists of a DSC823e main unit and STARe software. Approximately 2 mg of sample was sealed in the standard 40-μl aluminum pan. The sample was then heated sequentially from 30 to 100 °C, remained for 1 min, and then cooled down to 30 °C to eliminate the trace amount of water absorbed into the sample. It was then reheated up to 200 °C and again cooled down to 30 °C. The heat rates used were 10 and −10 °C min−1 for heating and cooling cycle, respectively. All the measurements were conducted in nitrogen atmosphere. The SPEs were then subjected to scanning electron microscopy (SEM), with the model Leica S440 (Wetzlar, Germany). All the scanning electron micrographs share a common magnification factor of 5000×. PerkinElmer LS55 Luminescence Spectrometer (Waltham, MA) is used for PL measurements. The sample holder was placed 60° against the excitation wave length. The excitation and emission wavelengths have been set at 280 and 360 nm, respectively.
III. RESULTS AND DISCUSSION
A. Temperature-dependent ionic conductivity
Ionic conductivity is one of the most important aspects in polymer electrolyte research. It varies with a wide range of factors, such as additives, cation and anion types, salt concentration, temperature, etc.Reference Vieira, Avellaneda and Pawlicka11 In this study, we have chosen to study the concentration effect of BMIMTf in fixed ratio of P(VdF-HFP)-MgTf-based SPE system. It is been shown that neat 1-ethyl-3-methylimidazolium trifluoromethanesulfonate and 1-ethyl-3-methylimidazolium tetrafluoroborate possess similar ionic conductivity as do their gel polymer electrolytes .Reference Fuller, Breda and Carlin12 Unlike hydrophilic 1-ethyl-3-methylimidazolium-based ionic liquid, the BMIM-based counterpart exhibits hydrophobic character that is helpful in reducing moisture contamination in SPE. However, we only fabricate SPE with incorporation of BMIMTf up to 100 pbw, as at high ionic liquid concentration, ionic conductivity reaches value near to that of its neat form with the price of mechanical stability being compromised.Reference Marcilla, Alcaide, Sardon, Pomposo, Pozo-Gonzalo and Mecerreyes13 That actually contradicts with our objective to produce SPE for all-solid-state batteries.
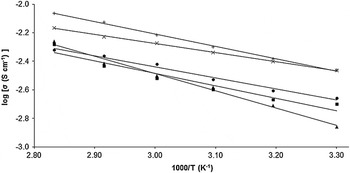
Figure 1 illustrates variation of logarithm ionic conductivity as a function of inverse absolute temperature of all SPEs. Highest conductivity is reached in MB-75, SPE with 75 pbw of BMIMTf addition. It exhibits ionic conductivity of ∼3 × 10⁻³ and ∼7 × 10⁻³ S cm−1 at 30 and 80 °C, respectively. Ionic conductivity rises as soon as 25 pbw of BMIMTf is added into the system. It mainly functions as plasticizer to decrease crystallinity of polymer matrix, lower viscosity, and facilitate ionic dissociation of MgTf.Reference Reiter, Vondrák, Michálek and Mićka14 Other than that, high concentration of free mobile cation and anions in ionic liquid is known to contribute to the overall ionic conductivity as well.Reference Singh, Hundal, Park, Park, Lee, Kim, Yamada and Sekhon15 Hence, number of charge carriers available for ionic conduction increases and crystallinity of the matrix decreases at the same time due to the addition of BMIMTf.Reference Singh, Kim and Rhee16 These factors ultimately improve the mobility of charge carriers and lead to enhancement of ionic conductivity in SPE. Nonetheless, it declines when BMIMTf content exceeds 75 pbw. The decrease of ionic conductivity maybe due to relatively strong interaction between BMIMTf and MgTf, in which magnesium is doubly charge in its ionic form, restraining ionic transportation and thus give a slightly reduced ionic conductivity.Reference Chen, Zhang, Wang, Zhang and Li17 The highest rate of change in ionic conductivity over temperature tends to confirm with that explanation, as higher temperature facilitates ionic dissociation, thus more free mobile ions and higher ionic conductivity.
Variation of logarithm ionic conductivity as a function of inverse absolute temperature of MB-0 (▲), MB-25 (■), MB-50 (●), MB-75 (✖), and MB-100 (+).

The regression values of all SPEs are close to unity, indicating that the temperature-dependent ionic conductivity for this SPE system obeys Arrhenius rule. According to Arrhenius behavior, the nature of cation transport can be deduced to be similar to that in ionic crystals, where ions jump into neighboring vacant sites.Reference Ramesh and Chai18 When temperature is increased, polymer chain segmental motion is also boosted and permits a pathway for ions to move. This in turn favors the hoping intrachain and interchain ion movements and consequently improves the ionic conductivity.Reference Reddy and Chu19 It can also be related to the release of free mobile Mg2+ ions upon heating to form an acid–base complex with P(VdF-HFP), which results in further disruption of crystallinity of polymer matrix,Reference Reddy and Chu20 given the fact that MB-100 reaches steepest slope in plot.
Activation energy, E a, of SPE can be estimated from the gradient of trend line plotted or calculated from the Arrhenius equation,  , where σ is ionic conductivity, σ o is the pre-exponential factor, E a is the apparent activation energy, R is universal gas constant, and T is the absolute temperature. From Fig. 1, it is not difficult to realize the gradient of MB-75 being the least steep, indicating that MB-75 exhibits lowest E a among all SPEs. As to the low apparent activation energy, it may be related to the easy transformation of the polymer conformation.Reference Gregorio and Borges21 When content of BMIMTf reaches 100 pbw, its E a increases again as systems containing high concentration of ions such as neat ionic liquids are more sensitive concerning influence of temperature on the ionic conductivity and ion–ion association.Reference Brazier, Appetecchi, Passerini, Vuk, Orel, Donsanti and Decker4
As there is no sudden change in value of ionic conductivity with temperature, it may be inferred that these SPEs do not undergo any phase transitions within the investigation range of temperatures.Reference Khiar, Puteh and Arof22 This also suggests they likely maintain the same ionic conduction mechanism in rather wide temperature range.Reference Xu, Ye and Huang23 All these results thus show that magnesium-based SPEs offer an interesting alternative to lithium-based SPE for room temperature or solid-state battery systems that operate at elevated temperatures.
B. Dielectric studies
1. Frequency-dependent conductivity studies
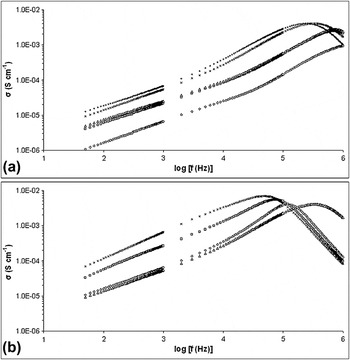
To get a clearer picture of ion dynamics and conductive behavior in the SPEs, the conductivity of the samples is calculated with equation, log σ = log (GL/A), where G denotes conductance in ohms, L as thickness of thin film in centimeters, and A as surface area of stainless steel blocking electrodes in square centimeters. Variation of logarithm conductivity as a function of frequency for all SPEs and MB-75 at 298, 313, 333, and 353 K has been shown in Figs. 2(a) and 2(b), respectively.
Variation of logarithm conductivity as a function of frequency for (a) MB-0 (◇), MB-25 (□), MB-50 (△), MB-75 (✖), and MB-100 (∗) and (b) MB-75 at 298 (△), 313 (◇), 333 (□), and 353 K (✖).

The conductivity of SPEs increases with increasing frequency, as well as temperature. The low-frequency dispersion region may be due to the interfacial resistance or space charge polarization. It refers to the electrodes being polarized as charge accumulates due to slow periodic reversal of electric field at low frequency.Reference Ramesh and Wong24 As frequency decreases, more and more charges are accumulated at the electrodes and electrode interfaces, which leads to a decrease in number of free mobile ions and eventually a drop in conductivity at lower frequency. At higher frequency, the conductivity increases with frequency due to greater mobility of charge carriers and faster hopping of ions.Reference Venkateswarlu and Satyanarayana25 As a result, ion-exchange process occurs effectively at higher frequency. Besides, a noticeable gap between MB-0 and MB-25 suggests that the ionic conduction in SPEs with and without BMIMTf may have a somewhat different mechanism due to the increased number of charge carriers in the SPEs, and the same observation is found in between MB-50 and MB-75, which is congruent with observations in Fig. 1. It is interesting to see that MB-100 actually possesses higher conductivity than that of MB-75. However, it declines faster at higher frequency probably due to excessive amount of charge carriers and higher interactions between ions. That is the reason MB-100 shows remarkably higher values in the following dielectric analyses.
As for Fig. 2(b), it serves as the evidence of temperature dependency of conductivity. As temperature increases, general trend of conductivity also shifts accordingly. A hump can be clearly observed at all temperatures for MB-75. The shifting of hump from higher to lower frequency with increasing temperature can be related to the inherent nature of SPE.Reference Dygas, Misztal-Faraj, Florjańczyk, Krok, Marzantowicz and Zygadło-Monikowska26 The switch over from frequency-independent to frequency-dependent regions marks the onset of conductivity relaxation,Reference Karan, Pradhan, Thomas, Natesan and Katiyar27 which is further discussed below.
2. Dielectric permittivity studies
Dielectric permittivity can also be viewed as a representation of stored and loss charges in a material.Reference Ramesh and Ng28 It can be related to dielectric relaxation, which refers to the relaxation response of a material to an external electric field as a function of frequency. In SPEs, the charge carriers are mainly ions. The relationship between complex impedance, dielectric constant, dielectric loss, and loss tangent can be shown in the following formulae: ε′ = C pL/ε oA, ε″ = σ/ωε o, tan δ = ε″/ε′, where ε′ denotes the dielectric constant, ε″ as the dielectric loss, C p as the parallel equivalent static capacitance, σ = GL/A as the conductivity, ω = 2πf as the angular frequency in hertz, ε o as the permittivity of the free space, and tan δ as the calculated tangent loss.
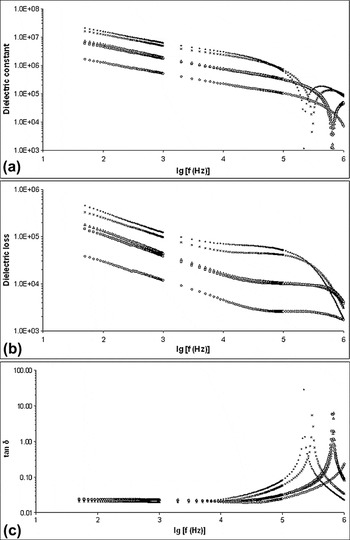
Figures 3(a)–3(c) illustrate the variation of logarithm dielectric constant, logarithm dielectric loss, and logarithm loss tangent, respectively, for all SPEs in this study as a function of frequency. In general, all three samples exhibit similar observations that ε′ and ε″ decrease with frequency. The fall being rapid at lower frequency and saturation in higher frequency range, which is a typical feature observed in polymer electrolytes.Reference Baskaran, Selvasekarapandian, Hirankumar and Bhuvaneswari29 The decrease in dielectric permittivity with increasing frequency can be associated to the inability of dipoles to rotate rapidly leading to a lag between frequency of oscillating dipole and that of the applied field.Reference Awadhia, Patel and Agrawal30 From Figs. 3(a) and 3(b), dielectric permittivity increases with increasing salt for every frequency. This implies that as the salt content increases, the stored charge in the samples increases and so does the density of free mobile ions.Reference Buraidah, Teo, Majid and Arof31 However, the loss tangent of MB-100 is also comparatively higher than any other SPEs, which is shown in Fig. 3(c).
Variation of (a) logarithm dielectric constant, (b) logarithm dielectric loss, and (c) logarithm loss tangent for MB-0 (◇), MB-25 (□), MB-50 (△), MB-75 (✖), and MB-100 (∗) as a function of frequency.

3. Dielectric modulus studies
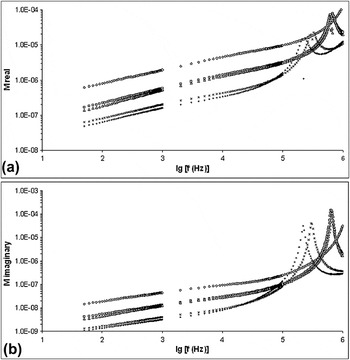
A further analysis of dielectric behavior is done by using the formulation of dielectric moduli, which suppresses the effect of electrodepolarization.Reference Ramesh, Tai and Chia32Figures 4(a) and 4(b) depict the variation of real and imaginary parts of modulus for all SPEs as a function of frequency. These graphs can be obtained using the formulae M′ = ε′/[(ε′)2 + (ε″)2] and M″ = ε″/[(ε′)2 + (ε″)2], where ε′ and ε″ are the real and imaginary part of dielectric permittivity, respectively, calculated from the previous section.
Variation of (a) real part of modulus, M′ and (b) imaginary part of modulus, M″ for MB-0 (◇), MB-25 (□), MB-50 (△), MB-75 (✖), and MB-100 (∗) as a function of frequency.

Both M′ and M″ increase with increasing frequency and temperature. These graphs also present a “long-tail” at frequency range between 50 Hz and up to ∼100 kHz. This may indicate all SPEs tested are very capacitive, which again implies that BMIMTf helps in dissociating MgTf salt into ions that accumulate at the electrode–electrolyte interface at low frequencies.Reference Osman, Ibrahim and Arof33 It can also be observed that peak of these plots shifts toward low frequency region as content of BMIMTf increases. The peak represents the conductivity relaxation peak for the distribution of relaxation times of the free charge carriers.Reference Mishra, Baskaran, Ramakrishna and Rao34 The existence of such peaks indicates that these SPEs are ionic conductors.Reference Yahya and Arof35
C. Scanning electron microscopy
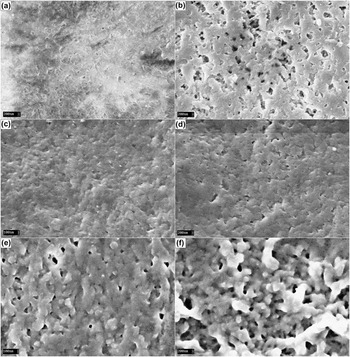
Morphological changes of pure P(VdF-HFP) and resulting SPEs after addition of BMIMTf have been carried out by means of SEM. Scanning electron micrographs of (a) pure P(VdF-HFP), (b) MB-0, (c) MB-25, (d) MB-50, (e) MB-75, and (f) MB-100 have been presented in Fig. 5. Very distinguishable changes can be observed from pure P(VdF-HFP), to undoped, low, intermediate, and high concentrations of BMIMTf. Pure P(VdF-HFP) shows normal porous surface with uniform small pore size. The morphology changes, when 40 pbw of MgTf is incorporated into 60 pbw of P(VdF-HFP), to become spheroidal,Reference Elmér, Wesslén, Sommer-Larsen, West, Hassender and Jannasch36 an open pore structure of the polymer electrolyte matrix, which is essential for ionic conductivity across the thin film. This type of open porous structure has already been identified to be providing enough channels for the migration of ions, accounting for the increased ionic conductivity.Reference Li, Zhang, Zhang, Yang and Wu37
Scanning electron micrographs of (a) pure P(VdF-HFP), sample (b) MB-0, (c) MB-25, (d) MB-50, (e) MB-75, and (f) MB-100.

As soon as 25 pbw of BMIMTf is added into the system, it seems like the spheroidal structure has transformed into a slightly rough but poreless surface, indicating a different type of ionic conduction mechanism from MB-0. This can be due to the absorption of BMIMTf into the polymer matrix at molecular level. When two additional 25 pbw of BMIMTf are added, the morphological changes have become more alike to that of MB-0, but with swollen spheroidal and seemingly larger pores. That could be the reason of MB-50 and MB-75 having higher ionic conductivity but different E a. Nevertheless, when content of BMIMTf reaches 100 pbw, its morphology changes again to resemble that of MB-0, which is spheroidal but appear to be swollen.
D. Differential scanning calorimetry
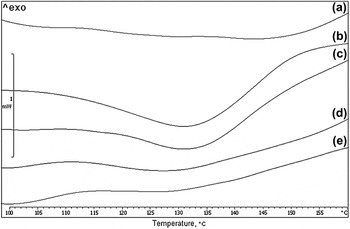
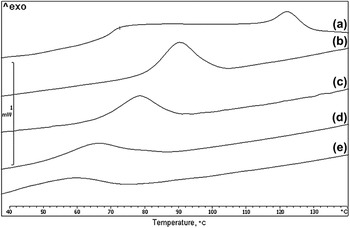
DSC can be used to examine overall thermal properties of SPEs.Reference Abbrent, Plestil, Hlavata, Lindgren, Tegenfeldt and Wendsjö38 DSC thermograms of all SPEs in both heating and cooling runs are depicted in Figs. 6 and 7, respectively. The melting point (T m) of MB-0 is slightly higher than that of pure P(VdF-HFP), which is approximately 140 °C. This suggests there is interaction between P(VdF-HFP) and MgTf.Reference Li, Zhang, Zhang, Li, Wu and Zhou5 As the content of BMIMTf increases, T m of SPE suffers from a somewhat irregular pattern of decrease and increase. This can be related to the crystal phases of PVdF during heating and melting.Reference Aravindan, Vickramen and Prem Kumar39 However, the generally shifting of T m to lower temperatures is most probably due to melting of crystallized region of SPE becomes easierReference Xu, Ye and Huang23 or may be originated from the changes in solubility of P(VdF-HFP) to BMIMTf at temperature over 100 °C.Reference Lee, Nohira and Hagiwara40
Differential scanning calorimetric (DSC) thermograms of (a) MB-0, (b) MB-25, (c) MB-50, (d) MB-75, and (e) MB-100 in heating run.

DSC thermograms of (a) MB-0, (b) MB-25, (c) MB-50, (d) MB-75, and (e) MB-100 in cooling run.

As for crystallization temperature (T c), it decreases with increasing amount of BMIMTf. This is a common indication of decline in polymer crystallinity as BMIMTf contents increases. The lower T c values also mean that the temperature range over which it can exist stably in an amorphous state becomes wider.Reference Ji, Moon, Kim and Park41 This is advantageous as BMIMTf not only exhibits higher ionic conductivity in SPE but enhances thermal stability of polymer amorphous phase as well. T c occurs at lower temperature than with T m is typical for macromolecules, such as the polymer host in this study.Reference Reddy and Chu19
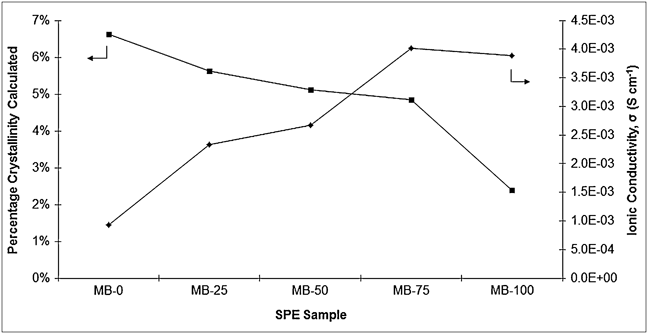
Calculation of percentage crystallinity is done from the cooling DSC thermograms with equation 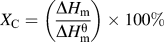 , where ∆H m denotes heat of fusion of sample and
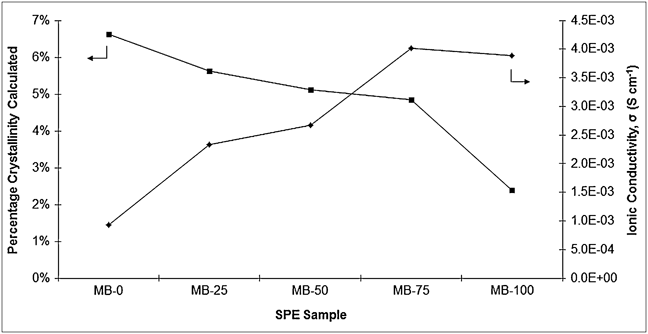
 as reference heat of fusion of the crystalline α-PVdF, 104.7 J g−1.Reference Choi, Jo, Lee and Kim42 The result is depicted in Fig. 8, together with ionic conductivity at room temperature corresponding to each of SPE for comparison. It is clear that doping of BMIMTf lowers the polymer crystallinity and consequently enhances ionic conductivity.Reference Singh, Kim and Rhee43 This theory agrees well with SPE in this study, up to MB-75, in which 75 pbw of BMIMTf is added into the system. However, when it comes to MB-100, despite the fact that crystallinity is decreased more than other SPEs, its ionic conductivity declines. This is commensurate with the explanation provided in previous section, where further increase of BMIMTf leads to ion–ion aggregation up to a possible Ionic Liquid (IL) saturation and precipitation that does not contribute to ionic conductivity.Reference Costa, Lavall, Borges, Rieumont, Silva and Ribeiro44 This hypothesis has already been shown in Fig. 1, where MB-100’s rate of change in ionic conductivity over temperature outperforms other SPEs.
Calculated percentage crystallinity (■) and ionic conductivity (◆) of MB-0, MB-25, MB-50, MB-75, and MB-100.
E. Photoluminescence spectroscopy
As discussed above, ionic conductivity can be related to ion mobility, which is strongly associated with crystallinity. In SPEs with low crystallinity, conducting species within the sample should have higher mobility to give greater ionic conductivity. It is generally accepted that in the conventional polymer electrolyte, conducting cations are coordinated by strongly electron-withdrawing constituents. In this study, it would be fluorine in P(VdF-HFP) backbone. Thus, ionic conduction is strongly coupled with segmental motions of the polymer matrix, which are closely correlated with local free volume and local viscosity around the charge-transporting ions.Reference Park, Hong and Oh45 It has been shown that fluorescence studies can provide information on local viscosity in SPEs and is termed as “microviscosity.”Reference Jeon, Bae, Turner and Granick46 Besides, this technique can also be used to detect structural alterations in the local environment,Reference Waldow, Ediger, Yamaguchi, Matsushita and Noda47 which is the objective of our current study.
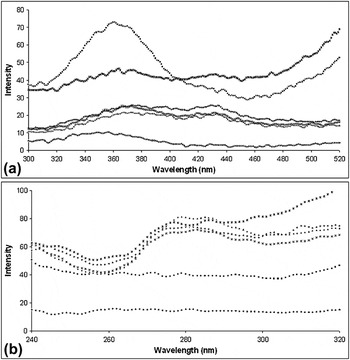
PL emission and excitation spectra of pure P(VdF-HFP) and all SPEs are shown in Figs. 9(a) and 9(b), respectively. Not obvious changes are noted for both fluorescence spectra of MB-0, except the intensity. However, the spectra change significantly when BMIMTf is added into the system, such as new peaks at approximately 430 and 280 nm in emission and excitation spectra, respectively, presumably it is a material with certain luminescent characteristics as it is used extensively in research of electrochromic devices. The characteristic peak of MB-0 at 360 nm in Fig. 9(a) has also been suppressed severely, which is understandable, as dopants tend to reduce prominent peaks of an undoped sample.Reference Anandan, Radhakrishna, Radhakrishna and Arof48 In addition, it seems that the intensity increases with increasing amount of BMIMTf. This suggests phase changes in the polymer matrix and higher degree of free ionic motion, or simply ion mobility, is observed when greater amount of BMIMTf is incorporated with P(VdF-HFP)-MgTf system. The enhancement of ion mobility can be attributed to the addition of BMIMTf that disrupts the crystalline phase of P(VdF-HFP) and restructures it to amorphous, which agrees well with results obtained in DSC analysis.
Photoluminescence (a) emission and (b) excitation spectra of P(VdF-HFP) (◆), MB-0 (■), MB-25 (▲), MB-50 (✖), MB-75 (+), and MB-100 (∗).

IV. CONCLUSION
The presence of BMIMTf in the SPE system has shown to be favorable toward electrochemical and thermal properties of P(VdF-HFP)/MgTf-based SPE system. When 75 pbw of BMIMTf is incorporated into the system, it achieves highest ionic conductivity at room temperature, which is ample with many of portable electronic devices, and declines after that concentration. We suggest that decline is related to greater extend of ion–ion interaction due to excessive amount of BMIMTf. Analyses on dielectric measurement and crystallinity by DSC tend to substantiate that theory. Investigation on smaller range of BMIMTf content between 50 and 100 pbw should be carried out to find the optimum concentration for P(VdF-HFP)/MgTf-based SPE. Emission and excitation spectra of PL show that BMIMTf suppresses characteristic peaks of P(VdF-HFP)/MgTf-based SPE and new peaks are found to be emerging.
ACKNOWLEDGMENT
This work was supported by the Exploratory Research Grant Scheme (ERGS: ER017-2011A).