I. INTRODUCTION
Soldering is the most important joining technology across various levels of electronic packaging, from three-dimensional integrated circuits and flip–chip bonding to module assembly in electronic products. The Sn–20.48 at.% In–3.05 at.% Ag (Sn–20.0 wt% In–2.8 wt% Ag) alloy is an important Pb-free solder, which has moderate liquidus temperatures. Ni is commonly used as a diffusion barrier layer for under bump metallurgy. Reference Kang and Ramachandran1–Reference Wu, Wu and Chuang5 The compatibility between Sn–20.48 at.% In–3.05 at.% Ag alloy and the Ni substrate is crucial to the reliability of electronic devices. Although Sn–20.48 at.% In–3.05 at.% Ag solder is commercially available, there have been only a few studies of the interfacial reactions between Sn–20.48 at.% In–3.05 at.% Ag solder and the Ni substrate, Reference Chuang, Huang and Lin4,Reference Wu, Wu and Chuang5 and there are no interfacial reaction results for temperatures lower than the melting point of Sn–20.48 at.% In–3.05 at.% Ag solder, 176.3 °C. Reference Chuang, Huang and Lin4 Therefore, this study investigates the interfacial reactions in Sn–20.48 at.%–3.05 at.% Ag (Sn–In–Ag)/Ni couples at 100 and 150 °C. Three unusual phenomena are noted: isothermal liquation, isothermal solidification, and the extraordinary temperature sensitivity of reaction rates.
II. EXPERIMENTAL
Sn–20.48 at.% In–3.05 at.% Ag alloys were prepared from pure Sn shots (99.95%, Showa, Tokyo, Japan), pure In shots (99.99%, Alfa Aesar, Heysham, UK), and pure Ag shots (99.9%, Alfa Aesar). Pure Ni foils (99.98%, Sigma–Aldrich, St. Louis, MO) with dimensions of 0.5 × 5 × 8 mm were placed in the center of quartz tubes. Sn–20.48 at.% In–3.05 at.% Ag ingots were then placed on top of the Ni substrates and the two were encapsulated together in a 10−5 bar vacuum. The capsules were heated to 250 °C. The Sn–20.48 at.% In–3.05 at.% Ag ingot melted, and the capsule was quenched in icy water immediately after the solder melt had enclosed the Ni substrate. The Sn–In–Ag/Ni couples were then reacted at 100 and 150 °C. After predetermined reaction times, ranging from 1 to 1440 h, the samples were quenched in icy water, mounted in epoxy and metallographically examined with a scanning electron microscope (SEM, S-2500, Hitachi, Tokyo, Japan) that was equipped with a backscattered electron detector. The composition of each phase region was analyzed using a field-emission electron probe micro-analyzer (FE-EPMA, JXA-8600SX, JOEL, Japan).
III. RESULTS AND DISCUSSION
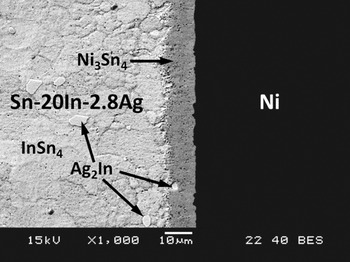
Figure 1 shows the backscattered electron image (BEI) micrograph for the Sn–In–Ag/Ni couple reacted at 100 °C for 1440 h. One reaction layer is observed. Its composition, as determined by FE-EPMA, is Sn–19.7 at.% In–32.1 at.% Ni, with negligible Ag, and it is the Ni3Sn4 phase with 19.7 at.% In, according to the phase diagram of the Sn–In–Ni ternary system. Reference Wu, Wu and Chuang5–Reference Yeh, Chang and Straumal9 It should be mentioned that the Sn–In–Ni phase diagrams at 100 and 150 °C are not available in the literature. In this study, they are constructed based on the phase diagrams at 160 and 240 °C Reference Wu, Wu and Chuang5 and those of the constituent binary systems. Reference Huang and Chen6–Reference Yeh, Chang and Straumal9 The results are similar to those for the Sn/Ni and Sn–In/Ni reaction couples, Reference Huang and Chen6,Reference Chen and Chen10–Reference Lin and Chen12 and the Ni3Sn4 phase is the reaction product. Upon thermal aging, the Ni content in this Ni3Sn4 layer gradually increased from 28 to 32 at.%, whereas the In content remained unchanged around 19 at.%.
The BEI micrograph of the Sn–20.48 at.% In–3.05 at.% Ag (Sn–20.0 wt% In–2.8 wt% Ag)/Ni couple reacted at 100 °C for 1440 h.

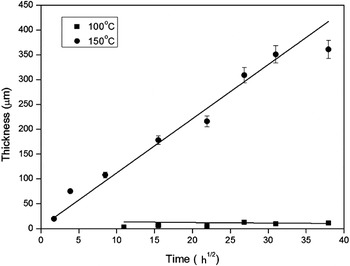
In addition to the dark reaction layer, some bright particulates are present near the reaction layer/solder interface. Its composition is Ag–31.4 at.% In, with no detectable Sn and Ni, and it is the Ag2In phase. Reference Chen, Lee, Hsu, Yang, Hsu and Wu13,Reference Macdonald and Eagar14 The Ag2In and InSn4 phases are the constituent phases of the Sn–20.48 at.% In–3.05 at.% Ag alloy. Reference Chuang, Huang and Lin4–Reference Huang and Chen6 Furthermore, as the reaction layer contains no Ag, the Ag in the solders becomes excess Ag as the reaction proceeds and then precipitates as Ag2In. Similar results are found for the other Sn–In–Ag/Ni couples reacted at 100 °C for various lengths of time. The reaction product is the Ni3Sn4 phase and the reaction layer grows as the reaction time increases as shown in Fig. 2.
The reaction layer thickness in the Sn–20.48 at.% In–3.05 at.% Ag (Sn–20.0 wt% In–2.8 wt% Ag)/Ni couples reacted at 100 and 150 °C for various lengths of reaction time. Note that the error bars for the data of 100 °C are very small in the scale of the plot.

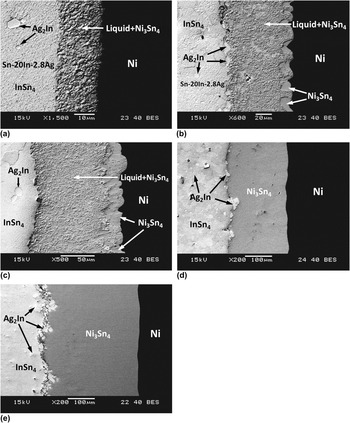
Figure 3(a) shows the BEI micrograph for the Sn–In–Ag/Ni couple reacted at 150 °C for 3 h. Similar to the results for reaction at 100 °C, only one reaction layer is found. However, its thickness is 20 μm and it is much thicker than that for the couple that is reacted at 100 °C as shown in Fig. 2. A closer examination reveals that this layer has multiple phases; however, the individual phases are too fine to allow effective compositional analysis. The average composition of the reaction layer is Sn–22.6 at.% In–19.4 at.% Ni. According to the Sn–In–Ni phase diagrams, Reference Wu, Wu and Chuang5–Reference Yeh, Chang and Straumal9 the reaction layer is in the liquid + Ni3Sn4 two-phase region at 150 °C, prior to its quenching. Even though both the Ni substrate and the Sn–20.48 at.% In–3.05 at.% Ag alloy are solid, a liquid phase is formed in the Sn–In–Ag/Ni couple at 150 °C.
The BEI micrographs of the Sn–20.48 at.% In–3.05 at.% Ag (Sn–20.0 wt% In–2.8 wt% Ag)/Ni couples reacted at 150 °C for (a) 3 h, (b) 15 h, (c) 120 h, (d) 240 h, and (e) 1440 h.

Although liquation that results from interfacial reactions at temperatures lower than the melting points of both substrates is unusual, a similar liquation phenomenon is found in the Sn–In/Ni couples. Reference Chen and Lin11,Reference Lin and Chen12 Since the melting points of the Sn–In–Ag solders are decreased by the addition of indium, Reference Okamoto8,Reference Chen, Lee, Hsu, Yang, Hsu and Wu13 the unexpected formation of a liquid phase in the Sn–In–Ag/Ni couples is probably the result of indium accumulation. The indium content in the Ni3Sn4 phase is similar to that in the Sn–20.48 at.% In–3.05 at.% Ag solder and the growth of the Ni3Sn4 phase consumes most of the indium without significant accumulation. As shown in Fig. 3(a), there is no Ni3Sn4 phase at the Ni interface. These results indicate that the indium accumulation is caused by a more pronounced diffusion of indium atoms toward the Ni substrate and the relatively slower nucleation rate of the Ni3Sn4 phase. If there is no formation of the Ni3Sn4 phase at the interface, the incoming indium enriches the solder at the interface, lowers its melting temperature and the liquid phase is thus formed. Nickel dissolves into the liquid phase and the Ni3Sn4 phase is then formed inside the liquid phase.
When the reaction time increased to 15 h, the liquid + Ni3Sn4 two-phase mixture becomes thicker and the Ni3Sn4 grains that are dispersed in the mixture become larger as shown in Fig. 3(b). In addition, the Ni substrate becomes nonplanar, and a large Ni3Sn4 phase with 14.3 at.% In is formed on the top of each spike of the Ni substrate. When the reaction time is increased to 120 h, similar results are noted. As shown in Fig. 3(c), the thickness of the two-phase mixture becomes thicker, the Ni3Sn4 grains (with 16.4 at.% In) that are dispersed in the mixture, as well as those at the interfaces, become larger, and some of the interfacial Ni3Sn4 grains are laterally connected with each other. The nonplanar surface of the Ni substrate is caused by the different consumption rates of the Ni substrate. At those sites on the Ni spikes with a Ni3Sn4 phase cap, the Ni3Sn4 phase acts as a diffusion barrier and protects the underlying Ni substrate from becoming corroded by the liquid phase; however, in the area where the Ni3Sn4 phase does not nucleate, the high corrosion rate at the Ni/liquid interface results in basin structures.
The entire reaction layer transforms to a single solid phase of Ni3Sn4 with 17.6 at.% In when the reaction time is further extended to 240 h. As shown in Fig. 3(d), there is no liquid phase, and isothermal solidification is observed. The results, which show the elimination of the liquid phase, are similar to those observed in transient liquid phase (TLP) bonding processes. Reference Macdonald and Eagar14 In TLP bonding processes, the liquid phases are formed at temperatures higher than the melting points of the solders and they disappear after their reaction with the substrate and the formation of intermetallic compounds. As mentioned previously, the indium accumulation in the early stage is caused by the fast incoming indium flux and the slower nucleation of the Ni3Sn4 phase. After the Ni3Sn4 phase has been nucleated, the excess indium is consumed gradually. If there is no significant indium accumulation, there is no liquid. Furthermore, the Ni substrate becomes level and the interface becomes planar. Since the growth of the reaction layer is controlled by the incoming fluxes from the solder side, the Ni spikes react faster, because of the shorter diffusion distance, and a planar interface is expected. Reference Vanloo15
Figure 3(e) shows the BEI micrograph for the Sn–In–Ag/Ni couples that were reacted at 150 °C for 1440 h. Similar to the results for those reacted for 240 h and those reacted at 100 °C, a Ni3Sn4 phase layer with 17.2 at.% In is formed, but the Ag2In precipitates agglomerates at the interface. However, as shown in Fig. 2, for the same reaction time of 1440 h, the Ni3Sn4 layer formed at 150 °C is as thick as 360 μm, whereas that formed at 100 °C is only 9 μm. It is rather unusual that only a 50 °C increase in temperature results in a 40 times increase in the reaction rate. With an understanding of the evolution of the reaction and liquation, it is clear that the extraordinary increase in reaction rate occurs because during most of the reaction time, the Ni reacts with molten solders, so the reaction rate is much faster.
IV. CONCLUSIONS
Ni3Sn4 is the interfacial reaction phase in Sn–In–Ag/Ni couples reacted at both 100 and 150 °C. However, the reaction paths evolve at 150 °C. In the earlier stage, a liquid phase is formed and the reaction path is solder/liquid + Ni3Sn4/Ni. As the reaction time is increased, isothermal solidification occurs and the reaction path again becomes solder/Ni3Sn4/Ni. The isothermal liquation phenomenon is a result of the accumulation indium, which is caused by the relatively faster diffusion rate for indium than for Sn and the nucleation of Ni3Sn4. If there is continuous growth of the Ni3Sn4 phase, the excess indium is consumed and the liquid phase disappears. The unexpected formation of a liquid is the primary reason for the very fast growth rate at 150 °C compared with that at 100 °C. Isothermal liquation, isothermal solidification, and the extremely high temperature dependence of the reaction rate are observed. It is unique to observe these three phenomena together in just one type of reaction couple.
ACKNOWLEDGMENT
The authors acknowledge financial support of the National Science Council of Taiwan (Grant No. NSC97-2221-E-007-067-MY3).