

INTRODUCTION
Urban centres have frequently represented the locus of political contention and change in sub-Saharan Africa. Given that Africa is now the fastest urbanising region of the world, cities on the continent are gaining even greater prominence today. The region's urban population is expected to increase by 300 million people by 2030, resulting in urbanites becoming the majority for the first time in Africa's history (Kessides Reference Kessides2006: 6).
Yet many have noted that this demographic shift has been accompanied by an increase in urban poverty (e.g. Haddad et al. Reference Haddad, Ruel and Garrett1999; Mitlin Reference Mitlin2004; Ravallion et al. Reference Ravallion, Chen and Sangraula2007; Satterthwhaite Reference Satterthwhaite2003). High unemployment and underemployment, environmental hazards and sub-standard public service delivery are among the challenges created by the region's rapid urbanisation. Such challenges are compounded by African governments' retention of legal frameworks for urban development that aim to contain settlement instead of confronting rapid growth (Hansen & Vaa Reference Hansen, Vaa, Hansen and Vaa2004: 9). One indication of this is that between 1990 and 2010, Africa's slum population increased from 103 million to 200 million people, prompting the United Nations to claim that urbanisation in Africa is ‘virtually synonymous with slum growth’ (UN-Habitat 2010).
Rapid urbanisation has occurred in concert with two other trends in the region: democratisation and decentralisation. During the 1990s, agitation in predominantly urban areas prompted transitions to multi-party democracy throughout Africa, ranging from Benin to Zambia. Greater political liberalisation, along with the growth of civil society and the need for African states to become more economically efficient, compelled many governments towards increased decentralisation (Ndegwa Reference Ndegwa2002; Stren & Eyoh Reference Stren, Eyoh, Eyoh and Stren2007). Donors likewise embraced this trend in the belief that local governments would be more effective in reducing poverty and delivering public services (Ndegwa Reference Ndegwa2002). Yet, while multiparty competition has proceeded apace in the region, decentralisation is for the most part stalled at the political and administrative levels. Fiscal decentralisation, the transfer of financial resources and responsibilities from the central government to sub-national units, remains minimal in most African countries. In fact, Ndegwa (Reference Ndegwa2002: 5) found that in nineteen out of thirty African countries, local governments control less than 5% of national public expenditures.
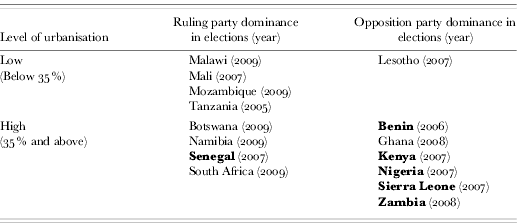
This study argues that Africa's urban development challenges are exacerbated by the combination of political party competition with circumscribed decentralisation. As indicated in Table 1, this issue is extremely relevant given that opposition parties are preferred in major urban areas in about half of Africa's electoral democracies.Footnote 1 Countries are classified as ‘ruling party dominant’ if the incumbent party during the country's most recent presidential elections received a majority of votes in the largest city. Similarly, a country is considered ‘opposition party dominant’ if an opposition party received a majority of votes in the largest city. Countries highlighted in bold have an opposition party that was elected to control the municipal council of that country's largest city.
Patterns of party support in the largest cities of Africa's electoral democracies
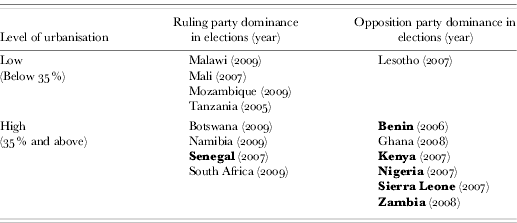
Sources: Urbanisation classification based on data from UN 2007. Election data calculated from each country's electoral commission or from Adam Carr's Election Archive, http://psephos.adam-carr.net/.
Countries in boldface have an opposition party controlling that country's largest city.
Where the opposition administers a major city but possesses little revenue, it remains dependent on the central government for transfers. However, the central government has a disincentive to allocate adequate resources to city governments for addressing the challenges of urban poverty. This disincentive stems from its fear that the opposition will obtain the credit for ameliorating the conditions of urban residents, and will therefore only increase its popularity amongst this constituency in subsequent elections.
The case of Lusaka, Zambia shows how provision of goods and services for the urban poor can be used as a political tool when political decentralisation is not accompanied by sufficient administrative and fiscal decentralisation. As seen in Table 1, Zambia is an electoral democracy where the opposition party received a majority of votes from residents within its largest city – the capital, Lusaka – during the most recent presidential elections. In 1991, the Movement for Multiparty Democracy (MMD) and its then leader, Frederick Chiluba, obtained strong support from urbanites and ended twenty-seven years of rule by Kenneth Kaunda and his United National Independence Party (UNIP). Yet since 2006, the opposition Patriotic Front (PF) has proved immensely popular in Lusaka and key cities in the country's Copperbelt Province.Footnote 2 While PF officials now control the Lusaka City Council (LCC), their efforts to improve development in the city are hindered by the LCC's dependence on intergovernmental transfers and its obligation to adhere to the policy dictates of the Ministry of Local Government and Housing (MLGH), which is controlled by the MMD.
The following section examines the factors driving Lusaka's growing urban inequality and current crisis in service provision and housing. Subsequently, primary data collected in Lusaka in early 2009 highlights the study's main argument. Semi-structured interviews were conducted with politicians, officials from the LCC, donors and local civil society organisations. These were complemented by a small-scale survey of 200 informal sector workers across ten markets in Lusaka. The study then provides a brief overview of similar dynamics in other opposition-led cities in Africa to illustrate that despite Zambia's long history of urbanisation, events in the country are not unique. Finally, the study discusses what the presence of opposition-controlled cities implies for donors relying on new aid modalities, such as budget support, to bolster urban development in Africa. Overall, the study contributes to a hitherto neglected issue: how party competition influences the effectiveness of local governance at a time when urban development challenges are expanding.
HISTORICAL OVERVIEW OF POVERTY AND INEQUALITY IN LUSAKA
Zambia is distinguished by its long history of urbanisation. As early as 1963, almost 20% of the population was living in urban areas (Seymour Reference Seymour1975: 72). Mining in Zambia's Copperbelt Province stimulated a high level of labour migration, and provided fertile ground for a range of urban anthropologists such as Epstein (Reference Epstein1981), Gluckman (Reference Gluckman1956) and Mitchell (Reference Mitchell1956). The Copperbelt was also a major centre of early political contestation, and many of the province's miners were ardent supporters of Kenneth Kaunda's UNIP when the party was first established in 1959 (Parpart Reference Parpart1984: 174).
Today, however, Lusaka is Zambia's largest city. The capital was founded in 1905 while building the railway from Cape Town to the mining areas of today's Democratic Republic of Congo (Hansen Reference Hansen, Ember and Ember2002: 80). By 1928, the city's population stood at only 1,879, not only because most economic opportunities were concentrated in the Copperbelt, but also due to colonial influx control measures (Myers Reference Myers2005: 107). British town planning principles resulted in Africans living in so-called ‘compounds’ on Lusaka's periphery, while wealthy Europeans and Asians resided in the city centre. Moreover, Africans were only allowed to live in the city so long as they were employed; otherwise, they were expected to return to their rural villages. Since permanent settlement was discouraged, housing options for Africans generally were limited (Taylor Reference Taylor2006).
Since then, the city has experienced two major waves of in-migration. At independence in 1964, the removal of the control measures resulted in a dramatic influx into the city, resulting in the population reaching 195,170 people (Myers Reference Myers2005: 107). A second wave occurred in the 1990s when the ruling MMD and then-president Chiluba implemented vast reforms under the auspices of a structural adjustment programme. As has been documented elsewhere (e.g. Myers & Murray Reference Myers, Murray, Murray and Myers2007; Tacoli Reference Tacoli, de Bruijn, van Dijk and Foeken2001), structural adjustment often hurt urban consumers by ending currency controls and price subsidies on staple foods, while simultaneously forcing uncompetitive domestic industries to shed workers or impose wage freezes. Between the years 1991 and 1998, privatisation of unproductive textile factories resulted in the halving of the number of workers in manufacturing jobs while restructuring in mining and quarrying contributed to a 40% decline in workers in that sector (McCulloch et al. Reference McCulloch, Baulch, Cherel-Robson, Van der Hoeven and Shorrocks2003: 244–5). Many working in the Copperbelt migrated to Lusaka in the hope of finding alternative opportunities. This internal migration, combined with the fact that Lusaka's youthful population experienced a higher natural population growth rate than any other region of Zambia (Mulenga Reference Mulenga2003: 4), caused Lusaka's population to grow by 38% over the 1990s (CSO 2003: 44).
Due to the dearth of government housing initiatives or private sector development, this demographic expansion placed pressure on scarce housing in the shanty compounds bordering the city centre (Hansen Reference Hansen, Ember and Ember2002; Mulenga Reference Mulenga2003). Such housing consists of concrete block walls and corrugated iron or asbestos sheet roofs, and roads in such communities are gravel with no drainage, making many impassable during the rainy season (World Bank 2002). According to the director of housing and social services for the LCC, about thirty-five such compounds exist in Lusaka, seven of which are considered illegal (Phiri 2009 int.). Illegal settlements are not eligible to receive government investment in physical infrastructure or social services (Hickey Reference Hickey, Jones and Nelson2005: 75).Footnote 3 In all, the shanty compounds contain the highest density of the city's population and are home to 70% of Lusaka's residents (UN-Habitat 2007: 14). Each rainy season brings a new outbreak of cholera, and overcrowding in these compounds increases susceptibility to airborne diseases, such as tuberculosis (Hansen Reference Hansen, Ember and Ember2002; UN-Habitat 2007). Moreover, due to a lack of proper infrastructure and internal plumbing, the communities in these compounds often are forced to share the same pit latrines and communal water taps (Taylor Reference Taylor2006).
The combination of higher prices for consumer goods and fewer jobs caused Lusaka's poverty rate to increase from 31 to 53% between 1991 and 1998 (CSO 2005: 137). By the mid 1990s, so many Zambians resorted to labouring in the urban informal sector that Lusaka's sidewalks were covered with street vendors and tuntembas – makeshift market stalls crafted out of wood and plastic.Footnote 4 As Hansen (Reference Hansen, Hansen and Vaa2004: 62) notes, street vending in the capital had reached ‘anarchic proportions’ by Christmas 1998: ‘Main streets, alleyways, and shop corridors in the city centre, and many other spots besides, had turned into one huge outdoor shopping mall where thousands of street vendors were selling all manner of goods.’
Historically, government treatment of shanty residents and informal sector workers has been highly erratic. Under the long tenure of the first post-independence party, UNIP, shanty compounds in Lusaka were considered a critical source of electoral support as UNIP attempted to wrest control from the popular Zambian African National Congress (ANC) and consolidate a one-party state (Hansen Reference Hansen1982; Seymour Reference Seymour1975).Footnote 5 Within a few years, however, the Zambian government began to view these settlements as a breeding ground for criminals and a blight on the capital city (Hansen Reference Hansen1982; Schlyter Reference Schlyter1998). Many of these settlements were either threatened with, or experienced, demolitions intended to expel the poor in order to provide more room for middle-class housing (Mulwanda & Mutale Reference Mulwanda and Mutale1994). With regard to the informal sector, UNIP engaged in low-level harassment of street vendors which nevertheless ‘lacked rigour or true commitment’ (Potts Reference Potts2007: 12). UNIP also implemented the Market Act, which made party membership a prerequisite for market workers to obtain stalls from which to sell their goods (Beveridge & Oberschall Reference Beveridge and Oberschall1979).Footnote 6
Under the MMD, ambivalence towards the urban poor continued. In 1991, the minister of local government and housing, Michael Sata, razed the homes of 500 families living in Kanyama's shanty compounds (Weekly Post 27.3.1992). A year later, about forty shacks in Kamwala Township were targeted by bulldozers to make way for more modern houses (Chitenje Reference Chitenje1993: 12). At the same time, Sata introduced the Street Vending and Nuisances Act, which levied fees on those engaged in street vending or who purchased from vendors. A particularly violent crackdown on street vendors in 1993 led to riots and prompted President Chiluba to intervene on the vendors' behalf (Hansen Reference Hansen, Hansen and Vaa2004: 65). By 1996, Chiluba adopted a conciliatory approach, establishing a Vendors' Desk at State House and appointing a deputy minister to be in charge of street and market vendors' affairs (War on Want 2006). By 1999, however, traders recognised the limits of their protection when the LCC engaged in a massive sweep across Lusaka that resulted in the destruction of hundreds of tuntembas in the city centre and in the residential townships on the periphery (Hansen Reference Hansen, Hansen and Vaa2004: 66). Apparently, Chiluba did not intervene on this occasion because the MMD realised that most vendors were not registered voters and therefore did not need to be co-opted in exchange for electoral support (Hansen Reference Hansen2010: 18).
Lusaka's urban poor have thus long endured an uneasy relationship with successive party regimes. Yet both the harassment of the urban poor and the impetus to improve urban services have become even more politicised today. As the next sections show, this is due both to greater political decentralisation without attendant fiscal or administrative capabilities, and to the presence of a viable political opposition, which was absent during much of UNIP's regime and rare during the first decade of the MMD's rule.
THE MMD VERSUS KING COBRA AT THE BALLOT BOX
Chiluba's successor, Levy Mwanawasa, considerably improved Zambia's economic circumstances during his first term in office, which spanned 2001–6. The country's inflation dropped to single digits and annual economic growth averaged about 5%, buoyed by improved copper prices and substantial external debt forgiveness (Economist 5.10.2006; Larmer & Fraser Reference Larmer and Fraser2007: 619). Mwanawasa also engaged in a concerted effort to combat corruption, including establishing a corruption taskforce and revoking Chiluba's immunity from prosecution on corruption charges (Mthembu-Salter Reference Mthembu-Salter and Frame2007).
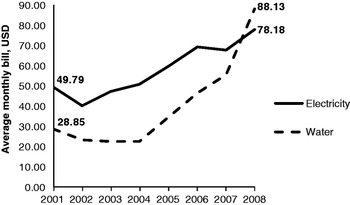
Yet life for the urban poor did not necessarily improve under Mwanawasa. Though poverty slightly decreased between 1998 and 2004, about 48% of Lusakans still lived below the poverty line (CSO 2005: 137). Service delivery remained sub-standard. For example, despite paying very high electricity bills relative to their incomes, residents in Lusaka's shanty compounds were burdened by frequent power outages that could last up to eight hours a day (Bupe Reference Bupe2006: 9). As seen in Figure 1, the average monthly bill for electricity and water for a family of four steadily increased during most of Mwanawasa's tenure. Moreover, just two months before the October 2006 elections, the monthly cost of basic food staples and essential non-food items totalled Kw 1,421,650, or $387 at 2006 exchange rates. This was more than double the average monthly household income of Kw 645,326 found in most of Lusaka's low-income neighbourhoods (JCTR 2006).
Trends in service costs in Lusaka, Zambia.

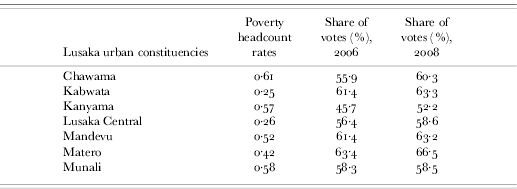
Michael Sata, who in his previous job as MMD minister for local government and housing had in the early 1990s demolished illegal compounds and endorsed crackdowns on informal sector workers, capitalised on urban disgruntlement with living conditions in the 2006 presidential elections.Footnote 7 Sata's political transformation began in 2001 when he founded the opposition Patriotic Front (PF) after being rejected by Chiluba as a potential presidential successor on the MMD ticket. Nicknamed ‘King Cobra’, this populist leader espoused an anti-elitist message in the 2006 presidential campaign that was oriented around the PF's slogan of ‘lower taxes, more jobs, more money in your pockets’. In addition, the PF's rallying cry of Pabwato, Bemba for ‘get on the boat’, implied that Zambians should join the party to escape the country's deluge of economic hardships. As seen in Table 2, this message proved fruitful in the 2006 elections, when Sata obtained significant shares of votes in all of Lusaka's urban constituencies, particularly in the poorest ones where shanty compounds are concentrated.
Presidential election results for Sata in Lusaka, 2006 & 2008
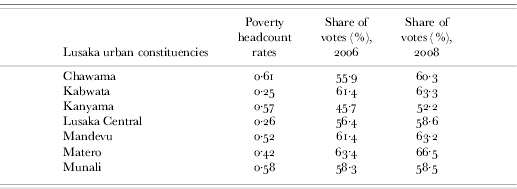
Sources: Election data calculated from the Electoral Commission of Zambia, http://www.elections.org.zm/. Poverty data from Simler (Reference Simler2007).
Note: These poverty rates are especially high given that Zambia does not have an urban-specific poverty line. The share of the population below the poverty line in these urban constituencies is based on the same standards that are applied for assessing deprivation among rural residents.
Sata's popularity translated into support for PF politicians who ran in the 2006 parliamentary and local elections. Not only did PF members of parliament (MPs) win all seven constituencies in Lusaka District, but PF loyalists also won most of the local election seats. Since the LCC comprises the seven MPs and thirty councillors (Mbolela et al. Reference Mbolela2004: 44), these victories provided the PF with control of the LCC, even as Mwanawasa retained the presidency and the MMD still possessed a majority in the National Assembly. Initially, Sata proclaimed that he would rule via the municipal councils (Chilemba Reference Chilemba2008: 1), which the PF controlled not only in Lusaka but also in a number of other cities in the country, particularly on the Copperbelt. This resulted in a major clash between the MMD and the LCC, with Lusaka's urban poor suffering as a result. In order to fully understand this dynamic, it is first necessary to recognise the structure of local governance in Zambia.
THE STATE OF LOCAL GOVERNANCE IN ZAMBIA
Though Zambia's first president, Kenneth Kaunda, espoused a commitment to strengthening local governance during the early years of his rule in the 1960s, the imposition of one-party rule in 1980 stalled such efforts. The 1980 Local Administration Act viewed local government largely as an extension of the administrative structure of the ruling party, which at the time was UNIP (Chikulo Reference Chikulo2009: 100). With democratisation in the 1990s, the 1980 Act was repealed and replaced with the 1991 Local Government Act, which not only introduced elections for local offices but also de-linked the relationship between the ruling party and the central government on the one hand and local government on the other (ibid.: 102).
Nevertheless, the government admitted that the Act did not result in a full devolution of functions and responsibilities to local government (RoZ 2006: 242). The councils possess sixty-six functions, including the provision of water, sufficient sewerage, and adequate housing (Chikulo Reference Chikulo2009: 103). Yet the MLGH is responsible for overseeing all of the country's councils (RoZ 2006: 242), and has the authority to suspend a council if its members are suspected of abusing their offices (Mbolela et al. Reference Mbolela2004: 44). Furthermore, the MLGH is required to approve local government decisions in setting by-laws and budget planning (McClean et al. Reference McClean2006: 50), which limits the autonomy of local governments to set their own agendas. Most significantly, fiscal decentralisation remains negligible. For instance, the LCC should theoretically raise revenue through licensing fees, levies, charges, and property rates (UN-Habitat 2007). In reality, local councils are severely constrained financially due, among other factors, to the privatisation of national utility companies over the last decade and tax exemptions for some property owners (Hampwaye Reference Hampwaye2008: 351–2; see also RoZ 2006: 242). Moreover, councils in Zambia cannot borrow or receive grants from foreign organisations and governments (UN-Habitat 2007: 17). According to the LCC's director of Housing and Social Services, the LCC can work directly with non-governmental organisations (NGOs) but donor funding only reaches the LCC at the discretion of the MLGH (Phiri 2009 int.).
These factors have resulted in a significant vertical imbalance, which occurs when local governments possess expenditure responsibilities that far outweigh their revenues and therefore have to rely heavily on transfers and grants from the central government. During a survey conducted in 2002, Lusaka's town clerk admitted that the city depends almost entirely on central government transfers in order to fulfil its administrative responsibilities (IDEA 2004: 142). Yet grants from the central government are typically allocated on an ad hoc basis, transfers are paltry, and councils' decisions on expenditure priorities are ultimately subject to MLGH approval (McClean et al. Reference McClean2006: 20; UN-Habitat 2007: 16).
Indeed, based on traditional indicators, Zambia is not a genuinely fiscally decentralised country. One measure is the expenditure ratio, which captures sub-national expenditures as a share of national expenditures (Oates Reference Oates1972). For Zambia as a whole, this is an incredibly small 3% (Olowu Reference Olowu2003: 42). Ndegwa (Reference Ndegwa2002: 4) measures fiscal decentralisation according to an index that takes into account both the expenditure ratio and whether there is an established formula for fiscal transfers from the central government. He finds that Zambia does quite poorly according to this index, obtaining 1·5 out of a possible 4.
Observers of Zambia's political and economic scene, as well as PF members, concur that financial constraints and administrative dictates are a major challenge to improving services within the city. The PF's Director of Research, Dr Chileshe Mulenga (2009 int.), notes: ‘At the present moment, Lusaka City Council doesn't control any resources. The MMD government decides how much money to give the Council. And even when they give it to them, the Council doesn't have the authority over how they will use the money.’ Likewise, a former Lusaka town clerk and the PF's current chairman for local government, Wynter Kabimba (2009 int.), claims: ‘No grants reach the LCC because the Ministry of Local Government is in charge of releasing money to the LCC. When the Ministry does release the money, it wants to take the credit for the programme it is funding.’ According to an anonymous governance specialist at the UK Department for International Development (DfID 2009 int.), government grants for the LCC are dispersed on a limited basis, and the LCC's resources are barely enough to cover staff wages. Furthermore, according to a World Bank representative with expertise on Zambia's public sector, no one really knows how the MLGH decides how to allocate money to the LCC (Palale 2009 int.).
LOCAL–NATIONAL GOVERNMENT TENSIONS IN LUSAKA
The fact that councils possess few resources and that LCC staff members must adhere to the MLGH's policies have resulted in the LCC becoming involved in measures aimed at alienating the PF's main constituency base: the urban poor. The late President Mwanawasa invested Kw 200 million in the ‘Keep Zambia Clean and Healthy’ campaign early in 2007 (Times of Zambia 22.6.2007). Designated to improve cleanliness and hygiene around the city, the campaign involved adding more stringent provisions to Zambia's Street Vending and Nuisances Act (ibid.). Crackdowns on street vendors and illegal marketers ensued because they supposedly worsened traffic congestion and street littering, and contributed to cholera outbreaks. For example, in mid 2007, the four-lane Freedom Way in downtown Lusaka was cleared of street vendors whose activities had made the road virtually impassable (Henriot 2009 int.). In June 2008, 400 makeshift stalls in Lusaka's Town Centre Market were razed by the LCC without warning and without offering traders alternative space (Times of Zambia 21.6.2008). Such actions were not limited to Mwanawasa's tenure. Under his successor, Rupiah Banda, the MLGH announced that it aimed to end all street vending by mid 2009 (Times of Zambia 29.5.2009).
The crackdowns also extended to shanty compounds. In March 2007, the Mwanawasa government announced full backing from the cabinet to proceed with plans to demolish illegal shanty compounds in Lusaka, some of which had been in existence for decades. Human rights groups warned that such actions would create a humanitarian emergency since alternative accommodation had not been provided for the displaced (Jere Reference Jere2007a). Nevertheless, under the protection of anti-riot police, the LCC proceeded to destroy hundreds of homes in the Kalikiliki and Misisi compounds (Jere Reference Jere2007b; Mwanangombe Reference Mwanangombe2007). Many were surprised by this decision, given that Mwanawasa had promised during the 2006 elections that he would not demolish any illegal compounds (Jere Reference Jere2007b).Footnote 8
The harassment of the urban poor was met by vocal protests from both elected LCC representatives and members of the PF hierarchy. For instance, after the March 2007 housing demolitions, Sata proclaimed that he would sue the state on behalf of the people who lost their homes (Mwape 17.4.2007). Moreover, Sata filed a court injunction in early 2008 to block a planned, massive removal of street traders in Lusaka (Times of Zambia 29.5.2009). When asked if the PF agreed with the repeated crackdowns on vendors, Sata (2009 int.) responded: ‘No, we have told the Minister of Local Government, “hands off”. Give us [the LCC] the money, we will listen to these people [vendors]. We don't want any coercion, we don't want any aggression of these people.’ The PF's vice-president, Dr Guy Scott (2009 int.), is also the MP for the constituency of Lusaka Central and therefore a LCC councillor. He notes that the elected councillors cannot dictate to the LCC permanent staff to ignore the MLGH, and so ‘they [LCC staff] keep getting forced into these operation clean-ups, which we do our best to sabotage’.
Despite widespread criticism from the PF and civil society groups, the MMD justified its actions on the basis of maintaining order and cleanliness, which presumably is believed to win kudos from investors. Indeed, for Hansen (Reference Hansen, Gewalt, Hinfelaar and Macola2007: 2), harassment of street vendors has been consistent with the MMD's goal of attracting foreign investors to a clean city. The same claims could also be applied to the MMD's actions in the shanty compounds. After the 2007 housing demolitions, when those left homeless threatened to sue the government for compensation, Mwanawasa claimed he would nonetheless continue the demolitions and stated: ‘If it [the demolition exercise] means removing them [illegal houses] to make the city clean, you do it’ (cited in Agence France Presse 26.4.2007). His minister for local government and housing at the time, Sylvia Masebo, also invoked the importance of upholding the law: ‘The exercise [the demolitions] will continue. Most of these houses were built on illegal plots and they had no planning permission whatsoever’ (cited in Jere Reference Jere2007b).
Such claims have some resonance among better-off Lusakans. The 2007 housing demolitions prompted a resident in Lusaka's wealthy Kabulonga neighbourhood to exclaim: ‘I support [the] government. These shanty houses are reducing the value of our properties’ (cited in Jere Reference Jere2007b). With respect to government removals of street vendors, an editorial in the Times of Zambia (1.6.2007) stated:
The removal of street vendors in Lusaka and other cities can also speak volumes of what benefits a clean town can have to its citizens. And for example in Lusaka people now have more space and fresh air when moving in the town centre after council and State police officers removed street vendors who had almost taken over every available space, including road sides.
These actions may provide the MMD with some support among wealthier constituents, but they broadly reflect both the ruling party's lack of a strategy to address the needs of the growing urban poor, and its attempts, via fiscal and administrative control of the LCC, to limit the opposition's ability to do any better. Key donors operating in the country observe that the government lacks an urban development programme around a coherent policy framework (DfID 2009 int.). Even within the MMD, there is recognition of this problem. Dr Mbita Chitala (2009 int.), one of the MMD's founding members who managed its national campaign in the 2006 and 2008 elections, admits that his party lacks clear programmes on housing: ‘There is a crisis of housing in all of our cities. There are no houses; people have to go and live in shanties.’ His colleague and MMD National Secretary, Dr Katele Kalumba (2009 int.), adds that he is unaware of any urban development strategy and notes that, instead, the MLGH tends to be more interested in ridding the cities of excess populations in the markets and residential areas. He candidly acknowledges that actions such as the ‘Keep Zambia Clean’ campaign were detrimental to his party's image among Lusaka's poor:
And I realised that we [the MMD] were really hurting a lot of our people by the approach that we were taking in enforcing the public hygiene measures. It touches upon whether the street or the town is the privilege of a certain group of people. Whose town is it? It appears that if you live in Woodlands, Kabulonga, and so on, you are the town owners, and if you live in Kaunda Square or Kalingalinga or places like this, you are simply strangers in the city who can be moved and resettled somewhere. Now that's a very significant ideological problem regarding our understanding of the city and its dynamic as a population–space relation.Footnote 9
Inter-party conflicts over service delivery provide further evidence that such harassment is not only symptomatic of a lack of an urban strategy but also politically motivated. For instance, flooding in the compounds during the rainy season and the attendant spread of cholera remain a perennial problem in Lusaka. Yet, the MLGH and Lusaka's PF councillors fought over the disbursement of money to the LCC to install proper drainage in the compounds to mitigate the flooding. Approximately Kw 16 billion was initially allocated to improving sewage and drainage facilities in the compounds of Chibolya, Misisi and Kanyama. Though such activities fall under the remit of the LCC, the money was to be released into an account within the Office of the Vice-President where it would be managed by a task force selected by the MLGH (see Zambian Parliament 2008). A month before Zambia's 2008 presidential elections, both MP Scott and the MP for Lusaka's Kabwata constituency, Given Lubinda, inquired from the minister of local government and housing why the funds were not forthcoming despite the imminent rainy season, but received no answer (Zambian Parliament 2008: 14). Insufficient funding coupled with poor capacity failed to thwart the flooding and the ensuing cholera outbreak, leading Dr Scott (2009 int.) to suspect political machinations in the whole affair:
You want to do something practical and then it gets worse if you get a fellow like our president or the Minister of Local Government who thinks this is a good idea to deprive us of support in the urban areas by blaming us for cholera. So, now the discourse is, ‘Who's responsible for the cholera?’ Not how to cope with it, but who is to blame for what we've seen so far.
This inter-party wrangling has turned the LCC into an arena for political competition rather than an institution targeted at improving the welfare of the city's residents. In this respect, the PF certainly is not blameless. For instance, Sata expelled from the PF a former Lusaka mayor, Susan Nakazwe, because as part of her ceremonial functions she joined MMD members in welcoming a visiting Chinese delegation at the national airport (Times of Zambia 2.3.2007). At the time, the PF professed a policy against Chinese intervention in the economy and Sata therefore banned any interaction between PF members and Chinese officials. Removing her required the councillors to hold a new set of elections and left the municipal entity without a leader for a substantial period. Such incidents contribute to complaints by the LCC administrative staff that they are working in a highly politicised environment, which is extremely disruptive to their mandate to manage the city (Matawe 2009 int.; Phiri 2009 int.).
Yet, notwithstanding Sata's own behaviour, there appears to be a political impetus underlying many MMD and MLGH decisions with respect to the management of Lusaka. In 2002, the government announced a National Decentralisation Policy as one of the three components of the country's Public Service Reform Programme (PRSP), which aimed to rectify the lack of de facto powers among the country's local councils (RoZ 2006: 236, 243). However, eight years later, the Policy has not yet been implemented. Among other factors, including the lack of local capacity within the councils, the government's reluctance is due to fears over opposition-led urban councils receiving credit if services begin to improve (Palale 2009 int.). By contrast, under the status quo, Lusaka's residents regularly complain about paying taxes and levies to the LCC but receiving poor services in return (Mbolela et al. Reference Mbolela2004: 44). By delaying further decentralisation, the MMD-led national government can continue to exploit the fiscal and administrative weaknesses of the LCC for political gain.
VIEWS OF THE URBAN POOR
However, as shown in Table 2, such actions by the MMD and the LCC did not diminish the PF's popularity in Lusaka's poorest constituencies during the subsequent 2008 elections. Likewise, Cheeseman and Hinfelaar (Reference Cheeseman and Hinfelaar2009: 22–3) find that Sata's main support in Lusaka during the 2008 elections was concentrated in high-density areas, which are predominantly those with large numbers of shanty compounds. They conclude: ‘It is therefore important to note that the core of Sata's support base in urban areas appears to lie not so much among those in full-time paid wage employment, but among more radical mineworkers and the unemployed in Zambia's poorest urban compounds.’
In order to obtain a better understanding of the political views and voting motivations of the urban poor, a survey was conducted in Lusaka between February and April 2009. The survey's sampling frame included 200 individuals who were eligible to vote based on age and citizenship, and who laboured as informal sector workers in the markets of Lusaka. Though the urban poor are not synonymous with informality, the non-agricultural informal sector does comprise almost 70% of employment in Lusaka (CSO 2007: 46). The average monthly income for an informal worker in Zambia is estimated at Kw 107,124, or $US23 at current prices (ibid.: 53). This is extremely low, given that the poverty line for the 2004 Living Conditions Monitoring survey was set at Kw 111,747 (CSO 2005: 132). Moreover, most of the city's shanty compound dwellers have at least one household member who depends on obtaining his/her meagre earnings in the informal sector (World Bank 2007: 82). Informal sector workers can thus offer insights on service delivery and housing within their compounds. Markets represent an appropriate location for sampling informal workers because these almost entirely comprise such individuals.
This working population was surveyed according to a two-stage clustered sampling procedure. In the first stage, ten markets were selected in Lusaka, spanning different electoral constituencies. Cluster sampling is an appropriate technique when the working population is so large that it would be prohibitively costly and time-intensive to randomly survey all of it (Rea & Parker Reference Rea and Parker2005), and sub-sampling through multiple stages is a common approach under circumstances where a list of the population is completely lacking (Groves et al. Reference Groves2004). Cluster sampling can be problematic in that it assumes that those within a cluster may be more homogeneous, and therefore less statistically independent, than those across clusters. One way to correct for any possible ‘design effect’ variance between clusters is to only sample a small but fixed number of respondents over a wider number of clusters (ibid.). Only twenty respondents were therefore surveyed across the ten markets. In the second stage, respondents were stratified according to gender.Footnote 10
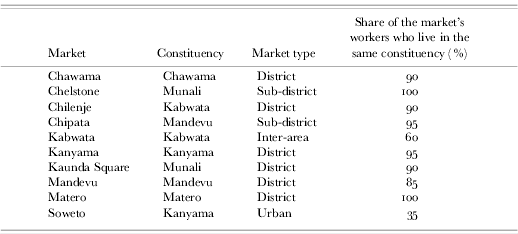
Table 3 lists the markets selected for the survey. Most of the respondents in these markets live in the constituency in which the markets are located. When compared with constituency poverty rates presented in Table 2, it therefore becomes clear that these workers live in some of the poorest areas of the city, especially those who labour in the markets in Chawama, Kanyama, Munali and Mandevu constituencies.
Markets in Lusaka selected for survey
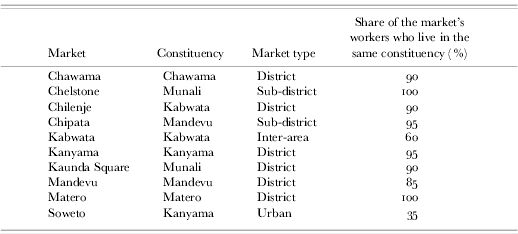
Source: Author's survey data.
Note: The market types are derived from the European Development Fund (1996).
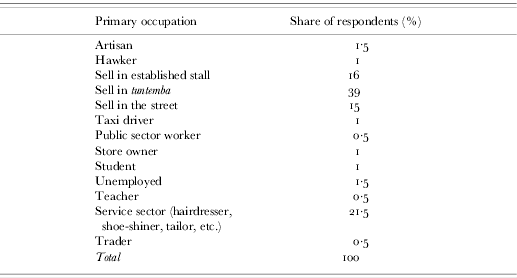
The prime occupation of those in the markets is vending, including retail goods such as clothing and house wares, agricultural products, and self-made foods and beverages. In Zambia in particular, a huge proportion of retail trade occurs in salauala, which means ‘pick from a pile’ (Taylor Reference Taylor2006: 90) and refers to second-hand clothing. Vendors can be particularly disadvantaged because most of them work in makeshift stalls constructed out of wood and plastic, simply sit on the ground, or engage in perambulatory vending on the edge of the markets. Such conditions not only provide marketers with little protection from inclement weather but also expose merchandise to rain, mud and heat, all of which may deter customers. Besides vendors, one can also find within the markets informal tailors, carpenters, butchers, hairdressers, shoe shiners, and those providing non-traditional services, such as charging mobile phones. Table 4 highlights the range of occupations of the respondents captured in the survey.
Summary of occupations of market workers
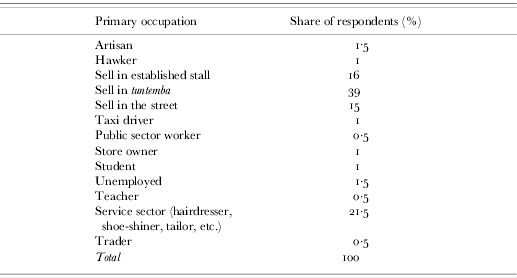
Source: Survey conducted by author. N=200.
Note: Tuntemba is the word for an informal structure, often consisting of wooden slats and plastic, from which many informal sector workers vend their goods.
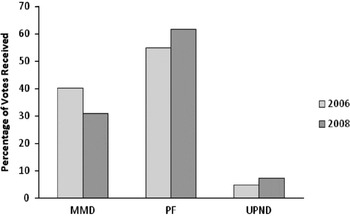
About 74% and 62% of survey respondents voted in the 2006 and 2008 elections, respectively. Those who did vote revealed that they were indeed enthusiastic supporters of the PF. As Figure 2 reveals, the PF increased its share of the vote from an already high 55% in the 2006 presidential elections to about 62% two years later. At the same time, the MMD's popularity in the capital city declined. During the period in which much of the hawker crackdowns, housing evictions and stalled inter-governmental transfers occurred, the MMD's share of votes dropped by almost ten percentage points amongst these respondents. The third party, the United Party for National Development (UPND), obtained only a marginal share of the votes in both elections.
Share of votes obtained by party from survey respondents in Lusaka, 2006 and 2008 elections.

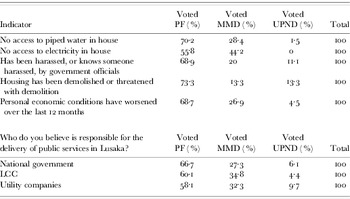
Furthermore, as seen in Table 5, PF supporters tended to be those who lacked key services, or who were affected by measures taken by the LCC. For instance, a larger share of those without access to piped water or electricity in their homes voted for the PF in the 2008 presidential elections than for the MMD. Likewise, almost 69% of respondents who personally experienced, or knew someone who experienced, harassment by government officials voted for the PF. A similar trend occurred with respect to those whose homes were demolished or threatened with demolition.
Public services and harassment by party supported in the 2008 presidential elections

Source: Survey of informal sector workers in Lusaka, Zambia conducted by author.
Note: N=123 respondents who actually voted in 2008.
Interestingly, as seen in Table 5, of those who believed that the national government was responsible for the delivery of public services, a majority were PF supporters. However, the PF also attracted a large share of voters who believed that public service delivery is the LCC's responsibility. At first, this appears counterintuitive given the expectation that the urban poor would be less likely to support the PF if they attribute the responsibility for their well-being to the LCC, which has not been sufficiently delivering services and was forced by the MMD to get involved in harassment of street vendors and housing demolitions. Yet, when asked directly about this apparent paradox, respondents noted that though the LCC is dominated by the PF, the central government controls it.
For instance, a woman over forty years old selling merchandise in the street in front of Matero market knew that the LCC had destroyed stalls in Kanyama market but said that she blamed the MMD for this rather than the PF (female marketer 2009 int.).Footnote 11 Similarly, a man between twenty-five and thirty years old, who sells goods from a makeshift stall in Chelstone market, claimed that even though his previous stall at Matero was destroyed, he did not hold the PF responsible because he believes the MMD effectively controls the LCC (male marketer 2009 int.). These views are more widely held. According to Nelson Ncube (2009 int.), who directs the People's Process on Housing and Poverty in Zambia, an NGO aimed at providing housing for the poor, the city's residents tend to attribute development outcomes to the national government: ‘I think that everything goes back to the central government. I think that no one really blames the local [government] … no matter how much I cry for the local authorities to deliver houses, I know how incapacitated they are resource-wise.’ Edward Chisenga (2009 int.), an informal sector worker and publicity director for Lusaka's Street Vendors Association, likewise attributes crackdowns on vendors to the national government and the MLGH: ‘the LCC has no option but to follow what the national government orders’. If these attitudes broadly reflect the general sentiment, then the MMD's strategy for reducing the PF's popularity appears to have backfired and damaged the ruling party's reputation instead.
beyond zambia
The tussle between parties over municipal authority also affects the welfare of the poor in major urban agglomerations in other African countries. In South Africa, one of Africa's more decentralised countries, tensions between the ruling ANC and the opposition Democratic Alliance (DA) recently came to the fore in Western Cape province. The ANC feared losing the Western Cape to the DA in the April 2009 elections because the latter possessed a good reputation for improving service delivery in the province's capital, Cape Town, which the DA has controlled since 2006. The day before the elections, the ANC provincial minister transferred authority for 1,000 hectares of land in the Western Cape from the province to the National Housing Agency. The suspected intention of this manoeuvre was to deprive the DA, which did eventually win control of the province, of its ability to fulfil its campaign promises to deliver key services. Specifically, the DA had originally planned to use the land for the construction of at least 100,000 houses, flood relief, and other service delivery projects (Ensor Reference Ensor2009). As Ensor observes: ‘The bottom line, ideologies aside, is that this ANC–DA fight is ultimately about securing votes, for which successful service delivery is the key.’ Since then, the ANC-led government also has made overtures to reverse progress on devolution and potentially even eliminate the country's nine provinces (Bownes Reference Bownes2009).
Factionalism within parties can also influence the degree of political will to address the challenges of urban development. Rakodi et al. (Reference Rakodi, Gatabaki-Kamau and Devas2000) illustrate how during the 1990s, Kenya's ruling party, Kenya African National Union (KANU), created disincentives for improving citizen welfare in municipalities controlled by its own party members. In the city of Mombasa, KANU removed the KANU-elected mayor Najib Balala, amid large-scale public protests, because he was too successful at reducing municipal corruption and improving refuse collection (ibid: 161). Therefore, Balala threatened to overshadow the popularity and power of elites in the upper echelons of the KANU hierarchy. A similar dynamic occurred more recently in Mozambique's port city of Beira. Davíz Simango, the mayor of Beira since 2003, belonged to the country's main opposition party, the Resistência Nacional de Moçambique (RENAMO). A highly effective mayor, Simango won international prizes for his administration of the city. Fearing his growing popularity as well as disgruntled by his refusal to offer jobs in the city council to former guerrilla fighters, RENAMO's leaders refused to back Simango's bid for a second term in office and expelled him from the party in 2008 (see EIU 2008).
* * *
This paper shows that inter-party, and even intra-party, competition can be detrimental to the functions of local governance and the provision of public services. The case of Lusaka demonstrates that competition between the ruling MMD and the opposition PF, in a context of stalled decentralisation, hindered efforts to improve sanitation, water delivery and proper housing. In addition, the MMD has attempted to involve the PF-dominated LCC in crackdowns on informal sector workers and demolitions of shanty compounds. While intended to undermine the PF's support amongst the urban poor, survey results and election outcomes demonstrate that this strategy resulted in the opposite effect. The PF received a much higher share of the votes amongst Lusaka's urban poor in both the 2006 and 2008 elections. Moreover, the existing evidence suggests that many residents recognise the LCC's circumscribed authority and therefore attribute the lack of services and the increase in harassment to the central government, rather than the local one.
These findings have important implications for the donor community because they suggest that certain aid modalities may be inappropriate for improving urban welfare. Specifically, a number of bilateral and multilateral donors, ranging from DfID to the United States' Millennium Challenge Corporation (MCC) and the World Bank, increasingly use budget support as a way to fund development projects. Generated by the desire to increase country ownership and donor harmonisation, budget support generally involves the allocation of predictable and regular flows of funds to developing country ministries of finance to be disbursed by central governments according to sectoral or national policies rather than for specific projects earmarked by donors (see DfID 2004: 3; Koeberle & Stavreski Reference Koeberle, Stavreski, Koeberle, Stavreski and Walliser2006: 5–6; Kolstad Reference Kolstad2005: 2).
Budget support is Zambia's preferred mode of receiving aid. As of 2006, budget support to the country totalled US$101 million (OECD 2006: 525). By 2009, DfID, the African Development Bank, the World Bank, the European Commission and the Scandinavian donors allocated almost US$170 million in budget support to the government (Times of Zambia 26.11.2009), much of which supports the country's Fifth National Development Plan (FNDP). Importantly, urban sector policies, including upgrading of unplanned settlements, safe water and sanitation, and waste management, represent a key element of the FNDP that donors are financing (ADF 2008: 2).Footnote 12 More generally, urban development represents a sector to which major donors, such as the World Bank, are attaching fewer and fewer conditionalities (see Koeberle & Walliser Reference Koeberle, Walliser, Koeberle, Stavreski and Walliser2006: 275).
A number of concerns with budget support have been cited in the literature, ranging from burdens on ministries of finance to limited capacity-building within sectoral agencies. Key amongst these is fiduciary risk, meaning that donors have little or no influence on spending categories once resources are transferred (Koeberle & Stavreski Reference Koeberle, Stavreski, Koeberle, Stavreski and Walliser2006: 15). This is particularly problematic for addressing urban development challenges in countries such as Zambia, where only the central government can receive donor funding. In a context of intense political competition, the central government may possess little incentive to bolster the credentials of the opposition by transferring sufficient funds to address urban service delivery. Precisely because cities represent the seat of economic power and are where opposition parties usually dominate in Africa, their oversight and administration is particularly vulnerable to political machinations. International funding towards the urban sector therefore requires greater oversight than budget support traditionally allows.
More broadly, this paper illustrates that rapid urbanisation and the accompanying increase in urban poverty places incredible strains on African governments to generate jobs for the millions labouring in the informal sector, provide proper homes for those living in slums, and ensure access to safe water and a sanitary living environment. The introduction of decentralisation efforts in many African countries was intended to bring decisions over these public services closer to those citizens who are most directly affected by them. Yet incomplete decentralisation processes in the context of young multi-party democracies present a significant bottleneck. Determining how to ensure that politicians' desire for votes complements, rather than competes with, commitments to citizens' well-being remains the critical task for achieving significant development outcomes both in the urban sector and beyond.