Implications
The presence of genetically modified (GM) ingredients in the human food chain has created consumer concerns regarding negative effects following consumption (Dona and Arvanitoyannis, Reference Dona and Arvanitoyannis2009; Martinez-Poveda et al., Reference Martinez-Poveda, Molla-Bauza, del Campo Gomis and Martinez2009). The absence of negative effects on growth and health indicators in pigs fed GM maize for 110 days in the present study indicates that Bt maize is well tolerated by the animal during an exposure of 110 days. The results of the present study provide additional safety assessment data on Bt maize for consumers, producers and policy makers.
Introduction
An 87-fold increase in the adoption of genetically modified (GM) plants worldwide since their introduction in 1996 makes it the fastest technology adopted in agriculture in recent years (James, Reference James2010). Insect-resistant GM varieties make up 24.6% of the maize grown globally (James, Reference James2010). Therefore, maize-based food and feed that are GM free have become difficult to source. The Bt MON810 maize expresses the bacterial cry1Ab gene and as a result produces a truncated Cry1Ab protein conferring resistance to a range of Lepidoptera insects (Schnepf et al., Reference Schnepf, Crickmore, Van Rie, Lereclus, Baum, Feitelson, Zeigler and Dean1998). Mammals lack the intestinal receptors for the Cry1Ab protein (Schnepf et al., Reference Schnepf, Crickmore, Van Rie, Lereclus, Baum, Feitelson, Zeigler and Dean1998) and are not believed to be affected by this toxin.
Consumer concerns regarding GM products relate mostly to unanticipated health effects that may arise from direct consumption of GM products or products from animals fed GM ingredients (Malarkey, Reference Malarkey2003; Dona and Arvanitoyannis, Reference Dona and Arvanitoyannis2009; Martinez-Poveda et al., Reference Martinez-Poveda, Molla-Bauza, del Campo Gomis and Martinez2009). Before market release in the European Union GM products are subjected to comprehensive short-term risk assessment, which cannot predict the consequences arising from long-term consumption by a genetically diverse population (Wal et al., Reference Wal, Hepburn, Lea and Crevel2003).
Several studies have found no detrimental effects of feeding GM maize on the growth of pigs (Reuter et al., Reference Reuter, Aulrich and Berk2002; Chowdhury et al., Reference Chowdhury, Kuribara, Hino, Sultana, Mikami, Shimada, Guruge, Saito and Nakajima2003; Custodio et al., Reference Custodio, Powers, Huff-Lonergan, Faust and Stein2006; Flachowsky et al., Reference Flachowsky, Aulrich, Böhme and Halle2007), poultry (Brake et al., Reference Brake, Faust and Stein2003; Aeschbacher et al., Reference Aeschbacher, Messikommer, Meile and Wenk2005) or ruminants (Aumaitre et al., Reference Aumaitre, Aulrich, Chesson, Flachowsky and Piva2002; Trabalza-Marinucci et al., Reference Trabalza-Marinucci, Brandi, Rondini, Avellini, Giammarini, Costarelli, Acuti, Orlandi, Filippini, Chiaradia, Malatesta, Crotti, Antonini, Amagliani, Manuali, Mastrogiacomo, Moscati, Naceur Haouet, Gaiti and Magnani2008). Higher feed intake and a tendency for higher kidney weight were observed in weanling pigs after 30 days of feeding GM maize (Walsh et al., Reference Walsh, Buzoianu, Gardiner, Cassidy, Rea, Ross and Lawlor2011). These findings highlight the need for longer-term studies investigating the effect of GM maize on pig health. Minor changes in liver and kidney histology and serum biochemical parameters have been reported in rats (Kilic and Akay, Reference Kilic and Akay2008) and mice (Finamore et al., Reference Finamore, Roselli, Britti, Monastra, Ambra, Turrini and Mengheri2008) in response to feeding GM maize. To our knowledge, no studies to date have investigated effects of GM maize on organ and intestinal health indicators in pigs throughout their entire productive life. Pigs are an excellent model for humans when considering similarities in digestive, liver and kidney anatomy and physiology (Bollen et al., Reference Bollen, Hansen and Rasmussen2000; Lewis and Southern, Reference Lewis and Southern2001; Swindle, Reference Swindle2007). Therefore, in addition to providing additional insight into possible physiological alterations in response to feeding GM maize to pigs, pig feeding studies may also provide data relevant to human nutrition.
The hypothesis of the present study was that there would be no differences in growth performance and health between pigs fed Bt maize or isogenic maize diets. The objective of this study was to determine the effect of feeding GM maize to pigs from 12 days post weaning (day 0) to slaughter (day 110) on health as assessed through measurements of growth rate, body composition, organ and intestinal weights and histology and clinical biochemistry. By alternating between GM and non-GM maize and vice versa after 30 days of feeding, the study was also designed to investigate any age-specific effect of feeding GM maize.
Material and methods
The pig study complied with European Union Council Directives 91/630/EEC (outlines minimum standards for the protection of pigs) and 98/58/EC (concerns the protection of animals kept for farming purposes) and was approved by, and a license obtained from, the Irish Department of Health and Children. Ethical approval was obtained from Teagasc and Waterford Institute of Technology ethics committees.
Animals and experimental design
A total of 72 crossbred (Large White × Landrace) entire male pigs were weaned at ∼28 days of age and provided with ad libitum access to a non-GM starter diet during a 12-day basal period. On day 0, pigs were blocked by weight and litter ancestry and within block randomly assigned to one of four treatments (n = 18 pigs/treatment), where day 0 was the first day experimental diets were fed. The four dietary treatments were as follows: (1) non-GM maize-based diet (isogenic parent line; Pioneer PR34N43) fed up to day 110 (non-GM); (2) GM maize-based diet (Bt; Pioneer PR34N44 event MON810) fed up to day 110 (GM); (3) non-GM maize-based diet fed for 30 days followed by GM maize fed up to day 110 (non-GM/GM); and (4) GM maize-based diet fed for 30 days followed by non-GM maize-based diet fed up to day 110 (GM/non-GM). The duration of the study was 110 days.
Housing and management
From weaning up to day 60 of the study, pigs were penned individually in one of three similar rooms each containing 24 pens. The pens were fully slatted (1.2 m × 0.9 m) with plastic slats (Faroex, Manitoba, Canada) and plastic dividers between pens. The temperature was controlled by a hot-air heating system and an exhaust fan drawing air from under slat level, both connected to a Stienen PCS 8400 controller (Stienen BV, Nederweert, the Netherlands). The temperature was maintained at 28°C in the first week post weaning after which it was reduced by 2°C per week to 22°C.
On day 60 of the study, pigs were transferred to one of four similar finisher rooms containing 18 individual pens per room and remained there until day 110 of the study. Pens (1.81 m × 1.18 m) were fully slatted with plastic panelled partitions. Ventilation was provided by exhaust fans and air inlets connected to a Stienen PCS 8200 controller (Stienen BV). Temperature was maintained at 20°C to 22°C.
During the study, water was available ad libitum from one nipple-in-bowl drinker (BALP, Charleville-Mezieres, Cedex, France) per pen. Feed was available ad libitum from a single stainless steel 30-cm-wide feeder per pen (O'Donovan Engineering, Coachford, Co. Cork, Ireland). Throughout the study, the dietary treatments were equally represented in each room to avoid additional variation due to environmental conditions. Pigs showing signs of ill health were treated as appropriate and all veterinary treatments were recorded.
Maize and diets
Seeds derived from GM Bt MON810 and non-GM parent line control maize (PR34N44 and PR34N43, respectively; Pioneer Hi-Bred, Sevilla, Spain) were grown simultaneously side by side in 2007 in Valtierra, Navarra, Spain by independent tillage farmers. The GM and non-GM control maize were purchased by the authors from the tillage farmers for use in this animal study. Samples from the GM and non-GM maize were tested for chemical, amino acid and carbohydrate compositions, as well as for presence of the cry1Ab gene, pesticide contaminants and mycotoxins as previously described by Walsh et al. (Reference Walsh, Buzoianu, Gardiner, Cassidy, Rea, Ross and Lawlor2011).
All diets were manufactured and analysed for chemical composition and amino acid concentration as previously described by Walsh et al. (Reference Walsh, Buzoianu, Gardiner, Cassidy, Rea, Ross and Lawlor2011). Sampling of the diets was conducted in accordance with international guidelines (ILSI, 2007). All diets were formulated to meet or exceed the National Research Council requirements for pigs of given weights (NRC, 1998). To avoid any animal health parameter perturbations due to undetected mycotoxins in the feed, an organic mycotoxin adsorbent (Mycosorb®, Alltech, Dunboyne, Co. Meath, Ireland) was included in all the diets used in the present study. Both non-GM and GM maize were offered in link diets fed from day 0 to 30, weaner diets fed from day 31 to 60, finisher 1 diets fed from day 61 to 100 and finisher 2 diets fed from day 101 to 110. Pellet hardness and durability were determined as described by Lawlor et al. (Reference Lawlor, Lynch, Caffrey and O'Doherty2003).
Growth, carcass characteristics and body composition
Body weight (BW) and daily feed intake were recorded on days 0, 30 and 60 and at the end of the study before slaughter (day 110) for the determination of growth performance (n = 15/treatment). Feed conversion ratio (FCR) was calculated as average daily feed intake (ADFI) divided by the average daily gain (ADG). Hot carcass weight was recorded immediately following slaughter and evisceration on day 110 of the study and values were multiplied by 0.98 to obtain cold carcass weight (n = 15/treatment). Dressing-out percentage was calculated by expressing carcass weight as a fraction of live weight at slaughter. Body composition of anaesthetised pigs (n = 10/treatment) was determined on day 80 of the study using dual energy X-ray absorptiometry technology as described by Ryan et al. (Reference Ryan, Lynch and O'Doherty2011).
Organ and intestinal sampling and histological analysis
On day 110, pigs were slaughtered by electrical stunning followed by exsanguination. The heart, kidneys, spleen and liver were removed, trimmed of any superficial fat or blood, blotted dry and weighed (n = 10/treatment). Samples were then taken from the liver (centre of quadrate lobe), kidney (cortex and medulla), spleen (anterior end), heart (left ventricle wall), mesenteric lymph nodes (close to ileo–caecal junction) and semitendinosus muscle (n = 10/treatment). Histological examination of these tissue samples was performed as outlined by Walsh et al. (Reference Walsh, Buzoianu, Gardiner, Cassidy, Rea, Ross and Lawlor2011). The stomach and small intestine were removed, emptied of contents, flushed with water, cleared of fat and connective tissue, blotted dry and weighed (n = 10/treatment). Intestinal tissue sampling and determination of villus height, width, crypt depth, villus height/crypt depth ratio and number of goblet cells per villus and per μm villus in the duodenum, jejunum and ileum (n = 10/treatment) were performed as described by Walsh et al. (Reference Walsh, Buzoianu, Gardiner, Cassidy, Rea, Ross and Lawlor2011).
Blood and urine sampling and analysis
Blood samples were collected from 10 pigs/treatment on days 0, 30, 60, 100 and 110 for serum biochemistry analysis. Blood samples were collected from the anterior vena cava of pigs on days 0 and 30, from the external jugular vein on days 60 and 100 and during exsanguination on day 110. Blood samples for serum biochemistry analysis were collected in serum collection tubes (BD Vacutainer Systems, Franklin Lakes, NJ, USA) and allowed to clot at room temperature for 2 to 3 h before centrifugation (2500 × g for 20 min). Serum was collected and stored at −20°C for subsequent biochemical analysis. Urine was collected in a sterile manner at slaughter by puncturing the bladder and stored at −20°C for the analysis of creatinine and protein levels.
Serum samples were analysed using an ABX Pentra 400 clinical chemistry analyser (Horiba ABX, Northampton, UK) for aspartate aminotransferase (AST), alanine aminotransferase (ALT), gamma glutamyltransferase (GGT), alkaline phosphatase (ALP), creatinine, urea and total protein (TP). Urinary protein and creatinine concentrations were also determined using an ABX Pentra 400 clinical chemistry analyser according to the manufacturer's instructions. For both serum and urine, the biochemistry analyser was calibrated according to the manufacturer's instructions. Analyser accuracy was maintained by analysis of samples of known concentration and all serum and urine samples were analysed in duplicate.
Urine collected on day 110 of the study was tested using dipsticks (Omega Diagnostics Ltd, Wicklow, Ireland) in accordance with the manufacturer's instructions. Dipstick analysis was performed for determination of glucose, bilirubin, ketones, specific gravity, blood, pH, protein, urobilinogen, nitrite and leukocytes.
Statistical analysis
All data with the exception of serum biochemistry and growth performance (BW, ADG, ADFI and FCR) data were analysed as a complete randomised block design using the GLM procedure of SAS (SAS Institute Inc., Cary, NC, USA). Organ weights were also analysed as a one-factor analysis of variance using the GLM procedure of SAS using BW on day 110 as a covariate in the model. Treatment effect was tested against residual error terms with initial BW and litter ancestry as blocking factors. Duncan's multiple range test was used for means separation. Serum biochemistry and growth performance data were analysed as repeated measures using the MIXED procedure of SAS with sampling day as the repeated variable. Simple effects were obtained using the slice option in SAS to determine differences between treatments at individual time points. Means separation was performed using the Tukey–Kramer adjustment for multiple comparisons. Fixed effects included pig, treatment and sampling day, whereas block was included as a random effect in the model. For serum biochemistry, day 0 values were used as a covariate in the model, whereas for growth performance parameters weight on day 0 was used as a covariate in the statistical model. Urine dipstick analysis data were analysed using the Kruskall–Wallis non-parametric test within the NPAR1WAY procedure of SAS. For all tests, the level of significance was P < 0.05 and tendencies were reported for 0.05 < P < 0.10. For all statistical analysis, the individual pig served as the experimental unit.
Results
Analysis of non-GM and GM diets
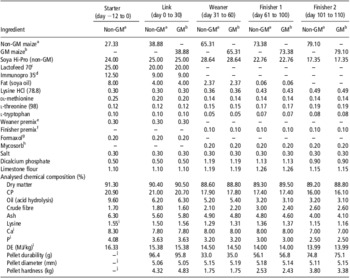
Similar chemical and amino acid composition were observed for the non-GM and the GM diets (Table 1).
Composition of diets – as is basis (%)

GM = genetically modified; DE = digestible energy.
aNon-GM, isogenic parent line maize.
bGM, Bt MON810 maize.
cLactofeed 70 contains 70% lactose, 11.5% protein, 0.5% oil, 7.5% ash and 0.5% fibre (Volac, Cambridge, UK).
dImmunopro 35 contains whey protein powder – protein 35% (Volac, Cambridge, UK).
ePremix provided per kg of complete diet: Cu, 155 mg; Fe, 90 mg; Mn, 47 mg; Zn, 120 mg; I, 0.6 mg; Se, 0.3 mg; vitamin A, 6000 IU; vitamin D3, 1000 IU; vitamin E, 100 IU; vitamin K, 4 mg; vitamin B12, 15 μg; riboflavin, 2 mg; nicotinic acid, 12 mg; pantothenic acid, 10 mg; choline chloride, 250 mg; vitamin B1, 2 mg; vitamin B6, 3 mg.
fPremix provided per kg of complete diet: Cu, 15 mg; Fe, 24 mg; Mn, 31 mg; Zn, 80 mg; I, 0.3 mg; Se, 0.2 mg; vitamin A, 2000 IU; vitamin D3, 500 IU; vitamin E, 40 IU; vitamin K, 4 mg; vitamin B12, 15 μg; riboflavin, 2 mg; nicotinic acid, 12 mg; pantothenic acid, 10 mg; vitamin B1, 2 mg; vitamin B6, 3 mg.
gFormaxol is a blend of encapsulated formic and citric acids and essential oils (Soda Feed Ingredients, Monte Carlo, Monaco).
hMycosorb® is an organic mycotoxin adsorbent (Alltech, Dunboyne, Co. Meath, Ireland).
iCalculated values.
jThe starter maize diet was formulated as meal.
Effects of feeding GM maize on health, growth performance, carcass characteristics and body composition
During the first 14 days of the study, 10 pigs died from oedema disease-like symptoms (three from the non-GM treatment, one from the GM treatment, three from the non-GM/GM treatment and three from the GM/non-GM treatment). As a preventive measure, injectable Enrofloxacin (2.5 mg/kg BW) was administered to all pigs between days 9 and 11 of the study. Between days 70 and 80 of the study, six pigs (two from the non-GM treatment, three from the GM treatment and one from the GM/non-GM treatment) were injected with Enrofloxacin (2.5 mg/kg BW) for 3 days to treat clinical symptoms of diarrhoea. Following treatment, all the pigs made a complete recovery.
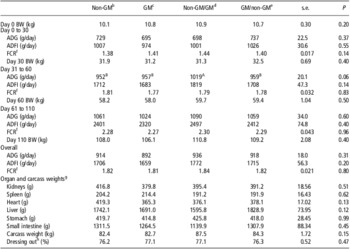
Growth performance of pigs was investigated over three time periods (days 0 to 30, 31 to 60 and 61 to 110) and overall (Table 2). No treatment × time interaction was observed for any of the growth performance parameters (data not shown). There was no effect of feeding GM maize to pigs on ADFI, FCR or BW at any time point during the study. There was a tendency for ADG to be higher for pigs fed the non-GM/GM treatment compared with all the other treatments between day 31 and 60 (P = 0.06; Table 2). Overall, ADG, ADFI, FCR and BW were not affected by feeding GM maize to pigs for 110 days from 12 days post weaning to slaughter.
Effect of feeding GM maize to pigs for 110 days on growth and on organ and carcass weights at day 110Footnote a

GM = genetically modified; BW = body weight; ADG = average daily gain; ADFI = average daily feed intake; FCR = feed conversion ratio.
a Data presented as treatment means and s.e.
b Non-GM, isogenic parent line maize diet fed from day 0 to 110.
c GM, Bt MON810 maize diet fed from day 0 to 110.
d Non-GM/GM, non-GM maize diet fed from day 0 to 30 followed by GM maize diet fed to day 110.
e GM/non-GM, GM maize diet fed from day 0 to 30 followed by non-GM maize diet fed to day 110.
f FCR was calculated as ADFI divided by the ADG.
g Organ weights were calculated with the final BW as a covariate in the statistical model.
h Dressing-out % was calculated as carcass weight divided by the day 110 BW.
AB Values within a row with different superscripts show a tendency towards statistical significance (0.05<P < 0.10). Means separation was performed using Tukey-Kramer adjustment for multiple comparisons.
On day 80 of the study, pigs fed the non-GM, GM, non-GM/GM and GM/non-GM treatments had similar fat percentages (11.9%, 13.2%, 13.0% and 12.0%, respectively; s.e. = 0.54), bone mineral content (1.05, 1.14, 1.18 and 1.18 kg, respectively; s.e. = 0.046) and area bone mineral density (0.93, 0.95, 0.96 and 0.93 g/cm2, respectively; s.e. = 0.016).
Effects of feeding GM maize on organ and intestinal weights and histology
The weights of the heart, kidneys, spleen and liver were not affected by feeding GM maize (Table 2). Likewise, treatment did not significantly affect empty weight of the stomach, small intestine, carcass weight or dressing-out percentage (Table 2).
Histological examination of the heart, kidney, spleen, liver, semitendinosus muscle and mesenteric lymph nodes did not indicate an effect of feeding GM maize (data not shown). None of the tissues presented any signs of haemorrhage or alteration of blood vessel integrity, oedema or fibrosis. Tissue hyperplasia and cell pigmentation were not present in any of the tissues examined. Subtle inflammation was observed in two of the samples (one heart from the GM treatment and one lymph node from GM/non-GM treatment) but was not present in any other samples examined. At the cellular level, no signs of nuclear or cytoplasmic fragmentation or shrinkage were seen. No pathological cytoplasmic inclusions or any signs of extensive cell apoptosis, degeneration or necrosis were observed in any of the tissues examined.
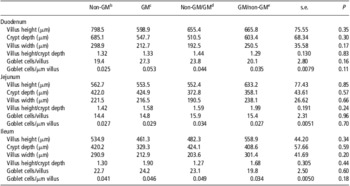
There was no effect of feeding GM maize to pigs on villus height or width, crypt depth, goblet cell number/villus and per μm of villus or villus height/crypt depth ratio measured in the duodenum, jejunum or ileum on day 110 of the study (Table 3).
Effect of feeding GM maize to pigs for 110 days on intestinal histologyFootnote a

GM = genetically modified.
a Data presented as treatment means and s.e.
b Non-GM, isogenic parent line maize diet fed from day 0 to 110.
c GM, Bt MON810 maize diet fed from day 0 to 110.
d Non-GM/GM, non-GM maize diet fed from day 0 to 30 followed by GM maize diet fed to day 110.
e GM/non-GM, GM maize diet fed from day 0 to 30 followed by non-GM maize diet fed to day 110.
Effects of feeding GM maize on serum and urine biochemistry
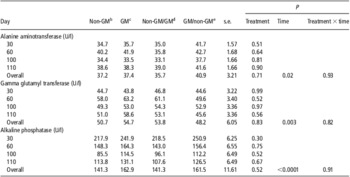
There was no effect of feeding GM maize to pigs on serum concentrations of the enzymes ALT, ALP and GGT measured throughout the study (Table 4). There was an effect of time on serum ALT, which increased up to day 60, decreased up to day 100 and increased again up to day 110 of the study (P < 0.05). A time effect was also observed for serum ALP, which decreased up to day 100 and increased up to day 110 (P < 0.01). Serum GGT increased up to day 60 and decreased thereafter (P < 0.001).
Effect of feeding GM maize to pigs for 110 days on serum biochemical parameters indicative of liver functionFootnote a

GM = genetically modified.
a Data presented as treatment means and s.e.
b Non-GM, isogenic parent line maize diet fed from day 0 to 110.
c GM, Bt MON810 maize diet fed from day 0 to 110.
d Non-GM/GM, non-GM maize diet fed from day 0 to 30 followed by GM maize diet fed to day 110.
e GM/non-GM, GM maize diet fed from day 0 to 30 followed by non-GM maize diet fed to day 110.
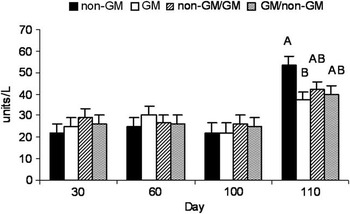
There was a treatment × time interaction for serum AST (Figure 1; P < 0.05). On day 110, pigs fed the GM treatment tended (P = 0.06) to have a lower serum AST concentration compared with pigs fed the non-GM treatment but were not different in all other treatments. Likewise, a time effect was observed for serum AST, which increased up to day 60, decreased up to day 100 and increased thereafter (P < 0.05).
Effect of feeding GM maize to pigs on serum aspartate aminotransferase (AST) concentration (U/l). Pigs were fed one of the four treatments as follows: (1) non-GM: isogenic parent line maize diet fed from day 0 to 110, (2) GM: Bt MON810 maize diet fed from day 0 to 110, (3) non-GM/GM: non-GM maize diet fed from day 0 to 30 followed by a GM maize diet fed up to day 110 and (4) GM/non-GM: GM maize diet fed from day 0 to 30 followed by a non-GM maize diet fed up to day 110. There was a treatment × time interaction for serum AST (P < 0.05). On day 110, pigs fed the GM treatment tended (P = 0.06) to have lower serum AST concentration compared with the pigs fed the non-GM treatment but were not different in all other treatments. Bars represent treatment means (n = 10) with their respective s.e. ABMeans without a common superscript differ by P = 0.05 to 0.10. Means separation was performed using Tukey–Kramer adjustment for multiple comparisons. GM = genetically modified.

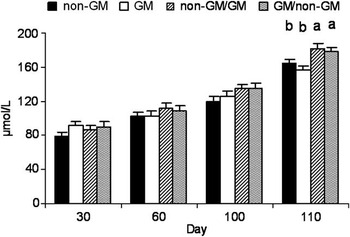
There was also a tendency for a treatment × time interaction for serum creatinine (SC; Figure 2; P = 0.10). On day 110, pigs fed the non-GM/GM and GM/non-GM treatments had higher SC concentration than the pigs fed the non-GM and GM treatments (P < 0.05). A time effect was also observed for creatinine concentration, which increased throughout the study (P < 0.05).
Effect of feeding GM maize to pigs for 110 days on serum creatinine (SC) concentration (μmol/l). Pigs were fed one of the four treatments as follows: (1) non-GM: isogenic parent line maize diet fed from day 0 to 110, (2) GM: Bt MON810 maize diet fed from day 0 to 110, (3) non-GM/GM: non-GM maize diet fed from day 0 to 30 followed by a GM maize diet fed up to day 110 and (4) GM/non-GM: GM maize diet fed from day 0 to 30 followed by a non-GM maize diet fed up to day 110. There was a tendency for a treatment × time interaction for SC (P = 0.10). On day 110, pigs fed the non-GM/GM and GM/non-GM treatments had higher SC concentration than the pigs fed the non-GM and GM treatments (P < 0.05). Bars represent treatment means (n = 10) with their respective s.e. abMeans without a common superscript differ by P < 0.05. Means separation was performed using Tukey–Kramer adjustment for multiple comparisons. GM = genetically modified.

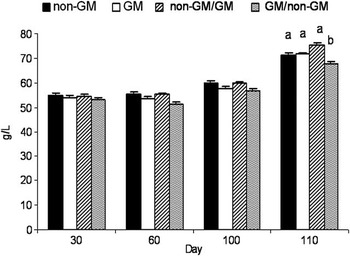
There was a treatment effect for serum TP concentration (Figure 3; P < 0.05). Pigs fed the GM/non-GM treatment had an overall lower serum TP concentration compared with pigs fed the non-GM/GM treatment; however, the only time when serum TP was different between treatments was on day 110. On day 110, serum TP was lower in the serum of pigs fed the GM/non-GM diets compared with all the other treatments. Serum TP also increased over time (P < 0.05).
Effect of feeding GM maize to pigs for 110 days on serum total protein (TP) concentration (g/l). Pigs were fed one of the four treatments as follows: (1) non-GM: isogenic parent line maize diet fed from day 0 to 110, (2) GM: Bt MON810 maize diet fed from day 0 to 110, (3) non-GM/GM: non-GM maize diet fed from day 0 to 30 followed by a GM maize diet fed up to day 110 and (4) GM/non-GM: GM maize diet fed from day 0 to 30 followed by a non-GM maize diet fed up to day 110. There was a significant treatment effect for serum TP concentration (P < 0.05). This overall treatment effect was a result of significantly lower TP on day 110 in the serum of pigs fed the GM/non-GM diets compared with all the other treatments. Pigs fed the GM/non-GM treatment had lower serum TP concentration on day 110 compared with all the other treatments. Bars represent treatment means (n = 10) with their respective s.e. abMeans without a common superscript differ by P < 0.05. Means separation was performed using Tukey–Kramer adjustment for multiple comparisons. GM = genetically modified.

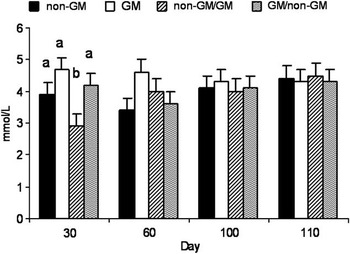
Furthermore, there was a treatment × time interaction for serum urea (SU; Figure 4; P < 0.05). On day 30, pigs fed the non-GM/GM treatment had lower SU concentrations than pigs on all the other treatments.
Effect of feeding GM maize to pigs for 110 days on serum urea (SU) concentration (mmol/l). Pigs were fed one of the four treatments as follows: (1) non-GM isogenic parent line maize diet fed from day 0 to 110, (2) GM Bt MON810 maize diet fed from day 0 to 110, (3) non-GM/GM: non-GM maize diet fed from day 0 to 30 followed by a GM maize diet fed up to day 110 and (4) GM/non-GM: GM maize diet fed from day 0 to 30 followed by a non-GM maize diet fed up to day 110. There was a treatment × time interaction for SU (P < 0.05). On day 30, pigs fed the non-GM/GM treatment had lower SU than pigs on all other treatments. Bars represent treatment means (n = 10) with their respective s.e. abMeans without a common superscript differ by P < 0.05. Means separation was performed using Tukey–Kramer adjustment for multiple comparisons. GM = genetically modified.

On day 110, the non-GM, GM, non-GM/GM and GM/non-GM treatments showed similar urinary concentrations of protein (5.78, 6.23, 4.79 and 5.24 g/l, respectively; s.e. = 1.125), creatinine (1.97, 2.14, 2.09 and 2.08 g/l, respectively; s.e. = 0.352) and protein/creatinine (3.47, 3.61, 2.75 and 3.52, respectively; s.e. = 0.810).
Effects of feeding GM maize on urine dipstick analysis
Leukocytes, nitrite, urobilinogen, bilirubin or glucose were at or below the limit of detection of the urine dipstick analysis test for all pigs. There was no treatment effect on urinary protein dipstick analysis. The mode from each treatment fell within the range 0.31 to 1 g/l with a 95% confidence interval (CI) of 0 to 3 g/l. Likewise, no treatment effect was observed for urinary pH for which modes for all treatments fell within 6 and 6.5 with a 95% CI of 6.5 to 8. Presence of red blood cells in urine did not differ between treatments, with modes for all treatments at the extremes of the test range (5 to 10 and 80 to 200 cells/μl), with a 95% CI of 5 to 200. Specific gravity was not different between treatments either, with modes for the non-GM, GM and GM/non-GM treatment being between 1.020 and 1.025 and for the non-GM/GM treatment being between 1.026 and 1.030, with a 95% CI of 1.010 to 1.030. There was no effect of treatment on urinary ketones. Ketones (5 mg/dl) were detected in the urine of a total of five pigs sampled (two from the non-GM treatment, two from the GM treatment and one from the non-GM/GM treatment). All the remaining pigs sampled tested negative for urinary ketones.
Discussion
To date, several studies have investigated changes in the growth rate and carcass quality of GM maize-fed pigs (Reuter et al., Reference Reuter, Aulrich and Berk2002; Hyun et al., Reference Hyun, Bressner, Fischer, Miller, Ellis, Peterson, Stanisiewski and Hartnell2005; Custodio et al., Reference Custodio, Powers, Huff-Lonergan, Faust and Stein2006). This is the first pig study to date conducted in order to investigate the effects of feeding GM MON810 maize on growth performance and health over the entire growing and finishing period. This not only provides data for animal production but also for human health using the pig as a model for human exposure. This is also the first study that investigates the growth and health implications of alternating between non-GM and GM maize varieties in pigs to investigate a potential age-specific GM maize effect.
Results from the current study demonstrated that long-term (110 days) feeding of GM maize to pigs had no adverse effects on growth performance and carcass characteristics. In agreement with these findings, previous work by our group also found that short-term (31 day) feeding of GM maize to weanling pigs had no adverse effects on growth (Walsh et al., Reference Walsh, Buzoianu, Gardiner, Cassidy, Rea, Ross and Lawlor2011). Numerous studies in pigs have documented inconsistent effects on growth rates and feed intake in response to feeding GM maize (Reuter et al., Reference Reuter, Aulrich and Berk2002; Hyun et al., Reference Hyun, Bressner, Fischer, Miller, Ellis, Peterson, Stanisiewski and Hartnell2005; Custodio et al., Reference Custodio, Powers, Huff-Lonergan, Faust and Stein2006). We found a transient increase in ADG between days 31 and 60 in pigs fed the non-GM/GM treatment compared with all the other treatments; however, this difference was only a tendency and it did not persist. The GM maize used in this study was previously reported to have a lower enzyme-resistant starch content than the non-GM maize (Walsh et al., Reference Walsh, Buzoianu, Gardiner, Cassidy, Rea, Ross and Lawlor2011). The enzyme-resistant starch content of food is known to influence satiety (Willis et al., Reference Willis, Eldridge, Beiseigel, Thomas and Slavin2009). Changing from the non-GM maize to the GM maize diet on day 30 in the current study may have resulted in a lack of satiety in pigs fed the non-GM/GM treatment. Therefore, the lower resistant starch content of the GM maize may account for the transient numerical increase in ADFI and the consequent tendency towards increased ADG observed in the non-GM/GM treatment compared with all the other treatments. This higher concentration in enzyme-resistant starch in the isogenic diet may have primed the animals to consume more of the GM feed, which was lower in enzyme-resistant starch. Feeding GM maize to pigs has been shown to increase feed intake in pigs from 17 to 120 kg (Custodio et al., Reference Custodio, Powers, Huff-Lonergan, Faust and Stein2006) and to increase daily gain in weanling pigs (Piva et al., Reference Piva, Morlacchini, Pietri, Piva and Casadei2001). Piva et al. (Reference Piva, Morlacchini, Pietri, Piva and Casadei2001), however, concluded that differences were due to a higher mycotoxin concentration in the non-GM maize and Custodio et al. (Reference Custodio, Powers, Huff-Lonergan, Faust and Stein2006) did not investigate mycotoxin contamination of the maize varieties used. Walsh et al. (Reference Walsh, Buzoianu, Gardiner, Cassidy, Rea, Ross and Lawlor2011) previously showed that mycotoxin concentrations for both the maize varieties used in the present study were below maximum allowable limits outlined in the European legislation (2006/576/EC; EU/165/2010). Similar to the findings of Reuter et al. (Reference Reuter, Aulrich and Berk2002), we found that feeding GM maize to pigs had no effect on carcass weight and dressing-out percentage. We also found that fat content of the body was unaffected by feeding GM maize to pigs. Similarly, Reuter et al. (Reference Reuter, Aulrich and Berk2002) found no difference in the amount of leaf fat surrounding the kidneys of pigs fed GM maize compared with the controls. Bone health of pigs in the current study was unaffected by feeding GM maize, and to our knowledge this has not been investigated previously.
In agreement with previous findings in weanling pigs (Walsh et al., Reference Walsh, Buzoianu, Gardiner, Cassidy, Rea, Ross and Lawlor2011), histology of the small intestine was not affected by feeding GM maize to pigs. Furthermore, there was no change in the weight of the stomach or small intestine as also shown by others in rats (Kilic and Akay, Reference Kilic and Akay2008) and salmon (Sanden et al., Reference Sanden, Berntssen, Krogdahl, Hemre and Bakke-Mckellep2005) fed GM maize. Fares and El-Sayed (Reference Fares and El-Sayed1998) described evidence of histological alterations in the ileum of mice fed potatoes treated with purified Bacillus thuringiensis δ-endotoxin; however, feeding GM potatoes expressing the same δ-endotoxin failed to elicit a similar response. As the pig and human digestive tract share numerous similarities (Moughan et al., Reference Moughan, Birtles, Cranwell, Smith and Pedraza1992; Lewis and Southern, Reference Lewis and Southern2001), a lack of an adverse effect should be expected in humans following GM maize consumption.
No organ dysfunction was identified in the present study in response to feeding GM maize. Organ weights were similar between treatments and no abnormalities were observed following histopathological examination. Previous work from our group reported a tendency for higher kidney weights in weanling pigs following 30 days of GM maize feeding (Walsh et al., Reference Walsh, Buzoianu, Gardiner, Cassidy, Rea, Ross and Lawlor2011), a difference which was not associated with histopathological or blood biochemical changes. A three generation (Kilic and Akay, Reference Kilic and Akay2008) and a 90-day (Hammond et al., Reference Hammond, Dudek, Lemen and Nemeth2006) rat study, as well as an 8-month study in salmon (Sanden et al., Reference Sanden, Berntssen, Krogdahl, Hemre and Bakke-Mckellep2005) documented no differences in organ weights following GM maize consumption. Likewise, pigs fed GM maize during a 91-day growing period also showed no alterations in organ weight (Reuter et al., Reference Reuter, Aulrich and Berk2002).
We found that the liver enzyme AST tended to be lower in pigs fed the GM treatment compared with the non-GM treatment following 110 days of exposure. Previously, we reported no change in serum liver enzymes in pigs fed GM maize for 31 days (Walsh et al., Reference Walsh, Buzoianu, Gardiner, Cassidy, Rea, Ross and Lawlor2011). A study by Kilic and Akay (Reference Kilic and Akay2008) found no changes in serum enzymes in rats fed GM maize but focal infiltration, congestion and degeneration of the liver was reported. Elevated serum GGT and changes in nuclei structure were observed in the liver of lambs fed GM maize (Trabalza-Marinucci et al., Reference Trabalza-Marinucci, Brandi, Rondini, Avellini, Giammarini, Costarelli, Acuti, Orlandi, Filippini, Chiaradia, Malatesta, Crotti, Antonini, Amagliani, Manuali, Mastrogiacomo, Moscati, Naceur Haouet, Gaiti and Magnani2008). Unlike our study, these studies did not completely investigate the potential for contamination of the GM maize, as it has been shown that contaminants such as mycotoxins are known to affect liver histology and liver health indicator enzymes (Casteel et al., Reference Casteel, Turk, Cowart and Rottinghaus1993). In any case, further work is needed to investigate why these effects were observed in these previous studies. In the current study, we found no changes in serum GGT, ALT and ALP. The change in serum AST found in GM maize-fed pigs was not correlated with a change in liver weight or evidence of histopathology. Liver toxicity is characterized by a 10- to 70-fold increase in AST and a 5- to 10-fold concomitant increase of ALP and GGT (Kaneko, Reference Kaneko1980; Casteel et al., Reference Casteel, Turk, Cowart and Rottinghaus1993), none of which were evident in this study. In addition, the observed differences in AST were minor, were not correlated with histopathology and the values were all within the normal reference intervals for pigs of this age (Stonard, Reference Stonard1990). In the present study, although significant differences between treatments did not reach values indicating toxicity, further investigation is necessary.
SU concentrations were lower in pigs fed the non-GM/GM treatment on day 30. Up to this point of the study, these pigs had only been fed non-GM maize similar to pigs fed the non-GM treatment. Urea is a nitrogen source that is readily used by gastrointestinal microbiota to sustain periods of prolific growth when supplies of fermentable carbohydrates are abundant (Younes et al., Reference Younes, Garleb, Behr, Rémésy and Demigné1995b). This increased microbial demand for urea has been shown to be satisfied through urea diffusion from the blood into the caecum and colon (Younes et al., Reference Younes, Demigné, Behr and Rémésy1995a and Reference Younes, Garleb, Behr, Rémésy and Demigné1995b), thereby lowering SU concentrations. The non-GM maize used in this study was higher in enzyme-resistant starch than its GM counterpart (Walsh et al., Reference Walsh, Buzoianu, Gardiner, Cassidy, Rea, Ross and Lawlor2011). Therefore, we hypothesise that there was more hindgut microbial fermentation in the non-GM maize-fed pigs, and thus more urea diffused from the blood into the hindgut, lowering SU concentrations. High dietary fibre content has previously been shown to decrease SU in rats (Younes et al., Reference Younes, Demigné, Behr and Rémésy1995a and Reference Younes, Garleb, Behr, Rémésy and Demigné1995b) and pigs (Mosenthin et al., Reference Mosenthin, Sauer and de Lange1992a and Reference Mosenthin, Sauer, Henkel, Ahrens and de Lange1992b; van der Meulen et al., Reference van der Meulen, Bakker, Bakker, de Visser, Jongbloed and Everts1997). In contrast to the current findings, previous work from our group found no effect of feeding GM maize on weanling pig SU levels (Walsh et al., Reference Walsh, Buzoianu, Gardiner, Cassidy, Rea, Ross and Lawlor2011). Pigs fed the non-GM treatment in the current study had similar SU concentrations to the GM and GM/non-GM treatments, although numerically lower. The change in SU levels documented in this study was transient and isolated up to the day 30 sampling time point, which questions the biological relevance of this change.
Feeding pigs the GM/non-GM treatment resulted in lower serum TP, whereas SC increased in pigs fed the non-GM/GM and GM/non-GM treatments following 110 days of feeding. Kidney dysfunction is characterised by elevated SU and SC levels, low serum TP (Baum et al., Reference Baum, Dichoso and Carlton1975; Kaneko, Reference Kaneko1980; Stonard, Reference Stonard1990) and increased urinary protein-to-creatinine ratio (P/C; Baum et al., Reference Baum, Dichoso and Carlton1975). On day 110 of the present study, SU, urinary P/C and urine dipstick analysis revealed no differences between treatments. Although urinary dipstick analysis can only provide a gross estimate of kidney function, it is a helpful tool that may indicate differences that can be further investigated by more accurate biochemical methods. The absence of kidney histopathology and the similar kidney weights observed in the current study further support the lack of an adverse effect on pigs’ kidney function arising from GM maize exposure. Elevated SC may also be indicative of extensive muscle catabolism (Kaneko, Reference Kaneko1980), which was not observed by histopathological examination in the current study and no treatment effect was observed for carcass weight or body composition. Numerous studies have reported a lack of an effect of GM maize on blood biochemistry in weanling pigs (Walsh et al., Reference Walsh, Buzoianu, Gardiner, Cassidy, Rea, Ross and Lawlor2011), calves (Shimada et al., Reference Shimada, Murata, Mikami, Yoshioka, Guruge, Yamanaka, Nakajima and Miyazaki2006) and rats (Hammond et al., Reference Hammond, Dudek, Lemen and Nemeth2006) or on serum TP in sheep (Trabalza-Marinucci et al., Reference Trabalza-Marinucci, Brandi, Rondini, Avellini, Giammarini, Costarelli, Acuti, Orlandi, Filippini, Chiaradia, Malatesta, Crotti, Antonini, Amagliani, Manuali, Mastrogiacomo, Moscati, Naceur Haouet, Gaiti and Magnani2008). A decrease in serum TP was described in rats fed GM maize for three generations (Kilic and Akay, Reference Kilic and Akay2008) and in rats fed GM rice (Schrøder et al., Reference Schrøder, Poulsen, Wilcks, Kroghsbo, Miller, Frenzel, Danier, Rychlik, Emami, Gatehouse, Shu, Engel, Altosaar and Knudsen2007). Kilic and Akay (Reference Kilic and Akay2008) found that serum TP of rats fed GM maize was lower only compared with rats fed non-GM maize but was similar to that of rats fed a commercial control diet. However, in these studies, mycotoxin contamination was not investigated and it has been shown that mycotoxins could lead to liver damage, and thus reduced serum TP (Casteel et al., Reference Casteel, Turk, Cowart and Rottinghaus1993). Similar to findings from the present study, the lower serum TP observed by Schrøder et al. (Reference Schrøder, Poulsen, Wilcks, Kroghsbo, Miller, Frenzel, Danier, Rychlik, Emami, Gatehouse, Shu, Engel, Altosaar and Knudsen2007) in rats did not occur in conjunction with histological or organ weight changes, thus questioning the biological relevance of this alteration.
Because of the complexity of organ dysfunction, a change in a single biochemical health indicator cannot be used alone to characterise pathology. Only the development of a specific pattern of biochemical changes should be used to identify the manifestation of organ dysfunction (Boone et al., Reference Boone, Meyer, Cusick, Ennulat, Bolliger, Everds, Meador, Elliott, Honor, Bounous and Jordan2005). Therefore, any conclusion regarding the development of an adverse health effect should be reached following the correlation of serum biochemistry with organ weight and/or histological evidence (Stonard, Reference Stonard1990; EFSA, 2008).
In conclusion, feeding GM maize to pigs from 12 days post weaning up to slaughter did not adversely affect growth, carcass characteristics, bone health or body composition. Although some changes in serum biochemistry were observed, values were all within the normal reference intervals for pigs (Kaneko, Reference Kaneko1980; Radostits, Reference Radostits, Gay, Hinchcliff and Constable2007), did not conform to a pattern indicative of organ dysfunction and were not correlated with differences in organ weight or histopathology. Histological examination indicated the absence of an adverse effect of GM maize at the main site of nutrient digestion and absorption, that is, the small intestine. This study indicates that GM Bt MON810 maize is safe as an ingredient in swine diets. Finally, there is little evidence to suggest that adverse health effects should be expected in humans following GM maize consumption. Further work is needed to assess the effects of feeding GM maize to pigs over multiple generations.
Acknowledgements
The research leading to these results received funding from the European Union's Seventh Framework Programme (FP7/2007-2013) under grant agreement number 211820 and the Teagasc Walsh Fellowship programme. None of the authors had a financial or personal conflict of interest regarding the present study and the work was conducted independently of any commercial input, financial or otherwise. The authors thank Tomas Ryan for assistance with pig management and Anthony Blais for technical assistance. Likewise, the authors acknowledge Michael Harrison for help with the serum biochemistry analysis and Serenia Horgan for help with the preparation of samples for histological examination.