In recent years, the use of lactoferrin as an ingredient in foods has become of particular interest due to its unique iron-binding capacity properties, providing numerous biological functions including antimicrobial and antioxidant activity (Huang et al. Reference Huang, Satue-Gracia, Frankel and German1999; Medina et al. Reference Medina, Tombo, Satue-Gracia, German and Frankel2002; Lönnerdaal, Reference Lönnerdaal2003). Non-iron related functions have also been ascribed to lactoferrin, such as immunomodulatory action, contribution to the formation of good gut flora, and host-protective effects (Tomita et al. Reference Tomita, Wakabayashi, Yamauchi, Teraguchi and Hayasawa2002).
Lactoferrin is a glycosylated protein with a molecular weight of 80 kDa and is present in most external secretions of mammals, including milk. Lactoferrin contains a single polypeptide chain with 689 amino acid residues. The protein is folded into two homologous globular lobes (its N- and C- terminal halves) joined by a short α-helix peptide (Sørensen, Reference Sørensen and Sørensen1939; Lönnerdaal & Iyer, Reference Lönnerdaal and Iyer1995; Baker et al. Reference Baker, Baker and Kidd2002).
Lactoferrin is one of the few proteins in milk with a high isoelectric point, reported to be between 8·0 and 9·0 depending on the experimental method used (Shimazaki et al. Reference Shimazaki, Kawaguchi, Sato, Ueda, Tomimura and Shimamura1993). The high isoelectric point implies a positive charge for this protein at neutral pH, and this may be of particular interest for the protein's processing functionality. This unique difference has lead to studies on the formation of oil-in-water emulsions using lactoferrin cationic emulsion droplets (Ye & Singh, Reference Ye and Singh2006; Ye, Reference Ye and Singh2007; Sarkar et al. Reference Sarkar, Goh and Singh2009).
It has been previously demonstrated that stable, positively charged oil droplets can be prepared using lactoferrin, and that variations in pH from 3·0 to 7·0 cause little change in the charge of the droplet when diluted in water (Ye & Singh, Reference Ye and Singh2006; Ye, Reference Ye and Singh2007; Sarkar et al. Reference Sarkar, Goh and Singh2009). It has also been shown that emulsions prepared with equal proportions of lactoferrin and β-lactoglobulin, the latter negatively charged at neutral pH, results in emulsion droplets with both proteins adsorbed at the interface and with a neutral surface charge at pH 7·0 (Ye & Singh, Reference Ye and Singh2006). These authors suggested that, under these conditions, an electrostatic complex forms between the two proteins creating multilayered emulsion droplets.
Despite the existing data on the interactions between lactoferrin and β-lactoglobulin, little is known about the behaviour of lactoferrin-covered oil droplets when used in a more complex system such as milk. Lactoferrin is currently being used as a functional ingredient in foods, although very little has been reported on the reactivity of this surface-active molecule.
The aim of this study was to look at the stability of milk recombined with oil droplets covered with lactoferrin. It is not known whether the complex mixture of salts, sugars and additional proteins present in milk might influence the colloidal properties of a lactoferrin-stabilized emulsion. This research will aid into the development of fortified dairy products containing lactoferrin.
Materials and Methods
Lactoferrin powder (93% LF, 4·7% other milk proteins, 1% moisture, 1·3% ash) was obtained from BioPole S.A. (Epalinges, Lausanne, Switzerland). Soybean oil was purchased from Aldrich (Sigma-Aldrich Canada Ltd., Oakville, Ontario, Canada). Skim milk powder was supplied by Parmalat (London, ON, Canada). β-lactoglobulin was purified in the laboratory following the method described by (Andrews et al. Reference Andrews, Taylor and Owen1985). Sodium caseinate was obtained from New Zealand Milk Products (Alanate, 180, NZMP, Lemoyne, PA, USA). Milk serum was prepared from fresh milk obtained from the Elora Dairy Research Station (Elora, ON, Canada), with sodium azide (0·02% w/v) added to prevent bacterial growth. Separation of the milk fat portion was conducted by centrifugation of the whole milk at 4000 g for 20 min, at 4°C (Beckman J2-21 centrifuge, Beckman Coulter, Mississauga, Canada) and further filtration (four times) through Whatman fiberglass filters (Fisher Scientific, Whitby, Canada). To obtain milk permeate to use in the dilution of the emulsion system, ultrafiltration was performed at 25°C using a regenerated cellulose cartridge (PLGC 10 KDa cut off Millipore Corp., Bedford, MA). The serum (or permeate) was kept in the refrigerator until used.
Emulsion preparation
Protein solutions (final concentrations of 0·05, 0·10, 0·25, 0·5, and 1·0% w/v) were prepared by dispersing LF powder into ultrapure water and stirring for 2 h at room temperature to ensure complete dispersion. The protein solutions were filtered through a 0·45 μm filter (Fisher Scientific, Mississauga, ON, Canada). Soy oil was added to the protein solutions to form a final emulsion containing 20% by volume. The mixture of protein solution and soy oil was pre-homogenized for 1 min with a high-speed blender (Power Gen 125, Fisher Scientific, Mississauga, ON, Canada) and then homogenized with two passes through a one-stage homogenizer (Nano DeBee, BEE International, MA, USA) at a pressure of 34 MPa. The 20% oil emulsions containing 1% lactoferrin were also adjusted to various pH values in the range from 3·0 to 7·5 using 0·1 m-NaOH or 0·1 m-HCl. To test the stability of these emulsions under different salt conditions, the emulsions were also diluted in two different salt solutions at two different concentrations each, 50 and 100 mm-NaCl and 25 and 50 mm-CaCl2. All emulsions were stored at 4°C and used within two days of preparation.
Recombined milk
Skim milk powder was reconstituted by dispersion in ultrapure water at 60°C to a final weight concentration of 20%, and stirred for 2 h at room temperature. Sodium azide (0·02% w/v) was added to the milk to inhibit bacterial growth. The reconstituted milk was then refrigerated (4°C) overnight to ensure complete dispersion. Skim milk and lactoferrin emulsions (prepared at pH 6·6) were then diluted in a 1:1 ratio to obtain a final casein micelle and emulsion volume fraction of 10% and 10% respectively. Similarly, a solution of 0·4% (w/w) β-lactoglobulin or 2·4% (w/w) sodium caseinate dispersed in milk serum was diluted 1:1 in the lactoferrin emulsion prepared in serum at pH 6·6 (for a final concentration of 0·2% and 1·2% (w/w) respectively), to obtain a 10% oil-in-water emulsions containing additional un-adsorbed protein.
Emulsions characterization and stability
Integrated light scattering (Mastersizer 2000, Malvern Instruments, Malvern, U.K.) was used to determine the size distribution of the lactoferrin emulsions in water or water plus salts. Droplet size measurements are reported as the Sauter-average diameter d32=Σnidi3/Σnidi2 (where ni is the number of particles with diameter di). The indices of refraction used were 1·33 for water and 1·45 for the oil droplet. Values are the average of at least duplicate measurements.
Dynamic Light Scattering (DLS) and ζ-potential measurements were performed with a Zetasizer Nano-ZS (Malvern Instruments, Malvern, U.K). Samples were diluted approximately 3000 times in ultrapure water, or milk serum which was adjusted to the appropriate pH (as explained in the “Emulsion preparation” section) and filtered through a 0·22 μm filter (Fisher Scientific, Mississauga, ON, Canada) before sample addition. The experiments for the emulsion samples dispersed in water plus salts were performed at 2 different dilutions (1/3000 and 1/6000), with gentle inversion of the cuvette for proper dispersion. Measurements were carried out at 23°C. Experiments were repeated at least in duplicate.
Diffusing Wave Spectroscopy (DWS) was used to investigate the size and stability behaviour of the lactoferrin emulsions and the recombined milk. DWS measures the properties of scattered light in suspensions where all photons have been multiple scattered. In transmission DWS, the laser light enters the sample and the scattered light is collected after it has traversed the whole length of the scattering cell. The diffusion coefficient of the particles, D, can be derived from the decay constant, τ, of the experimentally measured intensity autocorrelation function, as the two are related by the relation τ=(D q2)−1, where q is the scattering vector. Using the Stokes-Einstein relation (Weitz & Pine, Reference Weitz and Pine1993) the hydrodynamic radius, R, of the scatterers can be calculated since D is inversely proportional to R. In our experiments, the light source used was a 300 mW, 532 nm solid state diode pumped (Coherent, Santa Clara, CA, USA). Samples were placed into 5 mm glass cuvettes or 2 mm for the recombined milk experiments (Hellma Canada Limited, Concord, Canada) and kept at a temperature of 23°C by a circulating thermostatted water bath. Each run was carried out with a measurement length of 3 minutes at 1 s intervals. Data were analyzed using DataFit (Mediavention Inc., Guelph, Ontario, Canada) and Sigma Plot 10.0 (SPSS Inc., Chicago, USA). Experiments were performed at least in duplicate.
Sodium dodecyl sulphate polyacrylamide electrophoresis (SDS-PAGE) was used to determine the extent of protein adsorption at the oil droplet interface and any possible exchanges with the other proteins present in milk or in the solutions (Bio-Rad Laboratories Inc., Hercules, CA). The emulsions were separated from the serum by centrifugation at 16,000 g for 20 mins at 20°C (Eppendorf 5415D, Brinkmann Instruments Ltd., Mississauga, ON, Canada) and the cream layer was collected and spread onto Whatman filter paper and left at room temperature for 30 mins. The cream phase was resuspended in water to 10% oil. Each sample was diluted 1:2 in reducing sample buffer (containing 1 mol·l−1 Tris HCl, pH 6·8, 100 g·l−1 SDS, 750 ml/l glycerol, β-mercaptoethanol, 10 ml/l bromophenol blue) and heated for 5 min at 95°C. The resolving gel for the electrophoresis analysis contained 150 ml/l acrylamide in 1·5 mol·l−1 Tris HCl at pH 8·9, while the stacking gel was 40 ml/l acrylamide in 0·1 mol·l−1 Tris PO4 buffer at pH 6·7. The electrophoresis buffer was 30 gl−1 Tris HCl, 144 g·l−1 glycine, 10 g·l−1 SDS at pH 8·3. Aliquots of 7 μl of the prepared samples were loaded into the gels and the electrophoresis separation was performed at 200 V for 40 min. Gels were then stained with Coomassie blue in 500 ml/l methanol and 100 ml/l acetic acid for 30 min while shaking and de-stained with a solution of 450 ml/l methanol and 100 ml/l acetic acid for 1 h. Samples were left overnight in a fresh detaining solution diluted 1:1 in milliQ water, and scanned with a Sharp JX-330 scanner (Pharmacia Biotech).
Results and Discussion
In order to determine the optimum lactoferrin load needed to obtain a stable system, emulsions were prepared in water with different amounts of protein and the particle size distribution was then measured using integrated light scattering (results not shown). While size decreases were seen for lactoferrin concentrations below 1%, above 1% lactoferrin further protein addition did not have any effect on the average droplet diameter suggesting that this concentration was enough to cover the oil droplets and stabilize them effectively. From this point on, all results reported in this study will be with emulsions prepared with 1% lactoferrin.
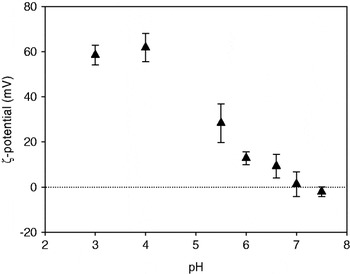
The overall ζ-potential of the lactoferrin emulsions as a function of pH (prepared at 1% lactoferrin and 20% soy oil) was measured after diluting the droplets in water adjusted to different pH values (see methods) (Fig. 1). At acidic pH (pH 3 and 4) the emulsion droplets were positively charged, as shown by the high ζ-potential values between +58 and +61 mV. As the pH increased, the ζ-potential showed a significant decrease, and at pH values of 7 and above (close to the isoelectric point of lactoferrin, pH 8·0 to 9·0), charges under 10 mV were measured on the oil droplets. This is in agreement with (McClements, Reference McClements and Clydesdale2005), who showed that the ζ-potential of a β-lactoglobulin-stabilized oil-in-water emulsion moves continually and monotonically from positive at low pH to negative at high pH, being zero at the isoelectric point of the protein. He further stated that the magnitude of the charge of the droplet is low around this point, making the system prone to destabilization. Our results, however, are in disagreement with previously reported values of ζ-potential of about +40 mV at pH 7·0 (Ye & Singh, Reference Ye and Singh2006). It is not clear, at this point, what is the origin of the discrepancy.
ζ-potential measurements of emulsions made with 20% soya oil and 1% lactoferrin. Emulsions were diluted in water adjusted to different pH values. Data are the average of at least duplicate experiments. Error bars indicate standard deviation.

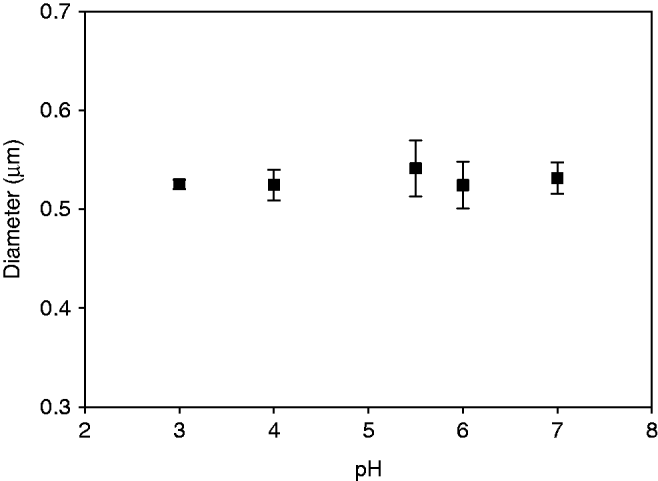
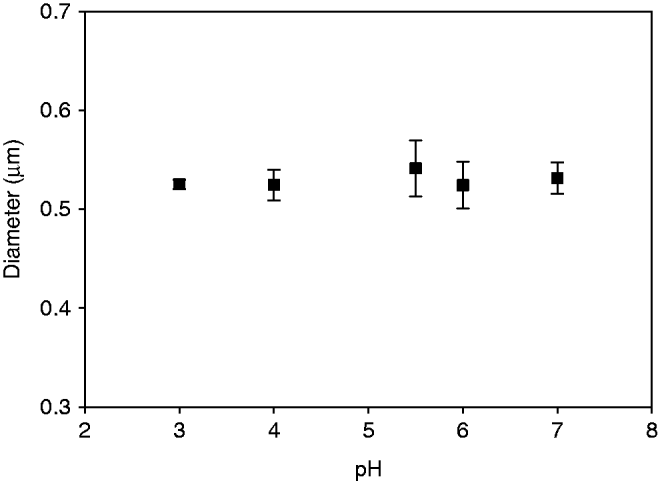
The average size of the emulsion droplets was then measured using integrated light scattering as a function of pH (Fig. 2). The average diameter of the emulsion droplets at pH 3·0 was around 530 nm and it did not change significantly in the range of pH between 3·0 and 6·7. This result was somewhat surprising considering the values of ζ-potential (Fig. 1), which clearly showed a substantial drop in electrostatic stabilization at pH values higher than 6. However, the nature of the measurement requires high dilution and shear, which can disrupt the presence of flocs in the sample.
Average particle size (d32) of emulsions made with 20% soya oil and 1% lactoferrin measured by integrated light scattering. Emulsions were diluted in water adjusted to different pH values. Data are the average of at least duplicate experiments. Error bars indicate standard deviation.
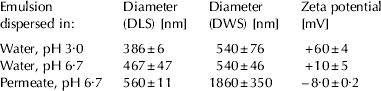
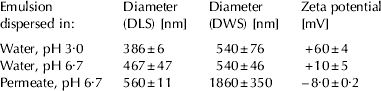
For this reason, further measurements were performed at two values of pH, 3·0 and 6·7, using DLS and DWS. In DLS, the emulsion droplets are under high dilution, but shear is not applied during the measurement, and in DWS measurements, little or no dilution is required. For DWS experiments, the final concentration of oil was 5% (v/v) and the samples were diluted in water which had been previously adjusted to either pH 3·0 or 6·7. Table 1 summarizes the results obtained for these experiments as well as ζ-potential measurements. There was some discrepancy in the values of particle size measured using DLS and DWS. This is in part due to the different weighting nature of the two light scattering measurements as well as possibly, at high electrostatic potentials, the assumption of free diffusivity might no longer be totally valid. Nevertheless, the two techniques show small, unflocculated particles at both pH 3·0 and 6·7. The ζ-potential values, on the other hand, dropped from +60 mV to around +10 mV (see also Fig. 1). This decrease in the absolute value of the charge is expected, as lactoferrin approaches a pH closer to that of its isoelectric point at pH between 8 and 9.
Average diameter and ζ-potential of the lactoferrin-stabilized emulsion droplets measured by DLS (high dilution) and DWS (5% v/v oil) and dispersed in different media. Values are average ± standard deviation
The size results, in conjunction with those shown in Fig. 1, suggest that a small charge of +10 mV (see Table 1) is enough to stabilize the emulsion droplets against aggregation. It might be possible to speculate, therefore, that electrostatic interaction might not be the only mechanism of stabilization present in this emulsion system.
A different size was measured when the droplets were tested in milk permeate. In fact, to better understand the behaviour of the lactoferrin-stabilized droplets in a milk environment, measurements of particle size were also carried out using milk serum as a dispersing agent (1:1 ratio). Table 1 also shows the apparent diameter and average charge of the droplets measured after dilution in milk serum (pH 6·7), as measured by DWS and DLS. When the lactoferrin stabilized droplets were dispersed in milk serum (milk permeate), the ζ-potential measured was (~−8mV), indicating an overall negative charge around the oil droplets. This can be explained by the presence of negatively charged salts in serum which neutralized the still positive pockets present on the adsorbed lactoferrin. Lactoferrin has both negative and positive regions on its surface and by neutralization of the positive pockets by the negative salts; a (small) overall negative charge can be obtained. However, it must be pointed out that measurements of the electric potential of the interfacial double layer of the oil droplets in high ionic strength medium are quite challenging, and the absolute values must be considered with caution.
As shown in Table 1, the changes in the droplet size also indicated overall instability of the oil droplets when dispersed in milk serum. The size of the droplets increased dramatically from those measured in water at the same pH, especially in the DWS measurements, as those were conducted without dilution. In addition, DLS showed a very wide distribution of sizes (data not shown) when compared with the sample in water at pH 3·0, most likely due to extensive flocculation of the oil droplets and the impact of the dilution during the measurement. The increased error values in the DWS measurements also demonstrated the increased instability of the system when dispersed in serum. DWS clearly showed that flocculation of the droplets occurred for the lactoferrin droplets in milk serum. It was therefore shown that the lactoferrin covered oil droplets behaved very differently in water and milk serum. To further test the origin of these differences, Mastersizer experiments were performed on lactoferrin emulsions dispersed in two different concentrations of NaCl and CaCl2 to test if ions may bind to lactoferrin and lead to bridging of the emulsion droplets. Since Mastersizer results are always under gentle shear (and thereby able, but highly unlikely, to break possible salt bridges), DLS experiments were also performed at two different dilutions. Table 2 shows the results of these experiments.
Average diameter of the lactoferrin-stabilized emulsion droplets measured by DLS (two dilutions) and Mastersizer and dispersed in different salts and ionic strengths. Values are average ± standard deviation

It is clear from these values that salt bridges do not occur between droplets in the presence of different concentrations of the mono and divalent salts, as there are no changes in the average hydrodynamic size of the droplets when varying the amount of salt, concentration and experimental method. It seems quite likely that the origin of instability is primarily due to differences in the ionic strength of the dispersing phase and the decrease in the overall electrostatic potential due to the screening presence of salts was responsible for particle flocculation.
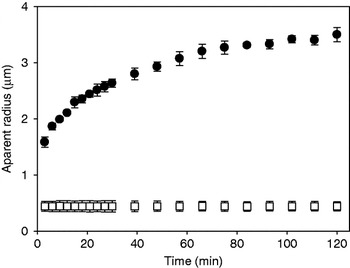
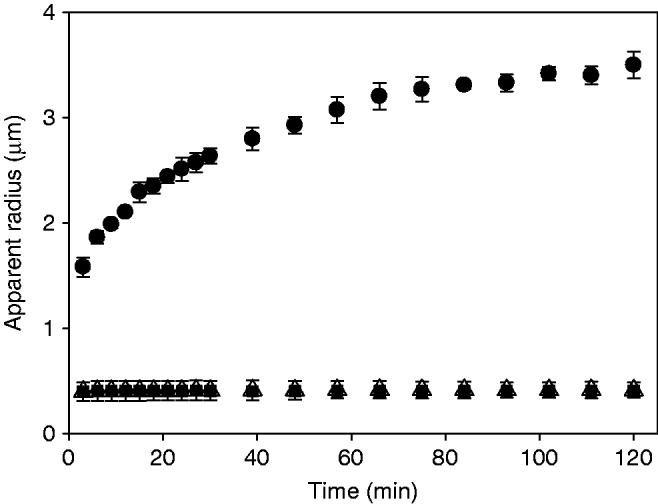
To better observe the stability of the oil droplets in the milk environment, DWS measurements were carried out over time. Emulsions containing 1% lactoferrin and 20% oil were prepared in water at pH 6·6 and then added to either recombined skim milk or milk permeate at 5% (v/v). Figure 3 shows the value of the apparent radius of the particles followed for 2 h after mixing. The lactoferrin emulsion mixed with milk (open squares) showed an initial radius of about 0·5 μm. The radius remained constant throughout the duration of the experiment. On the other hand, the lactoferrin emulsion mixed with serum (full circles) showed an increase in size for approximately 100 mins until reaching a plateau at about 3·3 μm. This behaviour clearly suggested that while the droplets in permeate were not stable and flocculated with time, the emulsions droplets were indeed stable in milk. The presence of salts in the permeate induced aggregation of the emulsion droplets due to the screening of the charges on the surface, as previously shown for other emulsion systems (Wahlgren et al. Reference Wahlgren, Arnebrant and Paulsson1993). On the other hand, the emulsion droplets were stable to flocculation when diluted in milk, despite the fact that the ionic environmental conditions were the same in both dispersion media. The reason for this difference in behaviour must lie in the soluble whey proteins which are present in milk but have been removed from the permeate.
Apparent radius as a function of time for lactoferrin emulsions (20% oil and 1% lactoferrin) diluted with recombined milk (□) or permeate (•) to a final 5% (v/v) oil concentration. Measurements carried out with DWS. Data represent average values of at least 2 runs, bars are standard deviations.

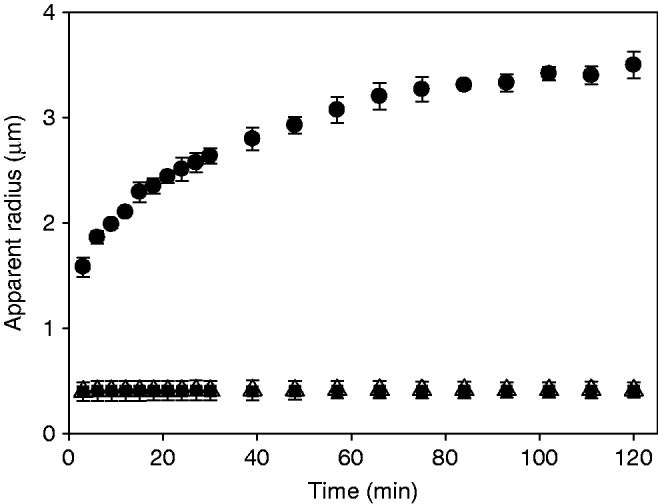
Previously published work (Ye & Singh, Reference Ye and Singh2007) reported that the addition of β-lactoglobulin to lactoferrin-covered emulsions reversed the charge of the droplets from positive to negative as the pH of the solution was increased. The change in charge was attributed to the electrosorption of β-lactoglobulin on the lactoferrin-covered interface. In order to elucidate the origin of the stabilizing effect observed when lactoferrin emulsions were added to reconstituted milk, β-lactoglobulin (β-lg) and sodium caseinate (NaCas) were dissolved in milk permeate (0·2 and 1·2% (w/w respectively) and lactoferrin emulsions (5% (w/w)) were suspended in the new medium. The hydrodynamic radius of the lactoferrin emulsions in the presence of sodium caseinate or β-lactoglobulin was stable over time (Fig. 4) in contrast to the sample in permeate alone. It was therefore hypothesized that adsorption of casein or β-lactoglobulin occurred at the interface, and that this adsorption resulted in improved stability of the emulsion in the high ionic strength environment of the milk serum.
Apparent radius as a function of time for lactoferrin emulsions (20% soy oil and 1% lactoferrin) diluted with permeate (•), sodium caseinate in permeate (▪) and β-lactoglobulin in permeate (▵) to a final 5% (v/v) of oil. Measurements carried out with DWS. Data represent average values of at least 2 runs and bars represent standard deviations.
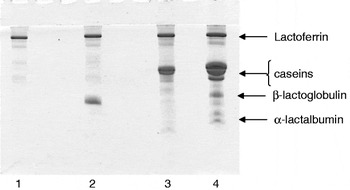
In order to test this hypothesis, the composition of the cream phase of the emulsions was analyzed by SDS-PAGE (Fig. 5). By observing the polypeptide compositions of the cream phases of the lactoferrin emulsions (lane 1) after dilution with permeate or with permeate with β-lactoglobulin or sodium caseinate (lanes 2 and 3 respectively) or with milk (lane 4) it was indeed possible to show that exchanges occurred at the oil-water interface. The lactoferrin band was present in all four samples suggesting that lactoferrin was not displaced from the interface and, furthermore, the proteins present in the serum or in milk were recovered on the oil/water interface. These results are in agreement with previous findings (Ye & Singh, Reference Ye and Singh2006) for emulsions prepared and dispersed in water.
SDS-PAGE of the cream phases isolated from emulsion droplets mixed with permeate (lane 1), permeate and β-lactoglobulin (lane 2), permeate and sodium caseinate (lane 3), and skim milk (lane 4).

Table 3 summarizes the values of ζ-potential for emulsions dispersed in permeate, and in permeate with β-lactoglobulin or sodium caseinate. In the presence of β-lactoglobulin or sodium caseinate, the droplets became slightly more negative (~−10·85 and ~−13·3 mV respectively) in comparison to the ones in permeate alone (~−7·8 mV). The fact that the ζ-potential did not vary significantly from the control, even though their stability changed dramatically (Fig. 4), implies that electrostatic repulsion was not the only driving force in the stabilization of lactoferrin emulsions in milk. Cooperative adsorption between β-lactoglobulin and lactoferrin has been reported before on silica surfaces (Wahlgren et al. Reference Wahlgren, Arnebrant and Paulsson1993), and the interaction between the two proteins was assumed to be electrostatic in nature. It is important to note that ζ-potential is an average measurement of the particle surface charge and it is possible that a charged portion of the lactoferrin molecules would be interacting electrostatically with β-lactoglobulin. Ye & Singh (Reference Ye and Singh2007) observed stability of the emulsions containing lactoferrin and β-lactoglobulin at pH 7·0, even though the particles presented very low charge. This would support a mechanism of stabilization of these emulsion droplets by steric repulsion. Very similar behaviour was also observed in the case of sodium caseinate, and this can also be attributed to steric stabilization.
ζ-potential values of lactoferrin emulsions measured after dilution in water, permeate, β-lactoglobulin in permeate, and sodium caseinate in permeate. Values are average ± standard deviation

Conclusions
Lactoferrin adsorbs onto the oil water interface and, at enough protein concentration, it is possible to obtain cationic droplets. At pH close to neutral, the charge is not sufficient to stabilize the emulsions from flocculation, especially under ionic strength conditions such as those present in milk serum. However, when other soluble proteins are present in solution, such as β-lactoglobulin or caseins, electrostatic interactions occur and multilayers form without displacement of lactoferrin from the interface, accounting for the stabilization of the emulsion droplets when lactoferrin emulsions are added to milk.
The authors would like to thank Biopole S.A., Switzerland, for providing the lactoferrin isolate. This project was funded by the Ontario Dairy Council-Natural Sciences and Engineering Research Council of Canada Industrial Research Chair program.