Introduction
Environmental factors during early life play a crucial role in shaping brain development, exerting both positive and negative effects. Reference Smith and Pollak1,Reference McEwen2 Unhealthy diets and adverse early life experiences have been shown to increase the risk of developing a range of metabolic, non-communicable, and neuropsychological disorders. Reference Danese, Moffitt and Harrington3 In recent decades, these risks have been exacerbated by shifts in the food industry, particularly the growing prevalence of added sugars and high-fructose corn syrup in the Western diet. Reference Bray and Popkin4,Reference Wolf, Bray and Popkin5 High levels of fructose intake have been linked not only to obesity, diabetes, and metabolic syndrome, but also to mental health conditions such as depression and anxiety in adulthood. Reference Hyldgaard Andersen, Black and Grassi-Oliveira6 Importantly, adolescents are among the highest consumers of sugar-sweetened beverages (SSBs), especially soft drinks, with a disproportionately high intake observed in low-income populations. Reference Park, Lin and Peng7 These beverages represent a major source of added sugars and are associated with poor dietary quality, excessive caloric intake, and increased metabolic risk. Simultaneously, dietary habits during adolescence are increasingly recognized as modulators of neurobehavioral and metabolic outcomes. Fructose consumption, a common component of modern diets, is linked to metabolic dysregulation, including insulin resistance and obesity, and may also influence emotional behavior. Reference Gueye, Vendruscolo and de Ávila8,Reference Khalid, Williams and Reynolds9
Modern lifestyles and ongoing social challenges have contributed to an increase in the number of adverse childhood experiences, including child abuse, neglect, poverty, and exposure to violence, collectively referred to as early life stress (ELS). These experiences refer to “some of the most intensive and frequently occurring sources of chronic stress that children may suffer early in life”. 10 ELS programs the hypothalamic- pituitary- adrenal (HPA) axis Reference Heim, Newport and Mletzko11 and has been consistently associated with an elevated risk of developing depression, anxiety, chronic inflammation, cardiovascular disease, and diabetes in adulthood. Reference Pervanidou and Chrousos12–Reference Kesebir14
In low and middle-income countries such as Mexico, poverty-related ELS is highly prevalent, particularly in communities where access to health care and nutritious food is limited. Reference Bleich, Vine and Wolfson15 These same communities often exhibit disproportionately high consumption of SSBs, including soft drinks. In 2011, Mexico had the highest per-capita soft drink consumption in the world, estimated at 163 liters per person per year. Reference Balcazar and Lizaur16 Currently, SSBs account for approximately 9.8% of total daily caloric intake and represent 70.3% of the total added sugar consumed by both children and adults. Reference Barrientos-Gutierrez, Zepeda-Tello and Rodrigues17 This combination of early adversity and chronic exposure to high-sugar diets may synergistically contribute to metabolic and emotional vulnerability throughout the lifespan.
The “double-hit” hypothesis presumes that cumulative exposure to adverse events across distinct developmental stages exacerbates the risk for psychopathology and metabolic disorders, thus suggesting that ELS could interact with further metabolic challenges to reduce adaptation. Reference Schmidt18 Maternal separation (MS180) is a widely validated rodent model of ELS, that has been shown to increase emotionality Reference Lee, Kim and Jahng19 and impair glucose tolerance in adulthood. Reference Lajud, Roque and Cajero20 Also, MS180 increases metabolic vulnerability when combined with a psychological stressor during postweaning development. Reference Ryu, Yoo and Kang21 Moreover, MS180 alters hypothalamic-pituitary-adrenal (HPA) axis function and glucocorticoid signaling, Reference Vargas, Junco and Gomez22 which may interact with metabolic disturbances to amplify behavioral deficits. Reference Lajud, Roque and Cheng23 Conversely, high-fructose diet during periadolescent development, but not in adults, increased depressive-like behavior and elevated basal corticosterone (CORT) concentrations. Reference Harrell, Burgado and Kelly38 Fructose consumption during the periadolescent period could exacerbate stress-related neuroinflammation or dysregulate brain regions implicated in emotional processing, such as the hippocampus and prefrontal cortex. Reference Harrell, Burgado and Kelly38,Reference Harrell, Zainaldin and McFarlane24 However, despite these shared mechanisms, few studies have evaluated how ELS, and adolescent dietary insults jointly shape adult outcomes.
Experimental studies that combine hypercaloric diets and ELS have yielded conflicting results. Reference Arcego, Toniazzo and Krolow25,Reference Maniam, Antoniadis and Wang26 For instance, ELS in mice either in the form of limited bedding, Reference Yam, Naninck and Abbink27 or maternal separation Reference Foright, McQuillan and Frick28 increased adiposity when combined with a Western diet, while it has also been reported that MS180 in Wistar rats decreased fat pad mass after exposure to a high-fat-sucrose diet. Reference Paternain, Martisova and Milagro29 Moreover, a palatable high-fat diet reduced depressive-like behavior but exacerbated hyperinsulinemia in MS180 rats. Reference Maniam and Morris30,Reference Maniam and Morris31 Notably, these studies have primarily focused on high-fat, high-sugar diets, without specifically examining the effects of fructose, an important component of industrialized food. Given that fructose has distinct metabolic pathways and has been implicated in the development of metabolic disturbances beyond those observed with general hypercaloric diets, Reference Geidl-Flueck and Gerber32 the potential interaction between ELS and fructose exposure remains to be elucidated. Therefore, this study aimed to investigate the combined effects of ELS and mild fructose exposure during the periadolescent period using a well-established model Reference Miranda, Schönholzer and Klöppel33,Reference Mamikutty, Thent and Sapri34 on emotionality and glucose homeostasis in adulthood.
Materials and methods
Animals
Twelve timed-pregnant female Sprague–Dawley rats were obtained from the Neurobiology Institute of the National Autonomous University of Mexico at embryonic day 14 and allowed to habituate to our facility for one week before delivery. Animals were maintained in temperature-controlled rooms under a 12-h light/dark cycle with ad libitum access to food and water. The day of birth was designated as postnatal day (P) 0. On P1, litters were cross-fostered and culled to eight pups (5–6 males). Pups were weaned at P21 and group-housed (two to three siblings per cage) until adulthood. Half of the animals from each group were assigned to standard rearing conditions (STD) or mild fructose diet for 10 weeks. On P90, animals were tested in the forced swimming test. On P92, they were implanted with a jugular vein catheter. Rats recovered for one week before assessment of fasting glucose, glucose tolerance, and baseline CORT levels.
Only males were used for this study. Each experimental group consisted of pups from 4–5 different dams. Behavioral tests were performed before 13:00 h to avoid the effects of circadian variation. All procedures were approved by the National Research Committee of the Mexican Social Security System (R-2016-785-066). All experiments were carried out in accordance with the Institute of Laboratory Animal Resources Guide for the Care and Use of Laboratory Animals (National Research Council, revised 1996) and the official regulations for use and care of laboratory animals of Mexico (NOM-062-ZOO-1999). Every effort was made to reduce the number of rats used and to minimize suffering.
Maternal separation
MS180 was performed as previously described. Reference Lajud, Roque and Cheng23,Reference Roque, Ruiz-González and Pineda-López35–Reference Diaz-Chávez, Lajud and Roque37 Briefly, on P1, MS180 entire litters were separated from their dam, transferred to a room separated from the colony and placed in a box filled with clean sawdust over a heating pad with controlled temperature (30°C–32°C) for 3 h and then returned to the dam. This procedure was repeated every day at the same time (09:00–12:00) until P14. The CONT group remained undisturbed except for routine cage cleaning.
Mild fructose diet
At P21, animals were weaned and pair-housed in Plexiglass cages (26 × 47.6 × 20.3 cm) with ad libitum food and water. Half of the animals from each litter were assigned to standard rearing conditions (STD) with free access to food (5001 Purina, Lab Diet, St Louis, MO, USA) and water. The other half received a choice of two bottles: one containing water and one containing 10% fructose solution (Sigma-Aldrich) for 10 weeks. The volume of fructose solution consumed per cage was measured weekly, and intake was estimated by calculating the difference between the initial and remaining volume.
Body weight gain and food intake measurements
Body weight gain and food consumption were evaluated weakly. Group-housed animals were provided with 500–900 g of standard chow (5001 Purina, Lab Diet, St Louis, MO, USA) at the beginning of each week starting at weaning. Chow remanent was weighted the following week and registered. Animals were monitored daily, and additional weighted amounts of chow (100 g) were added if necessary. Chow supplies were adjusted as animals grew and gained weight. Caloric efficiency was estimated as previously described. Reference Harrell, Burgado and Kelly38 The body mass gained per week per animal was divided by the caloric intake calculated per cage and adjusted by the number of animals in each cage (2–3). With this approximation, higher caloric efficiency is typically associated with a greater risk of obesity, as the body stores more energy per kilocalorie consumed. Chow and fructose caloric intake was estimated by calculating total week caloric content consumption (g) from chow (3.36 Kcal/ g consumed) or fructose (0.4 Kcal/ ml consumed) and divided by each animal’s weight. Animals were group housed to avoid confounding effects of social isolation rearing.
Forced swimming test (FST)
At P90 innate emotionality (n = 10) was evaluated in the forced swimming test (FST) as previously described. Reference Roque, Ruiz-González and Pineda-López35,Reference Ruiz, Roque and Pineda36,Reference Lajud, Roque and Cajero20,Reference Vargas, Junco and Gomez22 Briefly, adult rats were placed into a Plexiglas cylinder (35 × 50 cm) filled with water at 21°C for 10 min. We used a single 10-minute session to evaluate innate acute stress-coping strategies. This approach avoids the confounding effects of habituation and learning that occur during the pre-exposure session. Reference De Kloet and Molendijk39 Behavior was recorded with a webcam. Struggling behavior consisted of upward-directed movement of the forepaws. Swimming behavior consisted of horizontal movement throughout the tank. Immobility was defined as the animal floating without struggling and only making movements necessary to maintain its head above water. The data were collected by an experimenter blinded to the conditions and analyzed with the software EVENTLOG (version 1.0 October 1986, R Henderson).
Open field test (OFT)
Locomotor activity was evaluated in an open field arena (100 × 100 × 40 cm) for 10 min. Time spent in the center and crossings were collected by an experimenter blinded to the conditions and analyzed with the software EVENTLOG. The total number of line crossings was recorded as an index of locomotion activity. This measure, performed in a subset of animals, was included to control for potential confounding effects of motor performance on forced-swim behavior.
Jugular vein catheterization and blood sampling
All procedures and samplings were in concordance with the recommendations of the “Metabolic Phenotyping Guidelines for Assessing Glucose Homeostasis in Rodent Models”. Reference Bowe, Franklin and Hauge-Evans40 On P92 a subset of animals (n = 8) was implanted with a 13- cm Silastic®/polyethylene (Dow Corning Corporation, MI, USA) catheter under ketamine (80 mg/kg)xylazine (6 mg/kg) anesthesia, as previously described. Reference Lajud, Roque and Cajero20,Reference Neumann, Johnstone and Hatzinger41 After surgery, the rats were individually housed in Plexiglas® cages and left to recover for one week. During this time, animals were handled daily to avoid any effects of manipulation. Fructose diet was maintained during the recovery period.
Following recovery, we evaluated fasting glucose and performed a glucose tolerance test (GTT). Fructose bottles were removed; rats were fasted overnight and then subjected to the intravenous GTT. For blood sampling, the catheter was attached to an extension tube (polyethylene; outside diameter, 1.0 mm) connected to a syringe filled with sterile heparinized saline (20 IU/mL) at 09:00 h, and the rats were left to stabilize for 60 min. Blood samples (0.05 mL) were withdrawn and immediately replaced with sterile 0.9% saline. For the GTT, fasting samples were collected, and animals were infused intravenously with 1 g/kg glucose (50%, DX-50; Pisa, Guadalajara, Mexico). Further samples were collected at 30, 60, and 120 min after glucose administration. Glucose concentration was measured immediately using an Accu-Chek glucose meter (Roche Diagnostics, Edo. Mexico, Mexico). After the last collection, the catheter was closed, fructose bottles were replaced, and animals were refed.
The following day, animals were reattached to the extension tube, and blood samples (0.2 mL) were collected after 120 min of stabilization. All blood samples were collected in tubes containing EDTA (5% solution, 5 µL per 200 µL blood) supplemented with aprotinin (0.039 trypsin inhibitor units per tube; Sigma, St Louis, MO, USA) and then centrifuged at 4000 r.p.m. at 4°C. Plasma was stored at −70°C until processing. Free CORT was measured using a kit from Enzo Life Sciences (Farmingdale, NY, USA; sensitivity, 26.99 pg/mL; Cat. No: ADI-900-097) and processed according to the manufacturer’s protocol for small volumes of plasma samples to ensure all samples fell within the assay detection range (0.032–20 ng/mL). Briefly, 10 µL of each sample were pretreated with 10 µL of 1:100 steroid displacement reagent (SDR) solution (prepared immediately before use) for five min and further diluted in 380 µL of assay buffer to a final dilution of 1:40.
Data analysis
Normality was assessed using the Shapiro-Wilk test. Data that were normally distributed are expressed as mean ± standard error of the mean (SEM), while those that failed the normality test are presented as median with the interquartile (IQ) range. Statistical significance was set at p ≤ 0.05. For variables that did not meet parametric assumptions, including CORT levels and immobility time in the forced-swim test, group comparisons were performed using Kruskal–Wallis tests followed by Dunn’s multiple comparisons. Parametric data, such as body weight, caloric intake, and glucose tolerance measurements, were analyzed using repeated-measures or two-way ANOVA. Post hoc group differences were evaluated using Tukey’s test. Data visualization and statistical analyses were performed using GraphPad Prism 9.00 and RStudio (Version 2025.05.0 + 496) with the ggplot2 package. All analyses were conducted by experimenters blinded to experimental group assignments.
Results
Early life stress increases body weight independently of fructose diet
Water, fructose solution, and food intake per cage were monitored weekly. A three-way ANOVA revealed that fructose treatment significantly reduced both water (F[1, 29.3], p = 0.0001; Supplementary Fig. 1A) and food intake (F[1, 33.1], p < 0.0001; Supplementary Fig. 1B), whereas ELS had no significant effect on either parameter (p > 0.05). No differences were detected in fructose volume consumed among groups (Supplementary Fig. 1C), nor in the fructose-to-water intake ratio (preference; Supplementary Fig. 1C, p > 0.05).
When evaluating initial body weight at weaning statistical analysis revealed that MS180 rats were significantly heavier than controls (CONT: 63.9 ± 2.5 g; MS180: 78.7 ± 2.5g; p = 0.001). A three-way repeated-measures ANOVA for body weight (Fig. 1b) showed significant main effects of age (F[2.7, 98.75] = 2671, p < 0.0001), fructose diet (F[1, 19.3], p < 0.0001), and ELS (F = 7.1, p = 0.011). Significant interactions were also observed between time and fructose diet (F = 5.1, p < 0.0001), fructose diet and ELS (F = 8.1, p = 0.007), and the three-way interaction of time, fructose diet, and ELS (F = 3.5, p = 0.0002). Tukey’s post hoc tests indicated that both MS180 groups exhibited significantly higher body weight compared to CONT + STD starting at P21 (Fig. 1b), while CONT + fructose animals showed a significant increase only after five weeks of dietary exposure (P56). No significant differences were found between CONT + STD, MS180 + STD and MS180 + Fructose groups (p > 0.05). Furthermore, a two-way ANOVA analyzing the area under the body weight curve (Fig. 1b) revealed significant effects of ELS (F[1, 7.1], p = 0.011), fructose diet (F[1, 18.4], p = 0.0001), and their interaction (F = 8.4, p = 0.006). Multiple comparisons showed that all experimental groups differed significantly from CONT + STD (p < 0.01).
Early life stress and fructose diet differentially affect body weight during periadolescent development. (a) schematic representation of the experimental groups and timeline of interventions. Control (CONT) and maternally separated (MS180) male rats were weaned at postnatal (P) day 21 and randomly assigned to receive either a choice of two bottles containing water or 10% fructose solution for 10 weeks or reared under standard animal facility conditions (STD). (b) Body weight and (d) gain were monitored weekly (Mean ± SEM, three-way repeated-measures ANOVA *p < 0.05 and **p < 0.01 vs CONT + STD; n = 10). (b) At the end of the dietary interventions the area under the body weight curve and (e) total weight gain were estimated (Mean ± SEM, two-way ANOVA *p < 0.05 and **p < 0.01 vs CONT + STD; n = 10). Gray bar represents the period of transition to adulthood.

Statistical analysis of weekly body mass gain (Fig. 1d) demonstrated significant main effects of age (F[3.3, 122.2] = 235.3, p < 0.0001) and ELS (F = 8.7, p = 0.005), but not of fructose diet (p > 0.05). Significant interactions were found between time and fructose diet (F = 4.8, p < 0.0001), time and stress (F [9, 3.4], p < 0.001), as well as time, ELS, and fructose diet (F = 4.1, p < 0.0001). However, analysis of total body weight gain from weaning to the end of treatment (Fig. 1e) only revealed a significant effect of fructose (F[1, 10.7], p = 0.002), but no effect of ELS or their interaction. Post hoc comparisons indicated that both fructose-fed groups exhibited increased total weight gain relative to CONT + STD after 12 weeks of monitoring (p < 0.05). Overall, the data showed that ELS increased body weight starting from weaning onward, regardless of the fructose diet; however, only HFD-fed animals exhibited greater total body weight gain, suggesting that the effects of ELS emerge early in development and persist throughout life.
Effects of fructose diet on caloric efficiency and intake
Caloric efficiency (Fig. 2a), estimated as the ratio between weekly body mass gained and caloric intake, was evaluated as a measure of metabolic imbalance. A three-way ANOVA indicated significant main effects of age (F[3.2, 116.6] = 57.0, p < 0.0001) and fructose diet (F[1, 33.2], p < 0.0001), as well as a significant age × fructose interaction (F = 7.5, p < 0.0001). Tukey’s main treatment post hoc tests revealed that both fructose-fed groups exhibited higher caloric efficiency than the STD groups (p < 0.05). However, simple effect Tukey’s post hoc test within weeks showed that only MS180 + Fructose rats had a significant increase in caloric efficiency during the first weeks of diet exposure (p < 0.05). A two-way ANOVA for the area under the caloric efficiency curve (Fig. 2b) demonstrated a significant effect of fructose diet (F[1, 33.0], p < 0.0001), with multiple comparisons indicating that both fructose-fed groups had an increased area under the curve compared to the STD groups (p < 0.05).
Effects of early life stress and fructose diet on energy metabolism. Control (CONT) and maternally separated (MS180) male rats were weaned at postnatal (P) day 21 and randomly assigned to receive either a choice of two bottles containing water or 10% fructose solution for 10 weeks or reared under standard animal facility conditions (STD). (a) Caloric efficiency and (c) caloric intake were monitored weekly (Mean ± SEM, three-way repeated-measures ANOVA *p < 0.05 and **p < 0.01 vs CONT + STD, ## p < 0.01 vs MS180 + STD, $ p < 0.05 and $$ p < 0.01 vs CONT + fructose; n = 10). (b) At the end of the dietary interventions the area under the caloric efficiency and (d) caloric intake curves were estimated (Mean ± SEM, two-way ANOVA *p < 0.05 and **p < 0.01 vs CONT + STD, ## p < 0.01 and ### p < 0.001 vs MS180 + STD; n = 10). Gray bar represents the period of transition to adulthood.

Total caloric intake (Fig. 2c) was estimated as the product of weekly chow + fructose caloric content, normalized to body weight. A significant main effect of age (F[2.8, 102.5] = 4.2, p = 0.008) and diet (F[40.1], p < 0.0001) was detected. Additionally, statistical analysis revealed significant interactions between age and fructose diet (F[37.3], p < 0.0001) and between age and ELS (F[9, 2.4], p = 0.012). Post hoc Tukey’s tests showed that, from week 5 onward, animals in the MS180 + Fructose group ingested significantly more calories than those in the STD groups (p < 0.01), while this difference was observed in CONT + Fructose animals starting from week six (p < 0.01). Moreover, MS180 + fructose rats consumed more calories than CONT + Fructose rats during weeks 6, 7, and 9 (p < 0.05). A two-way ANOVA for the area under the caloric intake curve (Fig. 2d) revealed a significant effect of fructose diet (F[1, 42.9], p < 0.0001), but no effect of stress or interaction (p > 0.05). Tukey’s post hoc tests indicated that CONT + Fructose rats ingested significantly more energy compared to CONT + STD (p < 0.01), while MS180 + Fructose caloric intake was significantly higher than both CONT + STD and MS180 + STD groups (p < 0.01). In summary, both fructose-fed groups exhibited higher caloric efficiency during the first five weeks, after which this parameter no longer differed significantly; while caloric intake began to increase from week five onward in both fructose groups, with MS180 + Fructose rats showing the highest intake.
Mild fructose diet during periadolescent development increases innate emotionality in the forced swimming test
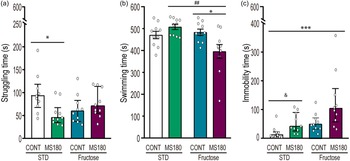
To assess emotionality, the forced-swim test was performed on P90. A Kruskal–Wallis H test for struggling time (Fig. 3a) revealed a significant difference in medians among the groups (H = 8.30, p = 0.040). Dunn’s multiple comparisons test showed that MS180 + STD animals exhibited reduced struggling time compared to CONT + STD (p < 0.05).
Periadolescent mild fructose diet increases emotionality in ELS rats. Control (CONT) and maternally separated (MS180) male rats were weaned at postnatal (P) day 21 and randomly assigned to receive either a choice of two bottles containing water or 10% fructose solution for 10 weeks or reared under standard animal facility conditions (STD). Rats were tested on the forced swimming test on P90. (a) Struggling time (Kruskal–Wallis test *p < 0.05 vs CONT + STD; n = 10), (b) swimming (Two-way ANOVA *p < 0.05 vs CONT + STD and ## p < 0.01 vs MS180 + STD, n = 10), and (c) immobility time (Kruskal–Wallis test *p < 0.05 vs CONT + STD). Previously reported differences in immobility time between CONT and MS180 STD rats were only observed when performing simple comparisons (U Mann–Whitney & p < 0.05; n = 10).

A two-way ANOVA for swimming time (Fig. 3b) indicated a significant effect of diet (F = 6.0, p = 0.018) and a significant interaction between ELS and diet (F = 9.0, p = 0.003). Tukey’s post hoc test revealed that MS180 + Fructose rats spent significantly less time swimming compared to both MS180 + STD (p < 0.05) and CONT + fructose (p < 0.01) groups.
Immobility time also differed significantly between groups (H = 18.6, p = 0.0003). Dunn’s post hoc test indicated that only MS180 + Fructose animals exhibited significantly higher immobility compared to CONT + STD (p < 0.0001), with no other significant group differences. Previously reported differences between CONT and MS180 rats reared under STD conditions were only observed when performing simple comparisons (p < 0.05). No significant effects of ELS or diet were found on the number or crossings to the center(CONT + STD: 19.92 ± 6.67; CONT + Fructose: 7.000 ± 1.472; MS180 + STD: 24.12 ± 4.11; MS180 + Fructose: 8.800 ± 2.49) or general locomotor activity in the open field test (CONT + STD: 71.08 ± 13.59; CONT + Fructose: 103.3 ± 8.731; MS180 + STD: 89.12 ± 13.31; MS180 + Fructose: 95.00 ± 17.70). Two-way ANOVA revealed no significant main effects of stress, diet, or significant interaction (p > 0.05).
In summary, only MS180 + STD rats exhibited a significant decrease in struggling time, whereas MS180 + Fructose rats showed reduced swimming and increased immobility time, without changes in locomotion.
ELS and fructose diet differentially affected glucose homeostasis
Fasting glucose was measured in venous blood collected via the jugular catheter. Data from one CONT + HFD rat was incomplete due to a clogged catheter. Our results indicated that, in CONT + STD group, only two (25%) rats showed altered fasting glucose levels (>100 mg/dL) and in MS180 + STD this alteration was observed in only one (12.5%), while in the CONT + Fructose group four (50%) rats presented fasting glucose values higher than 100 mg/dL. This proportion was increased in MS180 + Fructose animals, where six (75%) rats presented altered fasting glucose levels. Fisher’s exact test indicated that there was no significant difference in the proportions of rats with altered glucose levels between the groups (p = 0.073). However, the linear-by-linear association test was significant, ( χ2[1[ = 5.6], p = 0.017), suggesting a linear trend in the proportions of rats with altered fasting glucose levels based on the combination of ELS and diet.
In the intravenous glucose tolerance test (IVGTT, Fig. 4a), a three-way ANOVA demonstrated significant effects of time post-glucose administration (F[2.2, 59.2] = 24.6, p < 0.0001) and ELS (F = 15.9, p = 0.0005), with no significant effects of diet or interactions (p > 0.05). Tukey’s main treatment effect analysis revealed significant differences between MS180 + STD and MS180 + Fructose groups compared to CONT + STD (p < 0.01).
Fructose diet does not increase the effects of early life stress on the glucose tolerance test. Control (CONT) and maternally separated (MS180) male rats were weaned at postnatal (P) day 21 and randomly assigned to receive either a choice of two bottles containing water or 10% fructose solution for 10 weeks or reared under standard animal facility conditions (STD). On P92 rats were implanted with a jugular vein catheter and allowed to recover for one week. (a) Venous glucose levels were evaluated after an overnight fasting and 30, 60 and 120 minutes after the administration of glucose (i.p. 50mg/kg; mean ± SEM, three-way repeated-measures ANOVA *p < 0.05 vs CONT + STD; a p < 0.05 and aa p < 0.01 vs fasting levels; n = 7–8). (b) The area under the glucose tolerance test was estimated at the end of the 120 minutes (Mean ± SEM, two-way ANOVA *p < 0.05 vs CONT + STD, n = 7–8).

Within-group analysis revealed that in CONT + STD and CONT + Fructose rats, venous glucose was significantly elevated 30 min after glucose administration (p < 0.05), but not at 60 or 120 min (p > 0.05), relative to fasting. MS180 + STD animals exhibited increased glucose at both 30 and 120 minutes (p < 0.01), while MS180 + Fructose rats showed elevated levels at 30 and 60 minutes (p < 0.01) compared to fasting. Additionally, both MS180 + STD and MS180 + Fructose groups had significantly higher glucose at 30 minutes post-administration compared to CONT + STD (p < 0.01), and MS180 + STD levels remained elevated at 120 min compared to CONT + STD (p < 0.01).
A two-way ANOVA for the area under the glucose tolerance test curve (Fig. 4b) revealed a significant effect of ELS (F [1, 14.1], p = 0.001), but no significant effects of diet or interaction (p > 0.05). Post hoc tests indicated that both MS180 + STD and MS180 + Fructose groups exhibited increased AUC compared to CONT + STD (p < 0.01). In summary, ELS impaired glucose tolerance regardless of diet, while mild fructose intake increased the proportion of rats that showed altered fasting glucose.
Baseline corticosterone levels are not significantly altered by fructose diet
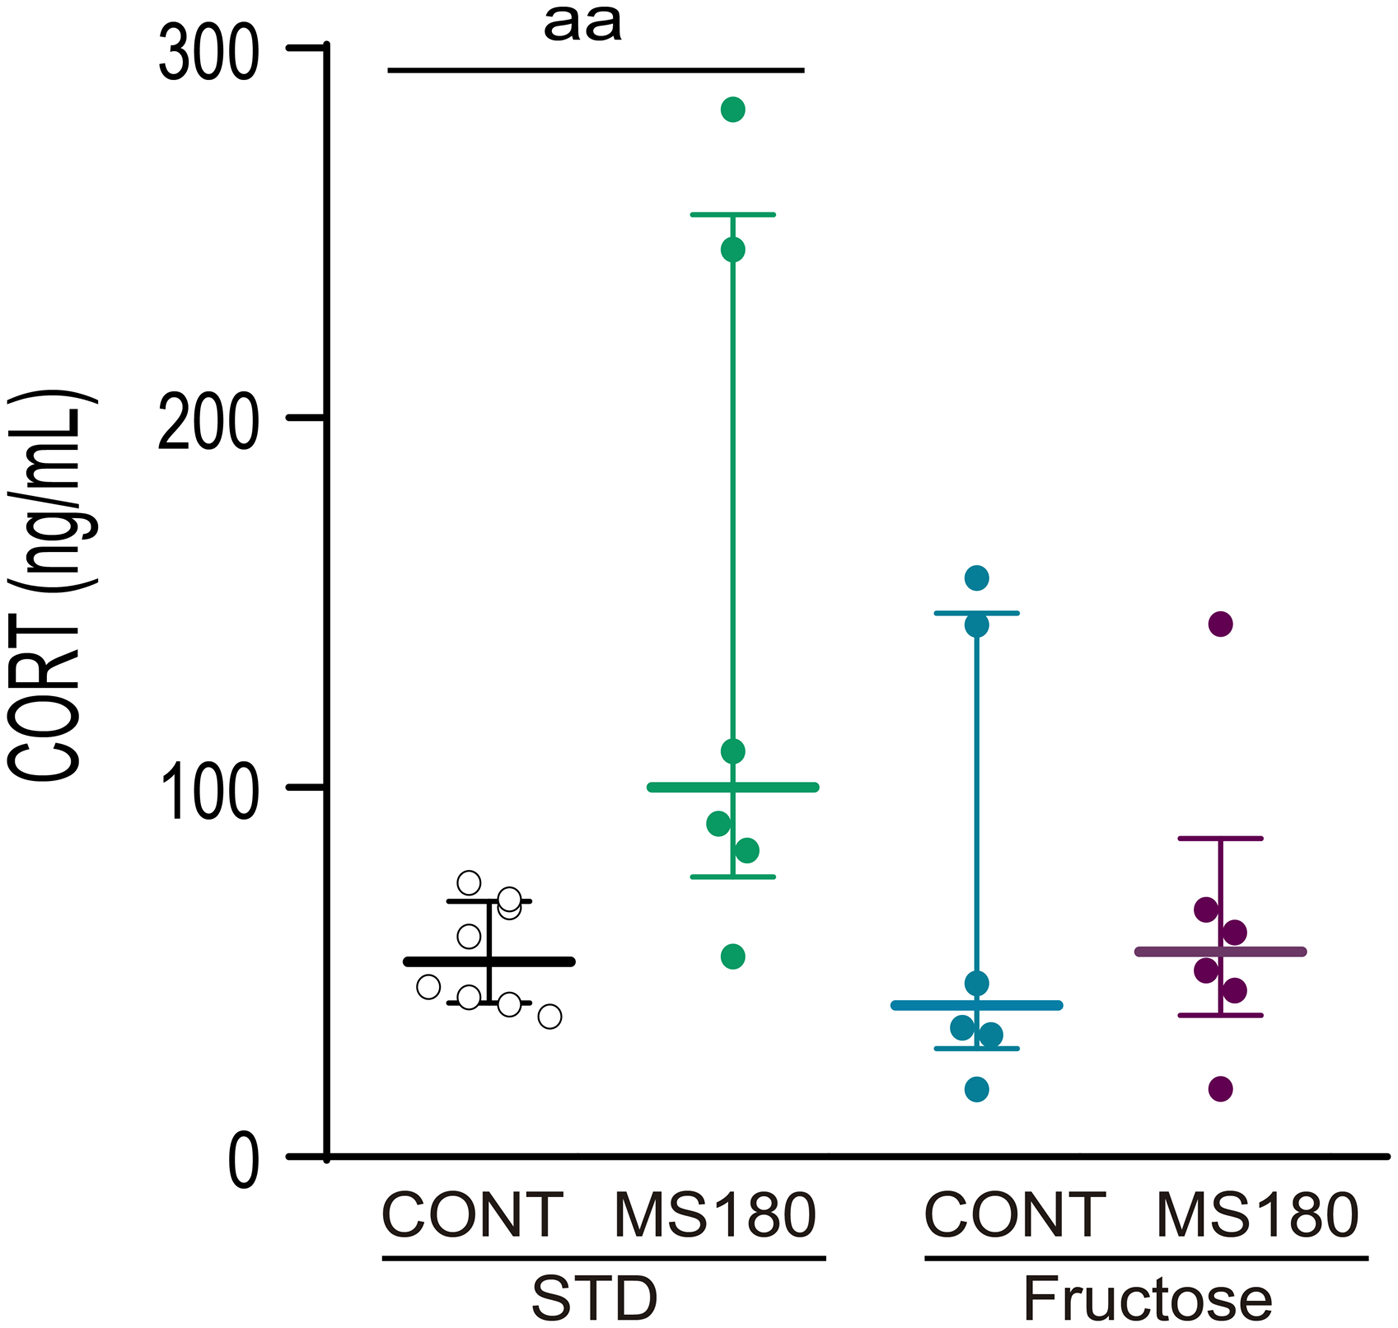
Baseline CORT levels were analyzed in blood samples collected through the catheter after 2 h of stabilization (Fig. 5). A Kruskal–Wallis test revealed no significant group effect (p > 0.05). Previously reported differences between CONT + STD and MS180 + STD were replicated only by performing a single Mann–Whitney test (p = 0.008).
Baseline corticosterone levels are not significantly affected by fructose diet. Control (CONT) and maternally separated (MS180) male rats were weaned at postnatal (P) day 21 and randomly assigned to receive either a choice of two bottles containing water or 10% fructose solution for 10 weeks or reared under standard animal facility conditions (STD). On P92 rats were implanted with a jugular vein catheter and allowed to recover for one week. Venous corticosterone (CORT) levels were evaluated on P100 (Mean ± SEM; n = 6–8). Previously reported differences in immobility time between CONT and MS180 STD rats were only observed when performing simple comparisons (U Mann–Whitney && p < 0.01; n = 6–8.

Discussion
While numerous studies have independently established the impact of ELS Reference LeMoult, Humphreys and Tracy42–Reference Ding, Gao and Wang44 and unhealthy dietary patterns on metabolism and behavior, Reference Barrett, Jiang and O’Flaherty45–Reference Cong, Tracy and Edmunds47 few have investigated how these factors combine across critical developmental windows. Reference Defina, Woofenden and Baltramonaityte48 In this study, we evaluated for the first time the effect of 10% fructose diet during the periadolescent period in maternally separated rats and demonstrated that even this mild metabolic challenge can exacerbate emotionality, while increasing the risk of impaired fasting glucose. Also, our data indicated that MS180 + Fructose rats exhibited increased metabolic imbalance and body weight gain, despite not showing elevated baseline CORT levels.
Fructose diet is an established model for inducing metabolic syndrome in rats. Reference Harrell, Burgado and Kelly38,Reference Harrell, Burgado and Kelly38 Consistent with previous reports, we observed that chronic fructose intake during periadolescence increased weight gain, caloric efficiency and altered fasting glucose. Reference Mazzoli, Gatto and Crescenzo49 Although we used a mild concentration (10%), this was sufficient to induce elevated fasting glucose and impair glucose tolerance, suggesting that even mild dietary fructose exposure during critical developmental windows can have metabolic consequences.
It has been suggested that MS180 induces hyperphagia, reduces sucrose preference and increases the preference for palatable diets. Reference Ryu, Lee and Yoo50,Reference Hill, Klug and Kiss Von Soly51 Therefore, initially, we aimed to analyze the effects of ELS using a more naturalistic approach, providing the animals with the choice of drinking water or fructose. However, contrary to our hypothesis, ELS did not affect water consumption nor decreased preference for fructose at any point.
Interestingly, we observed a time-dependent effect of ELS and fructose diet on energetic metabolism. Both MS180+ STD and MS180 + Fructose animals showed increased body weight starting from weaning and during the entire experiment, whereas CONT + Fructose animals only started showing increased weight after five weeks of exposure to diet. Also, fructose increased caloric efficiency without changing caloric intake in both CONT and MS180 rats during the first weeks. This effect was more robust on MS180 + Fructose animals were, unlike controls where we only observed a main group difference, significant differences between MS180 + Fructose and STD animals were observed at individual time points. Conversely, fructose increased caloric intake without changing efficiency after five weeks on the diet, and this effect was significantly higher in MS180 + Fructose rats. These findings suggest a developmental switch around postweaning weeks five to six, coinciding with the transition to early adulthood (P50–P65). Also, early increased efficiency in MS180 + Fructose animals may reflect enhanced energy conversion to body mass, explaining increased weight without intake. As animals mature, body weight appears more dependent on increased energy intake, while efficiency stabilizes. This dynamic likely represents early metabolic adaptations to combined stress and diet.
One of the limitations of the present study is that we did not directly measure adiposity or fat pad mass, which limits interpretation of body composition changes. However, prior studies have shown that MS180 alters adipocyte proliferation and β3-adrenergic receptor expression in adipose tissue, suggesting a long-term predisposition to altered lipid storage. Reference Miki, Liu and Ohta52 During periods of maladaptation, elevated glucocorticoid levels impair insulin signaling, increase adipose lipolysis, and promote hepatic lipogenesis, ultimately contributing to insulin resistance and dysregulated energy balance. Reference Maniam, Antoniadis and Morris53 Although body weight is not a direct proxy for adiposity, our results could suggest that the sustained body-weight increase observed in MS180 animals could be caused by glucocorticoid-driven metabolic alterations that favor energy storage. Interestingly, rats exposed to both stress and fructose displayed comparable body weight without elevated glucocorticoids, suggesting that fructose may either modify these pathways or that glucocorticoids are not the main drivers of body-weight changes under these conditions.
Human evidence indicates that individuals exposed to childhood adversity have significantly elevated odds of developing mood disorders, with ELS roughly doubling the risk for early-onset major depression, Reference LeMoult, Humphreys and Tracy42 and increasing the risk for adult obesity by approximately 1.3-fold. Reference Danese and Tan54 In animal models, ELS paradigms such as MS180 are known to induce passive coping strategies and anxiety-like behaviors, elevate baseline CORT levels, and cause mild metabolic imbalance. Reference Oldham Green, Maniam and Riese55–Reference Cui, Cao and Lin57 However, it is important to note that most studies reporting these effects have evaluated MS180 and control groups alone, without considering additional interacting factors. In the present study, although we observed significant effects of MS180 on body weight, struggling time, and glucose tolerance, previously reported effects on baseline CORT levels and immobility time were only detected through simple pairwise comparisons. In congruence, previous results from our group evaluated the effect of MS180 alone and observed statistically significant differences; however, these effects were diluted when MS180 was combined with postweaning isolation in a subsequent experiment. Reference Vargas, Junco and Gomez22 This reflects the increased complexity of multifactorial designs, where detecting differences requires more robust effects due to the added variability from multiple interacting factors.
In our study, we used a single 10-minute forced-swim session to evaluate innate acute stress-coping strategies. This approach avoids the confounding effects of habituation and learning that occur during the pre-exposure session, which are now suggested to represent an adaptive strategy rather than depressive-like behavior. Reference De Kloet and Molendijk39 The one-session variant has been widely applied to assess stress-coping responses in models of ELS and metabolic challenge. Reference Lajud, Roque and Cajero20,Reference Vargas, Junco and Gomez22,Reference Roque, Ruiz-González and Pineda-López35,Reference Torner, Plotsky and Neumann58 Here, only MS180 + Fructose animals showed a decrease in swimming and an increase in immobility (the most important parameter) in the test, while, as previously mentioned, the effects of ELS on immobility time were only confirmed through single comparisons. This indicates that a 10% fructose diet during the periadolescent period increases innate emotionality in MS180 rats. This aligns with some studies that suggest prolonged sucrose or high-fructose corn syrup (HFCS) supplementation alone does not always produce depressive-like behavior in the absence of other stressors. Reference Beecher, Alvarez Cooper and Wang59 High-sugar diets have been linked to reduced hippocampal BDNF levels, Reference Molteni, Barnard and Ying60 suggesting that fructose-induced metabolic stress can impair the brain. Clinical observations have reported that individuals with childhood adversities who adopt unhealthy lifestyles have more incidence of affective disorders and obesity in adolescence and adulthood. Reference Defina, Woofenden and Baltramonaityte48 Similarly, a recent study in mice found that combining a high-fat diet with chronic restraint stress had more severe depressive-like behaviors and memory deficits than either alone. Reference Ding, Gao and Wang44 Thus, adolescent fructose exposure represents a neuroendocrine stressor that, while moderately harmful on its own, becomes far more severe when combined with a programmed vulnerable phenotype in adulthood. Reference Danese, Pariante and Caspi61 In line with this, the “developmental programming” model suggests that ELS triggers a cascade of biological changes, HPA axis hyperactivity, systemic inflammation, and epigenetic modifications, that collectively prime the organism for metabolic dysregulation and mood instability later in life. Reference Salmina, Gorina and Komleva62 Adolescent fructose consumption could be considered a “second hit” that increases vulnerabilities induced by ELS.
The behavioral alterations observed in MS180 + fructose rats could be related to changes in neuronal activation signaling within limbic regions that regulate stress-coping behavior. Reference Gildawie, Wang and Budge63,Reference Mitra, Lenglos and Martin64 Forced swim exposure triggers c-Fos expression, a marker for neuronal excitation, in stress-responsive circuits, including the hippocampus, medial prefrontal cortex, amygdala, paraventricular nucleus (PVN), and the locus coeruleus (LC). Reference Choi, Chung and Cho65 Recent evidence showed that MS180 reduces FST-induced c-Fos expression and cell number in the LC, and that inhibiting the LC in MS180 mice increases climbing time. Reference Vazquez, Becker and Kuo66 Thus, suggesting that ELS could alter neuronal activation patterns in brain areas that underlie coping strategies. Although evidence connecting fructose intake with FST-related c-Fos activation remains inconsistent, Reference O’Flaherty, Neigh and Rainnie67 our results suggest that ELS, rather than diet, is responsible for the altered coping response. Future work examining LC neuronal activation in MS180 + fructose rats will help us clarify whether reduced neuronal activation contributes to the altered coping responses observed here.
In this study, ELS alone significantly affected body weight, glucose tolerance, and CORT levels without increasing energy intake. These findings align with evidence linking early adversity to dysregulation of the HPA axis and glucocorticoid signaling, which can impair insulin sensitivity and glucose metabolism. Reference Lajud, Roque and Cajero20,Reference Danese and Tan54 However, although similar effects were observed in MS180 + Fructose rats, baseline CORT levels in this group were not significantly higher than controls. This apparent discrepancy may be explained by a possible compensatory regulation of the HPA axis in response to the combined stress and dietary challenge, modulating glucocorticoid secretion to prevent chronic overactivation. Further studies are needed to fully characterize other components of the HPA axis, such as hypothalamic corticotropin-releasing hormone, neuropeptide Y, or adrenocorticotropic hormone.
An additional limitation of our study is that it was conducted exclusively in male rats. Sex differences play a critical role in metabolic and behavioral programming, and evidence suggests that females may be more susceptible to fructose-induced alterations, Reference Hyer, Dyer and Kloster68,Reference De Souza, de Barros and De Souza69 whereas males are more sensitive to high-fat diets. Reference Maric, Krieger and van der Velden70,Reference Hyer, Dyer and Kovalchick71 The present study focused on males as the effects of MS180 in females remain controversial. While some studies report long-term behavioral and neuroendocrine consequences in both sexes, these effects tend to be less pronounced or not found in females, Reference Dimatelis, Vermeulen and Bugarith72,Reference Wigger and Neumann73 and in some cases it has been shown that females exhibit behavioral resilience to ELS. Reference Dimatelis, Vermeulen and Bugarith72,Reference Spivey, Shumake and Colorado74 Since the present study has a multifactorial design aimed to evaluate the interaction between fructose diet and ELS, we decided to focus on males, which show a robust effect of MS180, rather than include females whose results, although highly relevant, could lose interpretative clarity within a more complex experimental design.
It is important to note that most preclinical studies investigating the effects of fructose use high-concentration exposures (≥20% of caloric intake), which may not reflect typical human consumption patterns (estimated whole-population fructose intake is 9.1%). Reference White75,Reference Marriott, Cole and Lee76 Fructose-rich diets are known to promote adiposity, insulin resistance, and hepatic steatosis, especially when consumed during critical developmental windows. Reference Harrell, Burgado and Kelly38,Reference Hsu, Konanur and Taing43 Although species differences in fructose metabolism exist, the underlying enzymatic pathways are largely conserved between rodents and humans. Reference Hannou, Haslam and McKeown77 Therefore, moderate concentrations such as the 10% fructose solution used here are necessary to induce physiologically relevant effects comparable to those observed in humans consuming SSBs. So, while quantitative metabolic rates differ across species, the direction of fructose-induced effects on metabolic and behavioral outcomes remains comparable. There are reports of rats fed a high-fructose diet exhibited greater weight gain efficiency Reference Rendeiro, Masnik and Mun78,Reference Pereira, Botezelli and da Cruz Rodrigues79 and fasting hyperglycemia compared to chow-fed controls. Reference Harrell, Zainaldin and McFarlane24 Similarly studies have found that adolescent rats on a short-term 20% fructose diet developed hepatic mitochondrial dysfunction and reduced insulin sensitivity that persisted even after the diet stopped. Reference Mazzoli, Gatto and Crescenzo49
Our results extend these findings by showing that even 10% fructose exposure can induce long-lasting behavioral alterations even in the absence of severe metabolic imbalance
Conclusion
Our results support the hypothesis that the co-occurrence of early life adversity and poor dietary habits during adolescence exerts synergistic effects that increase vulnerability to mood disorders in adulthood, even in the absence of severe metabolic dysfunction. While ELS or mild fructose exposure alone produced only modest behavioral or physiological alterations, their combination led to increased emotionality. These findings align with a double-hit framework, suggesting that adverse experiences during early life may prime the organism to be more susceptible to later challenges, particularly during periods of high neurodevelopmental plasticity such as adolescence. This study suggests that metabolic challenges during a critical period may exacerbate the long-lasting behavioral consequences of early adversity, reinforcing the relevance of early prevention strategies and dietary interventions in vulnerable populations.
Supplementary material
The supplementary material for this article can be found at https://doi.org/10.1017/S2040174425100433.
Data availability statement
The data that support the findings of this study are available from the corresponding author upon reasonable request.
Acknowledgments
None.
Author contribution
GC-C: Data curation, Visualization, Writing – Original draft. KH: Investigation, Data curation, Validation. RR-G: Investigation, Data curation, Validation. JZ-F: Investigation, Data curation. AR: Methodology, Investigation. NL: Conceptualization, Methodology, Investigation, Data curation, Visualization, Writing – Original draft, Writing – Review & Editing, Supervision, Project administration, Funding acquisition.
Financial support
This study was partially funded by SECIHTY grant No. CBF2023-2024-32 awarded to NL. Roberto Ruiz was a graduate student in the Programa de Doctorado en Ciencias Biológicas, Universidad Michoacana de San Nicolás de Hidalgo, and received a scholarship from CONACYT (CVU No. 823101). The funding sources had no role in the study design, data collection and analysis, decision to publish, or preparation of the manuscript.
Competing interests
None.
Ethical standard
The authors assert that all procedures contributing to this work comply with the ethical standards of the national guidelines on the care and use of laboratory animals of Mexico (NOM-062-ZOO-1999) and were approved by the National Research Committee of the Instituto Mexicano del Seguro Social (approval ID: R-2016-785-066).