Implications
It is vital that any tool recommended for use to increase farm profitability is thoroughly tested, ideally using field data. In this relatively large study, we estimate that the change in herd profitability per unit change in the herd average genetic merit for the Irish total merit index, was within expectations. Although this association analysis does not imply cause and effect, it indicates that herds with higher genetic merit for overall profitability, after accounting for some potential confounding management influences, are more profitable.
Introduction
A wide variety of factors affect pastoral dairy herd performance including stocking rate (Dillon et al., Reference Dillon, Crosse, Stakelum and Flynn1995), concentrate supplementation rate (Kennedy et al., Reference Kennedy, Dillon, Faverdin, Delaby, Buckley and Rath2002) and animal genetic merit (Horan et al., Reference Horan, Faverdin, Delaby, Rath and Dillon2006; McCarthy et al., Reference McCarthy, Horan, Dillon, O'Connor, Rath and Shalloo2007; Macdonald et al., Reference Macdonald, Penno, Lancaster and Roche2008; Williams et al., Reference Williams, Oltenacu, Bratton and Milligan2008). Coleman et al. (Reference Coleman, Pierce, Berry, Brennan and Horan2010) documented that animals of greater genetic merit for the Irish total merit index, the economic breeding index (EBI; Berry et al., Reference Berry, Shalloo, Cromie, Veerkamp, Dillon, Amer, Kearney, Evans and Wickham2007), were more profitable than animals of lower EBI. However, all of the aforementioned studies are from controlled experiments, where the number of experimental units for the economic analysis (i.e. genotype or genotype by production system) is generally few. Additionally, the economic analyses of experimental data, generally undertaken using bioeconomic models, are limited by the data recorded during the experiment and attributable to the different experimental units within the experiment, as well as the parameters included in the bioeconomic model.
Access to physical, financial and genetic data from commercial farms provides a larger number of experimental units to quantify associations between different factors and subsequent performance and profitability across a range of production systems. The main disadvantage of such an approach is that the environments are less controlled; this can be somewhat negated, however, by accounting for confounding factors in the statistical model, where data are available. Nonetheless, few studies (Weersink et al., Reference Weersink, Howard, Dekkers and Lohuis1991; Steine et al., Reference Steine, Kristofersson and Guttormsen2008; Roibas and Alvarez, Reference Roibas and Alvarez2010) have used data from commercial farms to quantify the association between genetic merit and performance. Two of the aforementioned studies were based on a limited number of herds and neither evaluated the association between a total merit index and profitability; 18 and 83 herds were included in the study of Weersink et al. (Reference Weersink, Howard, Dekkers and Lohuis1991) and Roibas and Alvarez (Reference Roibas and Alvarez2010), respectively. Only one of the studies (Steine et al., Reference Steine, Kristofersson and Guttormsen2008) used data from a large-scale field study in Norway.
The objective of this study was to quantify the association between genetic merit and profitability across a large number of commercial Irish dairy herds. Particular emphasis was given to the association between the Irish total merit index, the EBI and profitability. Results from this study will be useful in documenting the expected change in profitability associated with changes in herd EBI.
Material and methods
Financial and physical data
Profit Monitor is a web-based software package administered by Teagasc, a semi-state agri-food organisation in the Republic of Ireland that provides research, education and extension services. Profit Monitor allows Irish farmers, with the assistance of their Teagasc advisers, to collect and compare farm physical and financial data. The data are held centrally and secure access to the database is provided to facilitate the input of data and viewing of reports. Currently Profit Monitor has approximately 2000 individual dairy farmer users. In the present study, data were extracted from Profit Monitor on farm physical and financial performance from 1606 Irish spring calving dairy farms with >20 cows (representing 3162 farm years) for the years 2007 to 2009, inclusive. All herds had information on physical and financial performance.
Monthly animal numbers of cows, replacement heifers and dry stock (i.e. beef cattle and sheep) were averaged across each calendar year to determine average livestock units for each of the three respective categories. Total farm milk production was divided by total dairy cow livestock units present on the farm to calculate average milk yield per cow. Average annual milk fat and protein concentrations were obtained from the milk processor returns and used to calculate yield of fat and protein (i.e. milk solids yield expressed in kilograms). Average milk price per farm, although available from the milk processor, was standardised to a common value within year based on the value of each kilogram of fat and protein, with a deduction for milk volume. Milk price was calculated using a value of €3.31, €3.29 and €2.38/kg milk fat in the years 2007, 2008 and 2009, respectively; the respective values per kilogram milk protein were €7.28, €7.23 and €5.23. A deduction of 0.04 c/l was attributed to milk volume and this was consistent across all years. Farm stocking rate was calculated by dividing the hectares of forage area (grassland and forage crop area combined) utilised into the total livestock units on the farm. The animal categories included in the calculation of total livestock units were dairy cows, replacement heifers and dry stock.
Standard values per animal were used across all farms, where transfers were from the dairy herd to the heifer or drystock enterprise or vice versa; otherwise, actual recorded animal values were used. Dairy cows were valued at €700 each, newborn replacement and beef calves transferred from the dairy enterprise were valued at €300 and €150, respectively, and freshening replacements introduced to the dairy enterprise were valued at €1000 each.
Gross revenue output per farm was calculated by combining farm milk sales receipts (based on the standardised milk price), calf and cow sales and the standard value of calf transfers to beef and heifer enterprises. The cost of purchased freshening heifers and cows or the standard value of freshening heifers transferred from the farm's replacement heifer enterprise was then deducted, and an adjustment made for stock inventory change, where applicable. This variable will be hereon in referred to as ‘gross revenue output’.
Variable costs recorded in the Profit Monitor included feed and fertiliser, breeding and veterinary costs, and farm contractor costs, as well as other variable costs, including milk recording, parlour expenses and bedding costs. Dairy cow feed and parlour expenses were allocated directly to the dairy enterprise. Most of the other variable costs were apportioned in the Profit Monitor system on a percentage livestock unit basis. For example if the dairy enterprise accounted for 60% of the farm's total livestock units, then 60% of the remaining variable costs were allocated to the dairy enterprise.
Fixed costs recorded include machinery running and lease costs, hired labour, repairs and maintenance, depreciation, electricity, phone and transportation expenses, as well as the costs of leasing land and milk quota. Dairy cow fixed costs were allocated in proportion to the percentage of the farm's gross revenue output attributed to the dairy enterprise.
Net margin was calculated as the profit remaining after all variable and fixed costs were deducted from the gross revenue output. Net margin was expressed per litre of milk produced by dividing the total net margin of the dairy enterprise by the total volume of milk produced on the farm. Net margin per cow was calculated by multiplying net margin per litre by the average milk produced per cow. Net margin per hectare was calculated by multiplying net margin per cow by the average farm stocking rate expressed in livestock units per hectare. Total variable costs, fixed costs and gross revenue output were calculated using a similar approach.
Calving interval for each cow on the farm was available from the Irish Cattle Breeding Federation (ICBF) database and was used to calculate herd median calving interval for each year.
Genetic data
Herd average genetic information for the individual traits included in the EBI, as well as genetic merit for overall cow conformation, was extracted from the ICBF database for the lactating dairy cows present on the farm in each year. Economic values in 2010 were used to calculate the herd average EBI as well as the production and fertility sub-indices of the EBI. The EBI and its sub-indices are described in detail by Berry et al. (Reference Berry, Shalloo, Cromie, Veerkamp, Dillon, Amer, Kearney, Evans and Wickham2007); EBI is expressed as expected profit per lactation of the progeny of the animal in question, and the genetic merit values of the component traits are, therefore, expressed as predicted transmitting abilities (PTAs). The milk production sub-index, measured in euros, is one of the six sub-indices (i.e. production, fertility, calving performance, beef performance, maintenance and health) of the EBI and is made up of a negative economic weight on milk volume and positive economic weights on fat and protein yield. The fertility sub-index, also measured in euros, is made up of calving interval, with a negative economic weight, and survival, with a positive economic weight. Only herds where genetic data were available on ⩾75% of the lactating animals in that year were retained. Data on herd genetic merit for overall conformation, udder conformation and legs conformation were available for 910 of these herds.
Following the merging of genetic (excluding overall conformation) and Profit Monitor data (i.e. milk production and financial performance), 1131 herds representing 2201 herd-years remained for inclusion in the subsequent analyses.
Association analyses
A series of partial correlations were undertaken between herd average genetic merit and herd average milk production and financial performance; all variables were pre-adjusted for year to minimise the impact of temporal trends on the associations. The association between herd average genetic merit and herd milk production and financial performance was quantified using mixed models in PROC MIXED (SAS, 2009), where herd (n = 1131) within the county of Ireland (n = 18) was included as a repeated effect; the covariance structure applied among years within herd was based on minimising the Akaike information criterion of the model. The dependent variables, all of which were normally distributed, included gross revenue output, total variable costs, total fixed costs and net margin per litre, per cow and per hectare; milk price per litre was also investigated.
Confounding variables tested for inclusion in the model were year (2007 to 2009), herd size (continuous variable), stocking rate (continuous variable) and purchased feed per hectare (continuous variable assumed to represent concentrate input). Following the development of the model, the genetic-related variables were individually included in the model. These variables included either herd average genetic merit for EBI or, in a separate analysis, the two main sub-indices of the EBI (the milk production sub-index and the fertility sub-index), as well as overall cow conformation. Non-linear associations with continuous variables were also tested for inclusion in the model.
Results
Herd performance and genetic merit
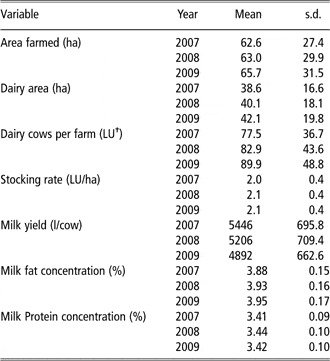
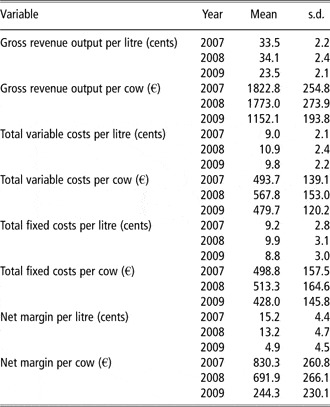
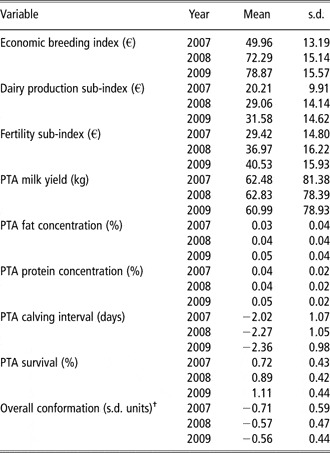
Summary statistics for a range of herd milk production, financial performance and herd genetic merit variables are detailed in Tables 1, 2 and 3, respectively. Although the differences in annual mean production and financial performance is affected by herds entering and leaving the Profit Monitor recording system, the annual trends are identical to the comparison of the 387 herds present across all years (results, therefore, not presented). Herd size and cow numbers increased over the 3-year period. Milk yield per cow decreased while milk fat concentration increased; milk protein concentration was greatest in 2008. Profit per cow decreased annually (Table 2), with a large decrease in 2009, attributable mainly to a large reduction in mean milk price in 2009 (23.26 c/l) compared with 2007 (33.69 c/l) and 2008 (33.81 c/l). Total variable and fixed costs were greatest in 2008.
Mean and standard deviation (s.d.) of performance across herds in 2007 (n = 647), 2008 (n = 776) and 2009 (n = 778)

†Livestock units (LUs) are calculated as follows: 0 to 1, 1 to 2 and >2-year-old cattle are 0.3, 0.7 and 1.0 LU, respectively. Dairy cows are 1.0 LU.
Mean and standard deviation (s.d.) of the financial variables across herds in 2007 (n = 647), 2008 (n = 776) and 2009 (n = 778)

Mean and standard deviation (s.d.) of the genetic merit variables PTA across herds in 2007 (n = 647), 2008 (n = 776) and 2009 (n = 778)

PTA = predicted transmitting ability.
†Number of records for overall conformation for 2007, 2008 and 2009 was 486, 546 and 555, respectively.
The EBI, as well as the milk production sub-index and the fertility sub-index, increased from 2007 to 2009 (Table 3). Trends in genetic merit for milk yield were inconsistent, but genetic merit for milk fat and protein concentration improved, as did the genetic merit for calving interval and survival. Genetic merit for overall type decreased year on year.
Associations between non-genetic factors and financial performance
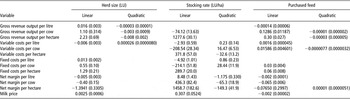
Associations among herd size, stocking rate, quantity of purchased feed and financial performance, when undertaken using a multiple regression approach, are summarised in Table 4. Gross revenue output increased at a declining rate with increases in herd size. Stocking rate was not associated with gross revenue output per litre, but was associated with a linear decline in gross revenue output per cow and a linear increase in gross revenue output per hectare. The quantity of purchased feed used was negatively and linearly associated with gross revenue output per litre, while gross revenue output per cow and per hectare increased at a declining rate as quantity of purchased feed increased.
Significant (P < 0.05) linear and quadratic regression coefficients (standard errors in parenthesis) of herd financial performance on herd size, stocking rate and quantity of purchased feed in a multiple regression model

Variable costs per litre decreased non-linearly with increasing herd size, while variable costs per cow and per hectare were not associated with herd size. Variable costs per litre and per cow declined non-linearly with increasing stocking rate, while variable costs per hectare increased non-linearly. Variable costs per litre increased linearly with increasing quantities of purchased feed.
Fixed costs, per litre, per cow and per hectare, increased linearly with increasing herd size. Fixed costs per litre and per cow declined non-linearly with increasing stocking rate, while fixed costs per hectare increased linearly with increasing herd size. Fixed costs per cow and per hectare increased linearly with increasing quantities of purchased feed.
Net margin, per litre, per cow and per hectare, declined linearly with increasing herd size and increased quantity of purchased feed and increased non-linearly with increasing stocking rate. Milk price increased linearly with increasing herd size and stocking rate and declined linearly as purchased feed quantity increased.
Associations between genetic factors and performance
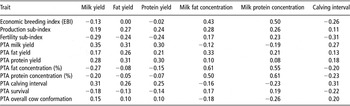
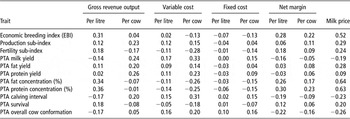
The correlations among a range of variables describing the average genetic merit of a herd and both the physical performance and financial performance of the herd are detailed in Tables 5 and 6, respectively. The EBI was associated with reduced milk yield but with greater milk composition (Table 5), resulting in higher milk prices per litre (Table 6). Greater profit, both per litre and per cow were associated with increased EBI; 4.8% of the variation in net margin per cow was explained by differences in herd EBI. Greater genetic merit for the milk production sub-index was associated with increased milk yield, milk composition and milk price, but was also associated with a deterioration in herd median calving interval. Nonetheless, gross revenue output and profit increased with genetic merit for the milk production sub-index. Genetic merit for the fertility sub-index was associated with reduced milk, fat and protein yield, but improved milk composition and milk price. The fertility sub-index was associated with an improvement in herd median calving interval and, although associated with reduced gross revenue output per cow, it was associated with greater profit. Moderate positive correlations (0.26 to 0.61) existed between genetic merit for an individual trait and average herd performance for that trait (e.g. genetic merit for milk yield and average cow milk yield). Genetic merit for cow conformation was associated with greater milk yield, poorer milk composition and reduced profit.
CorrelationsFootnote † among herd average genetic merit (PTA) and physical performance

PTA = predicted transmitting ability.
† Correlations ⩽|0.04| were not different from 0.
CorrelationsFootnote † among herd average genetic merit (PTA) and financial performance

PTA = predicted transmitting ability.
† Correlations ⩽|0.04| were not different from 0.
Following adjustment for year, stocking rate, herd size and quantity of purchased feed in the multiple regression analysis, average herd EBI was positively and linearly associated (P < 0.001) with net margin per cow and per litre as well as gross revenue output per cow and per litre. Net margin per cow increased by €1.94 (s.e. = 0.42) per unit increase in EBI; net margin per litre milk produced increased by 0.043 c/l (s.e. = 0.0075 c/l) per unit increase in EBI. Gross revenue output per cow increased by €1.64 (s.e. = €0.38) per unit increase in EBI; gross margin per litre milk produced increased by 0.040 c/l (s.e. = 0.0037 c/l) per unit increase in EBI. The association between EBI and milk price was non-linear (milk price = 0.0437 (s.e. = 0.004327)×EBI + 0.0043 (s.e. = 0.000029)×EBI2).
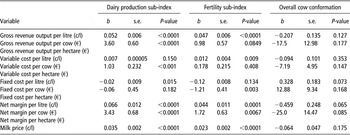
The change in average herd financial performance per unit change in herd average genetic merit for the dairy production sub-index, the fertility sub-index and overall conformation, when estimated simultaneously in a multiple regression model, are detailed in Table 7. No non-linear associations existed. All regression coefficients for output and net margin on both the production and fertility sub-index were positive, albeit not always different from zero for the fertility sub-index, indicating an increase in profit and output per unit increase in each sub-index, independent of the other sub-index. The associations between overall conformation and profitability were not different from zero.
Regression coefficient (b) and associated standard errors (s.e.) as well as significance of the regression coefficients from zero for herd financial performance on the dairy production sub-index, fertility sub-index and overall conformation estimated in a multiple regression model that also included the confounding variables of herd size, stocking rate and quantity of purchased feed

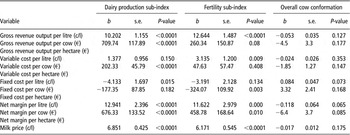
The associations between herd financial performance and genetic merit for milk sub-index, the fertility sub-index and overall conformation, standardised to have equal variances, are outlined in Table 8. The sign and significance of the associations did not differ from Table 7, but the expected change in performance per unit change in overall conformation relative to the other sub-indices was less attributable to the differential variances of the measures of genetic merit.
Regression coefficient (b) and associated standard errors (s.e.) as well as significance of the regression coefficients from 0 for herd financial performance on the dairy production sub-index, fertility sub-index and overall conformation, standardised to have equal variances, when estimated in a multiple regression model that also included the confounding variables of herd size, stocking rate and quantity of purchased feed

Discussion
The primary objective of this study was to quantify the association between herd genetic merit and both performance and profitability across 1131 commercial Irish dairy farms. Of particular interest was the association between herd average EBI, the total merit index in Ireland, and profitability per cow. The annual increase in herd size observed in the present study (Table 1) reflects the national trend across Irish dairy farms (National Farm Survey, 2006 and 2009). The highest net margin, observed in 2007, reflected the sharp rise in milk price observed in the latter half of the year (Central Statistics Office (CSO), 2010). In 2009, in comparison, the prevailing world market conditions resulted in a dramatic reduction in the milk price (CSO, 2010). Variable costs, in particular feed and energy-related costs, such as fertiliser and contractor costs, rose in 2008. The reduction in variable and fixed costs in 2009 reflect lower quantities of inputs used by farmers as they attempted to cut production costs to alleviate the erosion in revenue from the lower milk price in 2009. Their efforts were only partly successful, however, and net margin per cow fell substantially, particularly between 2008 and 2009. The trends in net margin per litre follow similar trends to those observed nationally (National Farm Survey 2007, 2008 and 2009) albeit at a higher level.
The improvement in herd EBI in the herds used in the present study reflects a similar upward trend in herd EBI observed nationally (ICBF, 2009), with the average dairy cow EBI of the national herd increasing from €62.50 in 2007 to €74.80 in 2009.
Associations between non-genetic factors and financial performance
Non-genetic factors previously reported to be associated with financial performance on pastoral dairy farms include stocking rate (Macdonald et al., Reference Macdonald, Penno, Lancaster and Roche2008), calving date (Horan and Shalloo, Reference Horan and Shalloo2007), feed cost (McCall and Clark, Reference McCall and Clark1999; Shalloo et al., Reference Shalloo, Dillon, Rath and Wallace2004), length of grazing season (Dillon et al., Reference Dillon, Shalloo, Wallace and Butler2005a) and land type (Shalloo et al., Reference Shalloo, Dillon, Rath and Wallace2004). Many studies have investigated the relationship between farm size and technical efficiency, although much of this research originates from mainly confinement dairy systems (Smith et al., Reference Smith, Ely and Chapa2000; Oleggini et al., Reference Oleggini, Ely and Smith2001). Oleggini et al. (Reference Oleggini, Ely and Smith2001) reported higher milk yields and higher feed costs in larger herds while Smith et al. (Reference Smith, Ely and Chapa2000) reported lower culling rates for infertility and mastitis. Jago and Berry (Reference Jago and Berry2011), using data from Irish spring calving dairy herds, reported no difference in milk yield between herds differing in size, although the reproductive performance in larger herds was superior to that of smaller herds. The finding that gross revenue output per cow increased with increasing herd size while production costs increased at a more rapid rate is at variance with the work of Romain and Lambert (Reference Romain and Lambert1994) who reported that milk production costs did not vary significantly with herd size in Quebec. Many proposed agricultural policy initiatives, such as European Union (EU) milk quota abolition, are designed to encourage farmers to increase the size of their farms to lower costs and/or raise income. The results of this study indicate that increasing scale may not necessarily result in improved profitability per litre or per cow but it is associated with an improvement in profitability per farm. In a similar analysis of Spanish dairy herds, Alvarez and Arias (Reference Alvarez and Arias2004) argued that increased scale, per se, does not increase profitability, as generally only more efficient farmers increase the size of their operations.
As grass growth is highly seasonal in Ireland, recommended stocking rates are designed to achieve a balance between grass utilisation and production per cow and per hectare to achieve the highest overall dairy farm profitability (Shalloo et al., Reference Shalloo, Dillon, Rath and Wallace2004). Penno (Reference Penno1999) suggested that the ideal stocking rate should balance the dual objectives of generous feeding to achieve high levels of efficiency of milk production per cow, and under-feeding to achieve high levels of pasture utilisation to meet the overall objective of maximising farm profitability. Many dairy production experiments under grazing conditions have observed increased production per hectare as stocking rates increased, while production per cow declined (Macdonald et al., Reference Macdonald, Penno, Lancaster and Roche2008 and Reference Macdonald, Beca, Penno, Lancaster and Roche2011). The overall non-linear association between stocking rate and profitability observed in this study is in agreement with the pastoral dairy systems research of Ahlborn and Bryant (Reference Ahlborn and Bryant1992) who reported that net income per cow was maximised at higher stocking rates of 3.0 and 3.7 cow per hectare for Holstein-Friesian and Jersey cows, respectively. Both Baker and Leaver (Reference Baker and Leaver1986) and Stakelum and Dillon (Reference Stakelum and Dillon2007) reported compromised mid- and late-season grass quality and milk production on farms with lower stocking rates, due to under-grazing in the early part of the grazing season, while excessively high stocking rates are associated with under-feeding and reduced milk productivity per cow and per hectare (Macdonald et al., Reference Macdonald, Penno, Lancaster and Roche2008 and Reference Macdonald, Beca, Penno, Lancaster and Roche2011; Baudracco et al., Reference Baudracco, Lopez-Villalobos, Holmes and Macdonald2010). The results of the present study indicate that net margin per cow was optimised at stocking rates of between 3.0 and 3.7 livestock units per hectare, while net margin per hectare increased at a declining rate with stocking rate and reflects the increased feed utilisation efficiency of higher stocking rates (Coleman et al., Reference Coleman, Pierce, Berry, Brennan and Horan2010). Similar to previous studies (Macdonald et al., Reference Macdonald, Beca, Penno, Lancaster and Roche2011), this analysis shows that high stocking rate systems, characterised by their capability for low-cost, high milk productivity per hectare with lesser milk production per cow, increase the profitability of milk production from pasture.
While concentrate supplements are generally offered to pasture-fed dairy cows to alleviate shortfalls in pasture dry matter intake (Holmes et al., Reference Holmes, Brookes, Garrick, Mackenzie, Parkinson and Wilson2002), increased stocking rates post EU milk quota are likely to result in more frequent and prolonged periods of pasture deficit and a consequential requirement for more efficient concentrate supplementation strategies. The increase in variable and fixed costs per litre, as purchased feed quantity increases, has been widely reported (Dillon et al., Reference Dillon, Hennessy, Shalloo, Thorne and Horan2008) and is explained by the competitive cost of grazed grass and lower mechanisation in grazing systems, compared with systems requiring increased purchased supplements (Dillon et al., Reference Dillon, Roche, Shalloo and Horan2005b). The current study also demonstrates that while increased purchased feed is associated with an increase in milk productivity per cow and per hectare, as reflected in gross revenue output, the non-linear relationship indicates that these productivity benefits are reduced as the level of purchased feed increases possibly due to high grass substitution rates and low milk production responses to supplementary feeding (Bargo et al., Reference Bargo, Muller, Delahoy and Cassidy2002; Holmes et al., Reference Holmes, Brookes, Garrick, Mackenzie, Parkinson and Wilson2002). Similar to McCarthy et al. (Reference McCarthy, Horan, Dillon, O'Connor, Rath and Shalloo2007), the results of the present study indicate that profitability is eroded as the quantity of purchased feed increases.
Associations between genetic merit and performance
Previous results from a controlled experiment in Ireland indicated that higher EBI cows were more profitable than lower EBI cows (McCarthy et al., Reference McCarthy, Horan, Dillon, O'Connor, Rath and Shalloo2007), corroborating the results reported in the present study at a farm level. Because the EBI is expressed in PTA of profitability per lactation of progeny rather than breeding values, a 1-euro difference in herd EBI is expected to result in a 2-euro difference in herd average profit per lactation. Because Irish spring seasonal calving herds calve in early spring and dry off at the end of the year, a calendar year therefore, equates approximately to a full lactation. The regression coefficient of €1.94 (s.e. = 0.42) of profit margin per cow on herd average EBI is therefore not different from the expectation. This is despite the EBI including genetic information on only 15 traits, while profit per cow was the accumulation of all costs and revenues of the ‘average’ cow in each herd. The average milk price included in the derivation of the economic values within the EBI is currently 27 c/l. Furthermore, the associations between herd genetic merit for the individual traits and herd average performance are in line with expectation based on covariances reported in the literature using individual cow data. For example, the partial correlation between genetic merit for milk yield and herd average calving interval was positive, corroborating positive genetic correlations estimated using individual Irish Holstein-Friesian cows between milk yield and calving interval (Berry et al., Reference Berry, Kearney, Twomey, Cromie and Evans2010). The partial correlation coefficients of genetic merit for milk, fat and protein yield as well as milk composition on the respective herd average value is weaker than expected; the correlation squared is expected to equal the heritability, which is 0.35 for the milk traits (Berry et al., Reference Berry, Shalloo, Cromie, Veerkamp, Dillon, Amer, Kearney, Evans and Wickham2007). The squared correlation of EBI on net margin per lactation (0.048) is close to the expectation of the heritability (h 2) of EBI of 0.062 approximated as
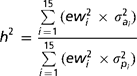
where ewi is the economic weight on trait i in the breeding goal,  is the additive genetic variance of trait i and
 is the phenotypic variance of trait i. This suggests that herd average EBI explains 0.048 of the variation in herd average net profit per lactation.
The positive association between herd average milk price and the milk production sub-index agrees with expectations, since the goal of the milk production sub-index is to increase milk solids yield and also milk composition, as is evident by the negative economic weight on milk volume. In Ireland, the value of manufacturing milk is calculated from its composition of fat and protein less a deduction for volume. The association, therefore, between herd genetic merit for the milk production sub-index and milk price is due to the positive correlations between the milk production sub-index and herd average milk composition. However, simultaneous selection on fertility is also warranted to maximise profitability by negating the association between selection on the milk production sub-index and the deterioration in herd median calving interval (Table 5).
The lack of association between overall cow conformation and measures of profitability per cow and per litre is in direct contrast to Weersink et al. (Reference Weersink, Howard, Dekkers and Lohuis1991), where a positive association between dairy type and profitability tended towards significance in Canadian Holstein-Friesian cows. However, in the study of Weersink et al. (Reference Weersink, Howard, Dekkers and Lohuis1991), the PTA for dairy type of the weighted average of AI sires used on the study farms was used as a proxy indicator of dairy cow-type producing in the herd, the number of study herds was small (n = 18) and analysis was based on 1 year's financial data. The present study, in contrast, used information from 911 herds for herd average PTA for overall conformation and financial data from 3 years.
Conclusions
Results derived from a large data set of commercial herds, with accurate information on profitability and genetic merit, indicate that, after accounting for confounding factors, the change in herd profitability per unit change in herd genetic merit for the total merit index is within expectations. This is due to clear associations between herd average genetic merit for the individual component traits of the total merit index and actual herd performance for the respective traits. This points to benefits of genetic improvement at the herd level.
Acknowledgement
Dr Laurence Shalloo, Teagasc, Moorepark is gratefully acknowledged for his invaluable contribution.