1. INTRODUCTION
Risk is found throughout engineering design. Engineering risk methods such as failure modes and effects analysis (FMEA), fault tree analysis (FTA), and others are used across the spectrum of complex system design to identify these risks. In particular, such methods are designed to guide decision makers to choose the least risky options, mitigate the largest risks, and create risk-averse or fault-tolerant designs. Such an approach works well for traditionally risk-averse sectors such as the aerospace and nuclear power industries. However, not all industries and enterprises thrive on risk aversion. Many of the most successful Web 2.0 companies such as Google and Facebook and product design companies such as IDEO have become successful because they take risks that traditional, risk-averse companies are not willing to take. There is no one correct level of risk attitude for all industries.
Many methods exist in engineering design to account for risk such as functional failure identification propagation (Kurtoglu & Tumer, Reference Kurtoglu and Tumer2008), risk in early design (Grantham-Lough, Stone, & Tumer, Reference Grantham-Lough, Stone and Tumer2007), or function failure design method (Stone, Tumer, & Van Wie, Reference Stone, Tumer and Van Wie2005), FMEA (Stamanis, Reference Stamanis2003). However, these methods do not account for risk appetites of enterprises or individual decision makers. Research in psychology has produced the well-respected Domain-Specific Risk-Taking (DOSPERT) test, which enables risk appetite determination in several different domains of daily life (Weber, Blais, & Betz, Reference Weber, Blais and Betz2002). Recent advances created the Engineering DOSPERT (E-DOSPERT) test, which has the goal of categorizing and determining engineering-specific risk domains (Van Bossuyt, Carvalho, Dong, & Tumer, Reference Van Bossuyt, Carvalho, Dong and Tumer2011). The present research seeks to find a link between the engineering risk appetite information that the E-DOSPERT test provides with traditional and widely used engineering risk methods.
Specifically, this article presents a novel way to account for risk appetite in risk-based design. A single-criterion decision-based design (DBD) approach is adapted by way of engineering risk appetite utility functions that bring risk data from the expected-value (EV) domain into a risk appetite domain appropriate to the enterprise or individual stakeholder. The risk appetite utility functions are developed via E-DOSPERT test results rather than traditional lottery methods. By viewing risk data through a risk appetite lens, stakeholders and decision makers can make risk decisions with analytic backing that would traditionally be justified with “gut feeling.” An important distinction is drawn between appropriate uses of lottery-derived risk utility functions and E-DOSPERT-derived risk utility functions. Lottery methods of risk utility functions generation are suitable for later stage conceptual system design and beyond, whereas the authors advocate using E-DOSPERT-derived risk utility appetite functions for early phase conceptual system design. Psychometric tests such as E-DOSPERT are aspirational in nature, whereas lottery methods are predictive of future decisions (Pennings & Smidts, Reference Pennings and Smidts2000). The method presented in this article specifically provides a means of aspiring to the intrinsic risk appetite of the E-DOSPERT test taker rather than using past performance as measured by lottery methods to predict future performance. In the early phases of conceptual design, it is more useful to aspire to create something new than to use the same decision patterns as have been done in the past.
The method presented in this article can be used with any type of risk to which a dollar figure can be attached. This article uses product-related risk examples. However, other risks, such as those found in project management or elsewhere, may also be used with this method.
It is important to note that this method does not claim to produce a “right” or “wrong” decision. The suitability of the decisions that can be supported with the method presented in this article are based on the attitude of the decision maker as defined by the decision maker's decision criteria. There are no right or wrong decision criteria but instead criteria that are more or less important to the decision maker (Hazelrigg, Reference Hazelrigg1998). The method developed in this article provides a novel criteria that decision makers may use when making risk-based decisions. As the case study demonstrates, decisions can have different results when made based upon the information produced by this method.
Risk-averse decision makers and enterprises will find this method useful in highlighting risks with higher certainty. A risk-averse stakeholder tends to favor high certainty over low certainty options. Likewise, risk-tolerant decision makers and enterprises will find that identifying large risks will drive potential innovation and profit (Dvir & Pasher, Reference Dvir and Pasher2004). Thus, this article develops a novel way to account for risk appetite in risk-based design.
The method presented in this article holds significance for intelligent decision support systems based upon the method's ability to inform the user of the preferred design choice, based upon risk information, of the stakeholder for whom the user is designing. In this way, partial automation of the engineering risk decision-making process can be realized. In addition, the method can be used by an engineer to support their own decision-making process by providing quantitative backing to “gut feeling” decisions. Moreover, the method is intended to be used as a real-time decision support system rather than a postdesign confirmatory tool. The method presented in this article can be automated if decision-maker risk attitudes are known. This would be useful in automated design trade studies and other design automation applications where decision-maker input is desired but where each design iteration does not need fresh decision-maker input.
In the following sections, background is provided in several relevant fields for the proposed method. Coverage includes design trade studies, risk analysis in collaborative design centers (CDCs), the psychology of assessing and judging risk, DBD, and risk-based utility theory. The novel method of accounting for risk appetites in risk-based design is then developed and demonstrated using an illustrative example. A case study based upon a simplified satellite conceptual design development and selection process is presented next to emphasize the benefits of this new method in a realistic complex design setting. The article concludes with a discussion of the benefits and drawbacks of the proposed method, and suggests future work to expand the method.
2. BACKGROUND
The method presented in this article makes use of several domains of engineering and psychology. This section reviews the topics of engineering risk, trade studies, the psychology of assessing and judging risk, and DBD, each of which is used in developing the risk appetite utility function method.
It is important to define the terms “risk,” “utility,” “riskiness,” “value,” and “uncertainty.” Risk can hold many different meanings but, unless otherwise noted, for the purposes of the method developed in this article, “risk” is defined as the probability of uncertain events (Jones, Reference Jones2005) and the values of potential outcomes. A certainty equivalent value (CE(V)), based upon utility theory, is developed and found in conjunction with the probability of an outcome in order to find the equivalent value of a specific risk. This is analogous to the classical engineering context in which risk can be defined as the probability of occurrence multiplied by the severity of the outcome of the event, but is more closely aligned with the ISO 31000:2009 definition of risk, which defines risk as the effect of uncertainty on objectives (Standards Australia New Zealand, 2009). In this article, “utility” is defined as a measure of satisfaction of a choice or result (Keeney & Raiffa, Reference Keeney and Raiffa1993). In the context of finance, “riskiness” refers to the riskiness of an option, which is equated to its variance. However, in psychological risk-return models perceived riskiness is treated as a variable that can differ between individuals as a function of the context and content of the decision choice (Weber et al., Reference Weber, Blais and Betz2002). “Value” is defined as the worth of a decision, outcome, good, or service, and this is often given a monetary designation. This article uses the dollar ($) as a monetary value designator. Finally, “uncertainty” is defined as the potential of more than one outcome, state, or result where the probabilities are ill defined (Hubbard, Reference Hubbard2007). It should be noted that engineers often group together related concepts such as reliability (IEEE, 1990), robustness (Du & Chen, Reference Du and Chen2000), and uncertainty (Martin & Simpson, Reference Martin and Simpson2006) with the strict definition of risk into a meta-risk category that is also referred to as “risk.”
2.1. Trade studies and different priorities
Design trade studies are found throughout the design process. They are often employed in creating conceptual complex system designs. Trade studies can be used to create many potential designs quickly through automated software packages such as ModelCenter (http://www.phoenix-int.com) or Advanced Trade Space Visualization (Stump, Lego, Yukish, Simpson, & Donndelinger, Reference Stump, Lego, Yukish, Simpson and Donndelinger2009) as part of ModelCenter. Trade studies are also used by teams of people to conduct manual trade study sessions (Oberto et al., Reference Oberto, Nilsen, Cohen, Wheeler, DeFlorio and Borden2005). Automated trade studies can also be performed by computers using conditions and bounds set by users. Many thousands of conceptual designs can be quickly created with an automated trade study. Manual trade studies are conducted by groups of system experts where only one or a handful of conceptual designs will result.
Trade studies are based upon the search for maximum system utility. Trade-offs are made between system design variables in order to achieve maximum utility (Papalambros & Wilde, Reference Papalambros and Wilde2000). This is represented by  $\max f\lpar \mathop {U} \limits^{\rightharpoonup} \rpar $, where
 $\mathop {U} \limits^{\rightharpoonup} $ represents relevant system utility metrics. System utility metrics are to be chosen by design stakeholders. In the case of automated trade studies, different stakeholders will have different design preferences. The most preferred design of one engineer will most likely not be the most preferred design of another engineer. In practice, the literature provides little guidelines on how to create utility functions with appropriate selection criteria for different design situations, such as design of high-risk space exploration.
CDCs often will perform manual trade studies as part of the design process. The most cited example of a CDC is Team-X that is housed in the Project Design Center at the Jet Propulsion Laboratory and develops conceptual spacecraft mission designs (Oberto et al., Reference Oberto, Nilsen, Cohen, Wheeler, DeFlorio and Borden2005). In such manually conducted trade studies, subsystem experts often disagree over which tradeable parameters are the most important (NASA, 1995; Ross et al., Reference Ross, Hastings, Warmkessel and Diller2004; Federal Aviation Administration, 2006). A variety of methods are available to resolve design decision conflicts in both automated and manual trade studies (Russell & Skibniewski, Reference Russell and Skibniewski1988; Ji et al., Reference Ji, Yang and Honda2007). However, these methods do not take individual or enterprise-level risk appetites into account.
2.2. Risk analysis tools
Many methods exist to analyze and account for engineering risk in the design process. Examples are reliability block diagram (International Organization for Standardization, 1997), probabilistic risk assessment (Villemeur, Reference Villemeur2000), FMEA (US Department of Defense, 1980), and FTA (International Electrotechnical Commission, 1990). Other methods such as functional failure identification propagation (Kurtoglu & Tumer, Reference Kurtoglu and Tumer2008), function failure design method (Stone et al., Reference Stone, Tumer and Van Wie2005), and risk in early design (Grantham-Lough et al., Reference Grantham-Lough, Stone and Tumer2007) are being actively developed in academia and will see industrial deployment in the future.
Several tools have been developed to support risk analysis in trade studies for CDCs. Team-X uses the Risk and Rationale Assessment Program, a probabilistic risk assessment based assessment software package (Meshkat, Reference Meshkat2007). The Risk and Rationale Assessment Program tool is used to capture unusual risks that are identified during trade study sessions. One engineer is tasked with cataloging these risks and, with the assistance of stakeholder subsystems engineers, develops likelihood and impact assessments and mitigation methods with associated costing information. Other risk analysis programs and methods are under development and in use by other CDCs.
Methods such as FTA and FMEA and tools such as trade studies commonly deployed in industrial settings and reviewed in the previous section view risk as an EV choice. For example, if an engineer must make a decision between one risk that has a 1% chance of occurrence and has a consequential cost of $10,000 and another risk that has a chance of 0.1% of occurrence and a consequential cost of $100,000, engineering risk methods would indicate that both risks are equal with regard to EV. Therefore, either can be chosen with the same EV outcome. However, this ignores individual and company risk attitude. The method presented in this article allows for individual and enterprise risk appetites to be expressed during the risk decision-making process.
2.3. The psychology of assessing and judging risk
Risk plays an integral role in engineering design. Innovative design firms embrace risk as essential to their success. In contrast, some industries (e.g., aerospace and nuclear power) are very averse to risk. Research in risk trading in engineering design shows that different engineers have different opinions of what makes an acceptable risk (Van Bossuyt et al., Reference Van Bossuyt, Wall and Tumer2010). There is no clear, single correct level of acceptable risk for all situations or all people.
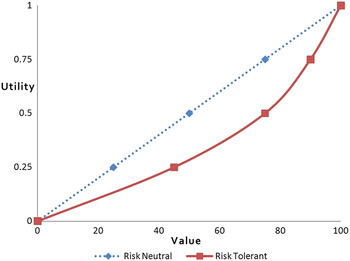
Risk is classically defined in psychology as the parameter that differentiates different individuals' utility functions (Pratt, Reference Pratt1964). The utility function of individuals is generally expressed as a quadratic, logarithmic, or exponential function (Keeney & Raiffa, Reference Keeney and Raiffa1993). This classic expected utility (EU) approach to risk theorizes that an individual can be modeled choosing between risky options as the function of the return of the options, the probability of the options occurring, and the risk aversion of the individual (Bernoulli, Reference Bernoulli1954). Figure 1 shows a risk-tolerant utility function for money. Within the EU framework and other related methods (Kahneman & Tversky, Reference Kahneman and Tversky1979), the function of an individual's utility function denotes the individual's risk attitude as either risk averse (i.e., someone who does not like to take risks), risk neutral (i.e., someone who takes necessary short-term risks to deliver long-term outcomes), or risk tolerant (i.e., someone who is comfortable with handling larger risks if necessary; von Winterfeldt & Edwards, Reference von Winterfeldt and Edwards1986; Hillson & Murray-Webster, Reference Hillson and Murray-Webster2007).
Risk-tolerant utility function for money. [A color version of this figure can be viewed online at http://journals.cambridge.org/aie]

The theory of risk attitudes in the context of EU has been challenged by the twin issues of inconsistent risk profiles across risk domains and cross-method utility instability (Slovic, Reference Slovic1964; MacCrimmon & Wehrung, Reference MacCrimmon and Wehrung1986, Reference MacCrimmon and Wehrung1990; Schoemaker, Reference Schoemaker1990). Different risk-averse or risk-tolerant classifications often result when different methods are used to measure people's utility (Slovic, Reference Slovic1964). Moreover, individuals are not consistent across different risk domains. Although a person might be risk-averse making financial decisions, they could be risk seeking in social situations (Schoemaker, Reference Schoemaker1990).
Other methods have been developed within psychology to make up for the shortcomings of the EU framework. For instance, the risk-return framework of risky choice models people's preference for risky options based upon a trade-off between the EV and the riskiness of the choice. This is analogous to the way most engineering risk methods differentiate risk choices. Psychology extends this to treat perceived risk as a variable that differentiates individuals based upon content and context interpretations. The framework allows people to have different risk preferences in different domains (Weber et al., Reference Weber, Blais and Betz2002) and accounts for desiring risk in some areas but preferring caution in others through the concept of perceived risk attitude. Variances in perceived risk attitude are viewed to be the result of differences in the perception of risks and benefits between a decision maker and an outside observer. For instance, in the management field, managers have less optimistic perceptions of risk than entrepreneurs (Cooper et al., Reference Cooper, Woo and Dunkelberg1988). The risk-return framework shows that a person's perception of risk affects the choices that person will make.
In order to assess risk perceptions and attitudes within different domains, the DOSPERT test and related scale were created (Weber et al., Reference Weber, Blais and Betz2002). Six independent domains were identified, including the ethical, investment, gambling, health/safety, recreational, and social domains within which the majority of day-to-day activities can be categorized. The DOSPERT test is seeing widespread adoption in psychology. The E-DOSPERT test (Van Bossuyt et al., Reference Van Bossuyt, Carvalho, Dong and Tumer2011) was proposed recently as a method for determining engineering-specific risk attitudes as defined by four engineering risk domains, including risk identification, analysis, evaluation, and treatment (Standards Australia New Zealand, 2009). The E-DOSPERT scale has been shown to reliably measure general engineering risk aversion and risk-seeking attitudes. It can also measure risk-seeking and risk-aversion attitudes in the risk-identification and risk-treatment domains. Additional research is underway in order to fully measure the four engineering risk domains. The DOSPERT and E-DOSPERT tests provide evidence of the need for a method to make risk decisions based on tolerant or averse risk appetites.
2.4. DBD
To address the growing recognition within the industry and engineering research community (Shah & Wright, Reference Shah and Wright2000; Wassenaar & Chen, Reference Wassenaar and Chen2003; Dong & Wood, Reference Dong and Wood2004; Lewis, Chen, & Schmidt, Reference Lewis, Chen and Schmidt2006) that decision making is a fundamental part of the design process, the DBD framework was developed. A decision-theoretic methodology is utilized to select preferred product design alternatives and set target product performance levels. A single selection criterion, V, in the DBD implementation represents the economic benefit to the enterprise (Wassenaar & Chen, Reference Wassenaar and Chen2003). This approach avoids the difficulties of weighting factors and multiobjective optimization, which can violate Arrow's impossibility theorem (Hazelrigg, Reference Hazelrigg1996). A utility function, U, which expresses the value of a designed artifact to the enterprise when considering the decision maker's risk attitude, is created as a function of the selection criterion, V. A preferred concept and attribute targets are selected through the maximization of enterprise utility.
In order to effectively use the single-criterion approach to DBD, the selected criterion must be able to capture all of the issues involved in the engineering design such as system features, costs, risks, physical restrictions, and regulatory requirements. The single criterion should allow both the interests of the users and producers of the system to be considered. In most industrial cases, the most universal unit of exchange is money. Material, energy, information, faults, and time can all be assigned a monetary value. This can be seen in many design decision-making processes and is practiced widely in industry.
One use of single-criterion DBD developed by Hoyle et al. (Reference Hoyle, Tumer, Mehr and Chen2009) employs profit as the criterion in a method to determine optimum system configuration for integrated systems health management. The determination of system profit is made from the product of system availability and revenue, minus the summation of cost of system risks, and the cost of fault detection. This method can determine optimal integrated systems health management while also determining the optimum detection/false alarm threshold and inspection interval. Using the method has been found to increase profit by 11%, decrease cost by a factor of 2.4, and increase inspection intervals by a factor of 1.5 (Hoyle et al., Reference Hoyle, Tumer, Mehr and Chen2009).
2.5. Risk-based utility theory
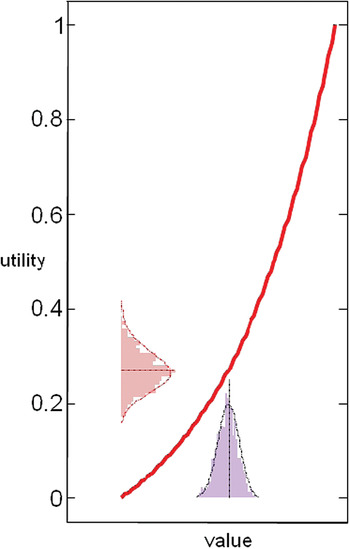
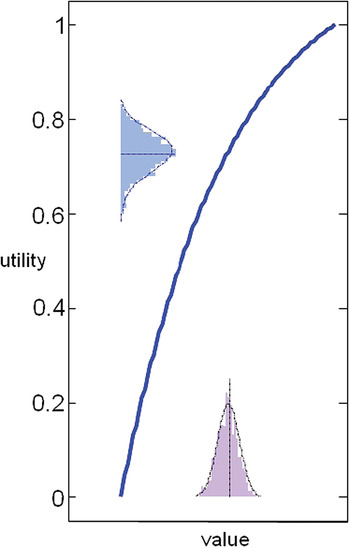
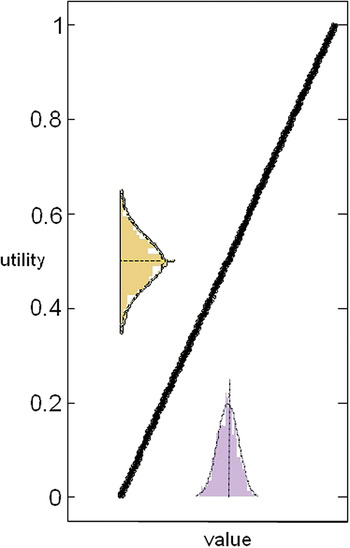
One approach to analyzing choice outcomes from a nonneutral EV perspective is to use risk-based utility theory (Kahneman & Tversky, Reference Kahneman and Tversky1979). The utility of a range of probabilistic outcomes can be determined in order to aid decision makers. This is done by translating monetary outcomes to utilities. A risk-tolerant decision maker's higher intrinsic value for riskier decisions skews the utility of those decisions higher than a risk-neutral or risk-averse decision maker's utility of the same decisions. Figure 2 shows that for a normal distribution of outcomes, a risk-tolerant person's utility distribution will shift to be more heavily skewed toward higher-value outcomes. Utility distributions for risk-averse individuals will skew more heavily toward lower-value outcomes, as can be seen in Figure 3. The risk neutral state, shown in Figure 4, does not weight outcomes in either direction along the utility axis. As can be seen in Figures 2 through 4, different utilities are found based upon a decision maker's risk appetite.
Risk-tolerant utility function. [A color version of this figure can be viewed online at http://journals.cambridge.org/aie]

Risk-averse utility function. [A color version of this figure can be viewed online at http://journals.cambridge.org/aie]

Risk-neutral utility function. [A color version of this figure can be viewed online at http://journals.cambridge.org/aie]

Currently accepted methods of developing utility risk functions, such as those in Figures 2 through 4, require a series of lotteries to be conducted (Kahneman & Tversky, Reference Kahneman and Tversky1979). Several sets of paired choices are presented sequentially to an individual. These are often presented as lotteries in which a participant selects amongst paired probabilistic alternatives. A utility-risk function is then fitted to the lottery results. Common functions include quadratic, logarithmic, and exponential functions (Keeney & Raiffa, Reference Keeney and Raiffa1993). In currently accepted methods of risk utility function generation, the choice of which form a risk utility function should take is at the discretion of the decision maker and based upon results of lotteries. The scale of the value axis of the utility function is set to the minimum and maximum limits of the values used to conduct the lotteries.
Developing and conducting lotteries is time consuming and not intuitive to end users (Pennings & Smidts, Reference Pennings and Smidts2000). In addition, the utility functions derived from lotteries are only valid for the range of values used in the lottery. Therefore, although useful in many areas, lottery-based methods of utility risk function generation are not always useful. Pennings and Smidts (Reference Pennings and Smidts2000) investigated using psychometric risk-attitude test results to create risk functions for Dutch hog farmers to predict individual farmer behavior in hog futures' markets. The results of the research found lotteries to be the most accurate method of predicting behavior in the context of the hog futures' market. However, the hog farmers' self-reported behavior predictions were most closely correlated with the psychometric risk-attitude test results. The farmers also indicated that the psychometric risk-attitude test was more understandable than the lottery method.
In this article, the authors postulate that, although lottery methods of utility risk function generation are satisfactory for many DBD situations, they are not as useful for early-phase conceptual design. Lottery-based risk functions are only valid over the range of values used in the initial lotteries. In the case of early-phase conceptual design, the range of values might not be fully known or could change during the design process. Rerunning lotteries to create expanded risk functions would quickly become burdensome to the practitioner. Further, in cases where utility risk functions are developed based upon client or customer risk appetites, conducting multiple lottery sessions is impractical. Finally, as hinted at in Pennings and Smidts' (Reference Pennings and Smidts2000) research, lotteries do not closely match what individuals believe they will do. However, the actions of individuals more closely align with the predictions of lottery methods than with self-reported methods. This can be interpreted as a disconnect between what individuals aspire to do and what they actually do. Utility risk functions generated by alternative methods could potentially provide new insights for practitioners that will allow decisions to be made based upon aspirations rather than upon past performance, as is the case with lotteries.
In summary, several methods exist and are in use in the risk-based design approach to determine engineering risk, manage identified risks, and make decisions based upon that risk. However, these methods approach risk from an EV choice perspective in which decision makers and stakeholders are expected to be risk neutral. Utility functions, which account for risk attitude, have been used in the DBD framework; however, these functions have generally been developed for consumer products, where there is a trade-off between product features, price, and demand, not risk-based design applications. Although utility risk functions can be useful for risk-based design applications, they are not satisfactory for early-phase conceptual design problems. As has been shown with the DOSPERT and E-DOSPERT tests, people can be risk-averse, neutral, or tolerant. Therefore, a method is needed that can support decision making for different risk appetites within the risk-based design paradigm. Psychometric risk attitude test-generated utility risk functions hold promise for use in early-phase conceptual system design.
3. METHODOLOGY
Risk-based design methods are used to make decisions about risk in system design. Risk analysis tools such as FMEA and FTA are commonly used to evaluate system safety and reduce the likelihood of failure. The risk-based design methods take an EV approach toward all engineering risk domains. However, design stakeholders often have domain-specific risk attitudes that are not risk neutral. The authors propose a new method to determine the true value of risk decisions using utility theory and the E-DOSPERT risk appetite research. This method translates engineering risk method data into utility functions, the line along which a value can be translated into a utility on a two-dimensional plot, using the single-criterion DBD approach.
To show how risk appetite can be ignored in standard utility calculations, the risks in Equations 1 and 2 are equal in the context of risk-based design. In Equation 1 a 1% chance exists that a risk costing $10,000 to return the system to a nominal operating state will occur, whereas in Equation 2 there is a 0.1% chance of realizing a risk that costs $100,000 in order to return the system to a nominal state. Equation 2 represents a case in which additional system complexity has been added to the base design of Equation 1, which has lowered the probability of losing system functionality but has increased the repair cost in the event of a fault. Both risks have an EV of –$100. Therefore, a decision maker using risk-based design would have no guidance in choosing between the two designs. The designs are of equal value using the EV approach.
 $$R_{1}=0.99\lpar 0\rpar +0.01\lpar - \$ 10\comma 000\rpar = - \$ 100\comma$$
 $$R_{2}=0.999\lpar 0\rpar +0.001\lpar -\$ 100\comma 000\rpar =-\$ 100.$$
In contrast, taking into account a risk appetite can change the resulting valuation. Risk-based design instructs decision makers that the choice between the risk in Equation 1 and the risk in Equation 2 does not matter because both outcomes have the same EV. However, a risk-averse decision maker will choose the design in Equation 2 in order to have more certainty about the likelihood of occurrence of the risk. A risk-tolerant decision maker is not as concerned with certainty and will choose the design in Equation 1 due to the lower financial consequence. The example in Equations 1 and 2 has a clear choice outcome for risk-averse and risk-tolerant decision makers.
Equations 1 and 2 are of the form R n = B + A m + A m+1 + ⋯ + A m+x, where B is the probability of benefit × outcome of benefit and A m+x is the probability of riskm+x × outcome of riskm+x. The benefit and risk probabilities all total 100%. This research is only interested in risks and their costs. Therefore all benefits are considered to be identical between risk choices, namely, the full system benefit is realized when the system is not in a fault state and is equal among all design variants. For the purposes of this article, the outcome of the benefit is taken to always be 0.
Although the example in Equations 1 and 2 has a clear choice outcome for risk-averse and risk-tolerant decision makers, the design choice presented in Equations 3 and 4 is less clear for decision makers that are not risk neutral. Rationalizing choosing the design characterized by Equation 3 is impossible under risk-based design. However, the risk-tolerant decision maker might still choose the design with a larger negative EV because she is more concerned with the lower financial consequence than the certainty of the outcome.
 $$R_{1}=0.99\lpar 0\rpar +0.01\lpar -\$ 15\comma 000\rpar =-\$ 150\comma \;$$
 $$R_{2}=0.999\lpar 0\rpar +0.001\lpar \!\!-\!\$ 100\comma 000\rpar =-\$ 100.$$
The risk-tolerant decision maker's higher intrinsic value for the riskier decision in this example can be examined through the lens of utility theory. Figures 2, 3, and 4 demonstrate how risk attitude can affect the utility of a value distribution. Figure 2 shows that for a normal distribution of outcomes, a risk-tolerant person's utility distribution will shift to be more heavily skewed toward higher value outcomes. Utility distributions for risk-averse individuals will skew more heavily toward lower value outcomes, as can be seen in Figure 3. The risk-neutral state, shown in Figure 4, does not weight outcomes in either direction along the utility axis.
Utility functions derived from discrete outcome distributions can also be affected by risk attitudes. The utility for a system feature with two potential discrete outcomes takes the form of Equation 5 where u(s) represents the system utility, p 0 is the probability of the first outcome, u(x H) is the utility of the first outcome, (1 – p 0) is the probability of the second outcome, and u(x L) is the utility of the second outcome.
 $$u\lpar s\rpar =p_{0}\times u\lpar x_{\rm H}\rpar +\lpar 1 - p_{0}\rpar \times u\lpar x_{\rm L}\rpar.$$
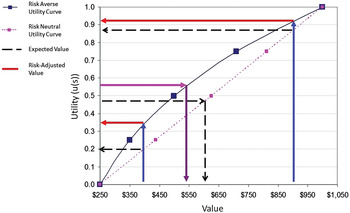
To explicitly show how taking risk appetite into account can change resulting valuation, a generic utility problem where risk is represented as a dollar figure is shown in Equation 6. Figure 5 was developed via a series of lotteries in which the minimum value is $250 and maximum is $1,050; it provides a risk-averse quadratic utility function. As was discussed in Section 2.5, although lottery-generated risk functions are appropriate for many situations, the authors postulate that they are not appropriate for early-phase conceptual complex system design.
 $$u\lpar s\rpar =0.4\times u\lpar \$ 900\rpar +0.6\times u\lpar \$ 400\rpar.$$
Risk-averse quadratic utility function developed using the lottery method. The value of the potential outcomes is translated via the risk averse risk function to the utility domain. The two utilities are then combined using the generic Equation 5, as applied in Equation 7, and translated back through the risk averse function to find the risk-adjusted value of $540. A value of $600 is found using the risk neutral utility function. [A color version of this figure can be viewed online at http://journals.cambridge.org/aie]

Determining the utility of each potential outcome is demonstrated in Equation 7, in which the utility of $900 is found to be 0.91 via inspection of the utility function, as shown in Figure 5, and the utility of $400 is found to be 0.35 from the risk utility function as demonstrated in Figure 5. These utilities are then multiplied by their respective probabilities and summed together to find the overall system utility, u(s) = 0.57, for a risk-averse decision maker. Reversing the procedure, a utility of 0.57 produces a risk-adjusted value of u −1 = $540, whereas a neutral utility function results in a risk-adjusted value of u −1 = $600. This clearly shows that using a risk appetite function in a utility function results in a different valuation of the system than would be found without using a risk appetite function.
 $$u\lpar s\rpar =0.4\times \lpar 0.91\rpar +0.6\times \lpar 0.35\rpar =0.57.$$
As previously discussed, although risk functions generated using lottery methods are useful in many situations, early-phase conceptual design can benefit from an alternative method. The authors propose using risk functions generated from E-DOSPERT test results. Based upon the findings of Van Bossuyt et al. (Reference Van Bossuyt, Carvalho, Dong and Tumer2011), the 25-question E-DOSPERT test provides sufficient statistical reliability to determine general engineering risk tolerance or risk aversion. The mean of the 25-question instrument is proposed by the authors to be the most appropriate metric for use with risk function development. The E-DOSPERT makes use of a 5-point Likert scale, with 1 corresponding to very unlikely and 5 corresponding to very likely. A score of 3 corresponds to the neutral answer of not sure. Using the 25 risk-tolerant questions in the E-DOSPERT test, a mean score of 3 indicates a neutral risk appetite, a mean score of 5 indicates extreme risk tolerance, and a mean score of 1 indicates an extremely averse risk appetite. An individual engineer, customer, or stakeholder's E-DOSPERT test result is used to generate utility functions. Note that multiple E-DOSPERT test results cannot be combined due to Arrow's impossibility theorem (Arrow, Reference Arrow1950).
In this research, the authors suggest that an exponential function is an appropriate utility risk function to use with psychometric risk scale test results. The function may be either of the monotonically increasing or decreasing exponential type (Kirkwood, Reference Kirkwood1997). An exponential function was chosen over other potential functions because it is believed that practitioners will be either constantly risk averse or risk tolerant during the early phases of conceptual system design. In one study where a risk survey was compared to the lottery method, it was found that risk functions generated by the lottery method were exponential in nature. Moreover, there was reasonable correlation between the risk survey results and lottery method results (Pennings & Smidts, Reference Pennings and Smidts2000). Research is ongoing in this area to verify that this holds true for the E-DOSPERT.
The choice of an exponential function also allows the direct use of E-DOSPERT test results in the creation of a risk function (Keeney & Raiffa, Reference Keeney and Raiffa1993). The monotonically decreasing exponential utility function developed by Kirkwood (Reference Kirkwood1997) that is shown in Equation 8 is used throughout the rest of this article. Here, U(V) represents utility of the potential value(s) and CE(V) represents the risk-adjusted value of the potential values of interest, otherwise known as the certainty equivalent. The maximum possible value is V max. Note that V max need not be the maximum value of the range of potential values of interest, but can be a larger number than the maximum potential value of interest. This property is useful in situations in which a larger maximum value is possible than the set of potential values currently being investigated or when multiple sets of potential values, representing multiple sets of outcomes of a decision choice, span different numerical ranges. Likewise, V min is the minimum possible value, which need only be smaller than or equal to the smallest potential value of interest. Note that V min can either be a positive or negative number. The risk-tolerance/aversion coefficient of the utility function is R T/A. In order to convert an E-DOSPERT mean score (EDSmean) to an R T/A value, Equation 9 was developed by the authors based upon the work of Kirkwood (Reference Kirkwood1997), Howard (Reference Howard1988), and McNamee and Celona (Reference McNamee and Celona1990). In Equation 9, R SF is a scaling factor. Several different rules of thumb based upon financial measures are available to determine R SF, such as finding a sufficient R SF that R T/A will be roughly 6% of net sales, a 100%–150% of net income, and about one-sixth of equity (Howard, Reference Howard1988). These rules of thumb have been found useful in the oil and chemical industries (Howard, Reference Howard1988). Additional suggestions are given by Kirkwood (Reference Kirkwood1997) and McNamee and Celona (Reference McNamee and Celona1990). It is important that the practitioner select an R SF that is appropriate to their industry, company, and the specific analysis being performed. It is beyond the scope of this article to provide strict guidance on domain and situation-appropriate R SF values. It is also beyond the scope of this article to judge if the practitioner's level of expertise can influence the selection of appropriate rules of thumb. For the examples and illustrations presented in this article, R SF = 60 will be used to demonstrate the new method for determining the true value of risk decisions using utility theory and the E-DOSPERT test.
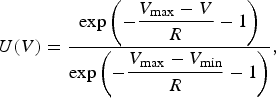 $$U\lpar V\rpar = {\exp\displaystyle\left(-{{ V_{\max} - V \over R} - 1}\right) \over \exp\displaystyle\left(-{{ V_{\max} - V_{\min} \over R} - 1}\right)}\comma \;$$
 $$R_{\rm T/A} = {V_{\max} - V_{\min} \over 1000} \times {R_{{\rm SF}} \over \hbox{EDS}_{\rm mean} - 3}.$$
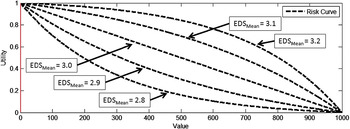
The inverse of Equation 8, shown in Equation 10, is used to calculate the certainty equivalent. In the special case of an E-DOSPERT test result, in which the test taker is found to have a perfectly risk-neutral risk appetite, Equations 11 and 12 are used to generate the risk function and find the risk-adjusted value of the potential values. Examples of monotonically increasing exponential utility functions can be found in Kirkwood (Reference Kirkwood1997). Other risk utility functions of potential interest to the practitioner are available in Keeney and Raiffa (Reference Keeney and Raiffa1993). A series of risk functions generated in MATLAB using Equation 8 from E-DOSPERT mean scores of EDSmean = 2.8, 2.9, 3.0, 3.1, 3.2, V max = 1000, V max = 0, and R SF = 60 is shown in Figure 6.
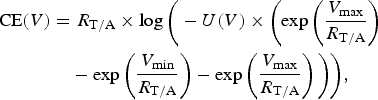 $$\eqalignno{\hbox{CE} \lpar V\rpar & =R_{\rm T/A} \times \log \bigg( - U\lpar V\rpar \times \left( \exp\left({{V_{\max} \over R_{\rm T/A}}}\right) \right.\cr & \quad - \exp\left({{V_{\min} \over R_{\rm T/A}}}\right) - \exp\left({{V_{\max} \over R_{\rm T/A}}}\right) \bigg)\bigg) \comma \;}$$
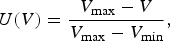 $$U\lpar V\rpar = {V_{\max} - V \over V_{\max} - V_{\min}} \comma \;$$
 $$\hbox{CE}\lpar V\rpar = U\lpar V\rpar \times \lpar V_{\min} - V_{\max} \rpar + V_{\max}.$$
Monotonically decreasing exponential risk utility functions developed using Equation 8, where EDSmean = 2.8, 2.9, 3.0, 3.1, and 3.2; R SF = 60; V max = 1000; and V min = 0. [A color version of this figure can be viewed online at http://journals.cambridge.org/aie]

In order for engineering risk methods to make use of risk appetite functions in utility theory, risk metrics generated by the various engineering risk methods must be translated into an easily comparable unit of measure. The authors advocate using consequential cost as it is a convenient and easily understood unit of measure. Therefore, in order to use this risk appetite utility method, both consequential cost and probability must be determinable for the risks identified by engineering risk methods. Standard engineering tools used in the design process often contain the necessary risk information, but require translation into the appropriate probability and cost metrics. For example, translating risk information from an FMEA into probability and consequential cost is relatively straightforward. Probability can be derived from the occurrence metric. In the case of a purely linear occurrence metric scale, the percentage chance of failure can be found by multiplying occurrence, Occ, by an appropriate factor, Oc f. When the occurrence scale is not linear, an appropriate function can be used to translate the occurrence metric into a probability value. In the case of a linear occurrence metric scale, Ocf should be determined by dividing 100 by the result of subtracting the low (Occmin) end of the occurrence metric scale from the high (Occmax) of the scale, as shown in Equation 13. Probability, P 0, can then be determined by Equation 14 where P 1 → n represents the complete set of probabilities under consideration.
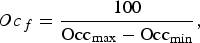 $$Oc_{\,f}=\displaystyle{{100} \over {{\rm Occ}_{\max} - {\rm Occ}_{\min} }}\comma \;$$
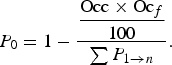 $$P_{0}=1 - \displaystyle{{\displaystyle{{{\rm Occ}\times {\rm Oc}_{f} } \over {100}}} \over {\sum P_{1 \rightarrow n} }}.$$
Consequential cost, representing value, can be determined in a variety of manners. The authors suggest that consequential cost should be determined by the cost to return the system to a nominal state if the risk occurs. In the event that consequential cost cannot be directly determined, a summation of the severity and detection metrics can be used as an analogue metric to consequential cost.
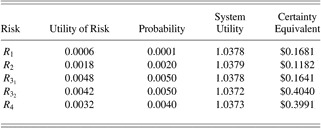
Table 1 provides a simplified FMEA for a complex system design with three identified risks and the consequential cost of each risk. Decision maker A has been tasked with deciding which risk is the most important to fix. Decision maker A has a risk-averse appetite where EDSmean = 2.88. The generalized form of Equation 5 is used in this example by setting p 0 equal to Equation 14 where Occmax = 10, Occmin = 0, Oc f = 0.1, X high = 0, X low = V(R n), V min = $250, V max = $1,050, and R SF = 20. Using a risk-averse utility function generated from Equation 8 and Equation 5, the risk-averse decision maker A discovers that the most desirable certainty equivalent choice is CE(R 1) = $0.8909, whereas CE(R 2) = $1.1292 CE(R 2) = $1.1292, and CE(R 3) = $2.9184. Therefore, the risk-averse decision is to mitigate the R 1 risk as it has the lowest certainty equivalent value.
Simplified failure mode and effects analysis example for decision-maker A

Note: RPN, risk priority numbers.
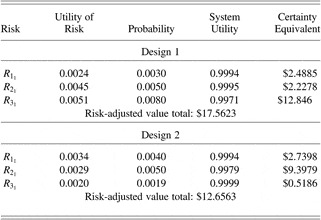
This method can also be used to compare between different designs. For instance, using Table 1 as design 1 and Table 2 as design 2, a risk-tolerant person, decision maker B, with an E-DOSPERT mean score of EDSmean = 3.15, can determine which design is more preferred. Using the monotonically decreasing exponential risk function of Equation 8 with V max = $1,000, V min = $0, Occmax = 10, Occmin = 0, Oc f = 0.1, R SF = 60, X high = 0, and X low = V(R n), the utilities of risks, probabilities, system utilities, and risk-adjusted values are found as shown in Table 3. Equation 15 is then used to find the overall certainty equivalents (CE) of the two designs where CEn(R n) is the risk-adjusted value of the individual identified risk, R n. Each of the risks identified in the FMEA presented in Tables 1 and 2 is an independent risk, and thus the total risk is simply the sum of the individual risks. Equation 15 is used rather than Equation 10 because each of the risks identified in the FMEA presented in Tables 1 and 2 is an independent risk. Applying Equations 8 and 15 shows that the risk-tolerant decision maker B with an EDSmean = 3.15 would choose design 1 as it has the smallest certainty equivalent. Decision maker C who has an EV risk neutral decision making criteria would find design 1 to have CE = $8.05 and design 2 to have CE = $5.5000, and therefore would choose design 2 because it has a lower certainty equivalent than design 1.
 $${\rm CE}\lpar R_{{\rm total}}\rpar ={\rm CE}_{1}\lpar R_{1}\rpar +\cdots +{\rm CE}_{n}\lpar R_{n}\rpar.$$
Simplified failure mode and effects analysis for design 2 for decision-maker B

Note: RPN, risk priority numbers.
Utility of risk, probability, and risk-adjusted value data for design 1 and design 2 risks for decision-maker B

4. IMPLEMENTATION AND TESTING
An illustrative case study is developed in the following section. The SuperNova/Acceleration Probe (SNAP) mission trade study (Gerber, Reference Gerber2002) performed by Team-X provides the bulk of the background information necessary for this case study. Additional material comes from the Space Mission Analysis and Design book by Wertz and Larson (Reference Wertz and Larson1999). Costing and risk data are simulated for illustrative purposes only and should not be used beyond this case study. The SNAP mission's purpose is inconsequential in the demonstration of the method presented in this article. Further information on the SNAP mission can be found in Gerber (Reference Gerber2002) for those interested.
The SNAP mission was intended to investigate the nature and origin of “dark energy” acceleration and expansion of the universe. The experiment was designed to precisely measure the history of the universe's expansion from the present day back to approximately 10 billion years in the past. Plans called for a satellite in a high earth orbit on a 4-year mission to study the brightness of la-type supernovae and the redshift of la-type supernova host galaxies (Gerber, Reference Gerber2002).
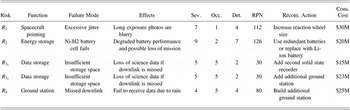
Several risks were identified in the SNAP mission report. This article makes use of and expands upon potential risks in the power and attitude control subsystems. Table 4 details several risks that will be used in the remainder of this article.
Simplified case study failure mode and effects analysis of SuperNova/Acceleration Probe power and attitude control subsystems

Note: RPN, risk priority numbers.
During the course of the CDC trade study session, the risks outlined in Table 4 were identified. Risks R 1 and R 2 are potential threats to mission success. Risks R 31–2 and R 4 are threats to the level of science data that can be returned from the spacecraft but will not end the mission completely. The R 31 and R 32 risks identify the same risk and propose two different solutions, and R 32 also presents the same solution as the solution for R 4.
In order for the SNAP mission proposal to be considered for further development funding, it must meet a specific cost cap. In this fictitious example, the mission proposal is $40 million away from reaching the cost cap. Not all of the identified risks can be mitigated under this cost cap. Based upon the risk priority numbers of the four identified risks, R 2 should be addressed first. However, this would not leave enough funds to address R 1, the next largest risk. In addition, the customer believes that severity of R 1 is overstated and wants to take a more risk-tolerant stance on R 1 while addressing some of the science data concerns of R 3 and R 4 within the limited resources available.
To help make risk mitigation decisions, the customer, represented by a single person, was given the E-DOSPERT test. The result, EDSmean = 3.17, was used with the monotonically decreasing exponential risk utility function in Equation 8 where V max = $120M, V min = $0, X H = 0, X L = V(R n), Occmax = 10, Occmin = 0, Oc f = 0.1, and R SF = 60. The consequential cost was used as potential outcome values whereas the occurrence values were used to determine probability of occurrence. Table 5 shows the resulting probability, and utility data. From this data, decision makers can see that risks R 2 and R 31 are the most preferred under a risk-tolerant decision process and will cost less than $40M. A risk-neutral approach would have chosen risks R 1 and R 2. The two most preferred risks to mitigate also satisfy some of the questions surrounding mission success and science data return.
Probability and risk utility data for identified risks in the SuperNova/Acceleration Probe mission

Note: The certainty equivalent is derived using the customer's Engineering Domain-Specific Risk-Taking mean score.
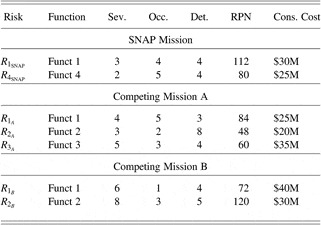
After a mission has been conceptually developed within Team-X, it is often placed into competition with other competing conceptual spacecraft mission designs for further funding. In this case study, the SNAP mission was put into competition against two other missions for funding after mitigating the risks identified above. Table 6 summarizes the relevant SNAP risk data and risk data for the other competing mission concepts. It is assumed that each mission has already mitigated as many risks as was possible under the budget cap.
Simplified study failure mode and effects analysis for the SuperNova/Acceleration Probe mission and other competing missions

Note: RPN, risk priority numbers; SNAP, SuperNova/Acceleration Probe.
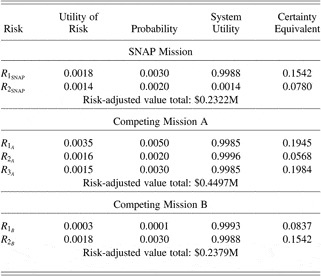
The decision maker who will choose which mission concept is awarded funding to continue development has decided to use a monotonically decreasing exponential risk utility function as shown in Equation 8 where V max = $60M, V min = $0, X H = 0, X L = V(R n), Occmax = 10, Occmin = 0, Oc f = 10, and R SF = 20. The decision maker's E-DOSPERT test result is EDS = 3.10, making her risk tolerant. Equation 10 is used to determine the CE of each design. Table 7 shows the utility, probability, and certainty equivalent.
Utility and probability data for design 1 and design 2 risks

Note: SNAP, SuperNova/Acceleration Probe.
By using the risk appetite utility function method, the decision makers see that the SNAP mission is the most preferred design in the case of risk tolerance. Assuming all other mission selection criteria are equal, therefore, the SNAP mission would be the preferred mission to receive continued funding. This selection would not have been made under a risk-neutral, EV decision-making process; under that process, the decision makers instead would have chosen Competing Mission A due to the lower certainty equivalent. In the case of a neutral risk appetite, CE(SNAP) = $0.1400, CE(MissionA) = $0.2700, and CE(MissionB) = $0.1300. A similar process to this would then be repeated at the next level of mission selection after further mission concept development.
5. CONCLUSION AND FUTURE WORK
As seen in the case study, the risk appetite utility function method allows engineering risk methods, which are in the EV domain to be translated into an appropriate risk appetite domain for a specific enterprise or decision maker. Viewing the risk information through the lens of risk appetite provides a decision maker with a new, numerically based approach to select and justify selection of the most important risks to address under constrained resources. Rather than using “gut feeling” to try and explain risk decisions, this method gives stakeholders a way to rationalize their risk-based decisions.
Several limitations are present in the method. This method is only designed for individual stakeholders or enterprise-level usage where one consistent risk appetite function can be generated. Additional methods, such as the Accord decision support software package (Ullman, Reference Ullman2009), could be useful in combining the inputs of multiple stakeholders into a unified risk appetite utility function.
Further expansion of this methodology will examine the benefit side of Equation 5, which can add an expected benefit if the risk outcome is not realized. This area of research could be especially fruitful for comparing multiple risks against one another for risk-tolerant enterprises. Large risks can have associated large benefits. This method does not currently account for the potential large return for taking a large risk.
Adding a post risk-realization cost to return the system to a nominal state is a promising area of future development for this method. Seven potential options for returning the system to a nominal state exist including repair, reconfiguration, replacement, redundancy, reconditioning, recovery, and resetting. Depending upon which option is chosen to return a system to its nominal state, the portion of Equation 5 that represents the beneficial outcome could change. This research only focuses upon the portion of Equation 5 that examines the costs of a risk. In addition, future risk realizations could be limited from the initial risk event due to the option chosen to return the system to a nominal state. The definition of a nominal system state also could change to some form of a reduced system capacity but a capacity that still provides some value to the enterprise. This is exemplified with subsystems failures on satellites such as the failure of the high gain antenna and the tape recorder remote repair on the Galileo spacecraft (Bindschadler, Theilig, Schimmels, & Vandermey, Reference Bindschadler, Theilig, Schimmels and Vandermey2003).
Testing of this method should be conducted to determine user satisfaction levels between utility risk functions generated with lottery methods and with E-DOSPERT test results. For instance, surveys of user groups such as those conducted in (Van Bossuyt & Tumer, Reference Van Bossuyt and Tumer2010) could be conducted. Choice determinations made with the help of risk functions generated from the E-DOSPERT test could be compared against choices made by individual respondents on risk decisions where a risk-averse person would decide differently than a risk-tolerant person. This would verify that risk appetite affects engineering risk decisions. The same population of respondents would also be provided data from the risk appetite utility function method using risk functions generated with lotteries to make risk decisions. In future work, this method will be tested and verified at Boeing in the Commercial Airplane Division with production-level design engineers who work in or with a Team-X-like setting or equivalent under the auspices of a National Science Foundation grant. This will include further testing and exploration of the creation of the scaling factor, R SF with the intent of developing rules of thumb specific to the aerospace industry. Research is ongoing to investigate “gaming” the E-DOSPERT test, which could adversely impact the method presented in this article.
The risk appetite utility function method presented in this article translates engineering risk data from the EV domain into a risk appetite corrected domain using risk functions derived from E-DOSPERT test results using a single-criterion decision based design approach. The resulting utility functions are aspirational in nature, which is a departure from the predictive utility functions created using lottery methods. The method presented in this article allows decisions to be made under risk-tolerant or risk-averse decision-making conditions rather than forcing decisions to be made using an EV approach, as with engineering risk methods. Risk-averse industries (e.g., nuclear power and aerospace) will choose to view risk data through a risk-averse lens, which emphasizes risks that are more certain. Risk-tolerant enterprises could have the appetite to accept riskier design choices that might result in larger payoffs if the risks are not realized.
The method has been shown to change risk-based decisions in certain situations where a risk-averse or risk-tolerant decision maker would likely choose differently than the EV approach suggests. As the E-DOSPERT test is further refined, the risk appetite utility function method could be more useful. Extensions of the method to examining the benefit side of the risk utility equation will provide further benefit to the practitioner. The risk appetite utility function method is a promising area of further research and practical application.
ACKNOWLEDGMENTS
This research was funded in part by the National Science Foundation (CMMI 1030060). The opinions, findings, conclusions, and recommendations expressed are those of the authors and do not necessarily reflect the views of the sponsors. Special thanks go to Jacob Postman and Zach Bailey for their MATLAB assistance.
Douglas Van Bossuyt was a Researcher in the Complex Engineered System Design Laboratory at Oregon State University, where he completed his PhD in mechanical engineering. His research focuses on addressing risk in the conceptual phase of design of complex systems, understanding the risk attitudes of engineering professionals, and developing formal methodologies to make risk-informed decisions.
Irem Y. Tumer is an Associate Professor at Oregon State University, where she leads the Complex Engineered System Design Laboratory. She received her PhD in mechanical engineering from the University of Texas at Austin in 1998. Since moving to Oregon State University in 2006, her funding has largely been through the National Science Foundation, Air Force Office of Scientific Research, Defense Advanced Research Projects Agency, and NASA. Prior to her move to Oregon State University, Dr. Tumer led the Complex Systems Design and Engineering group in the Intelligent Systems Division at NASA Ames Research Center, where she worked from 1998 through 2006 as research scientist, group lead, and program manager. Her research focuses on the overall problem of designing highly complex and integrated engineering systems with reduced risk of failures and developing formal methodologies and approaches for complex system design and analysis.
Chris Hoyle received a PhD from Northwestern University in mechanical engineering and an MS in mechanical engineering from Purdue University. He was previously a design engineer and an engineering manager at Motorola, Inc. for 10 years before enrolling in the PhD program at Northwestern University. His research interests are focused upon decision making in engineering design, with emphasis on the early design phase when uncertainty is high and the potential design space is large. His research contributions are to the field of DBD, specifically in linking consumer preferences and enterprise-level objectives with the engineering design process.
Andy Dong is the Warren Centre Chair in Engineering Innovation in the Faculty of Engineering and Information Technologies at the University of Sydney. His research is in design-led innovation, where he has made significant methodological contributions in explaining the dynamic formation of design knowledge. He received the Design Studies Prize in 2005 for the most significant journal article in the field for his work in the context of creative teams. He is currently an Australian Research Council Future Fellow working on predictive analytics to forecast rates of potential progress of engineered products based on their underlying knowledge structure.