




No CrossRef data available.
Article contents
Age-dependent survival and infectivity of Schistosoma mansoni cercariae
Published online by Cambridge University Press: 09 October 2003
Abstract
The age dependency of the mortality, spontaneous de-tailing and infectivity of cercariae of Schistosoma mansoni has been determined at 25 °C. Infectivity was assessed with respect to stratum corneum-like differentiated human keratinocyte cultures (validated by comparison with fresh human skin samples) and displayed a complex age-dependent pattern. From 1 to 9 h post-emergence cercariae showed a plateau of maximal infectivity (around 90% attachment). Thereafter, infectivity declined. Immediately after release, infectivity at around 60% was significantly lower than the plateau values and this could be an adaptation for spatial dispersal of cercariae. Age-dependent patterns of cercarial mortality and spontaneous de-tailing closely mirrored the infectivity pattern except in relation to the low initial infectivity value. These findings suggest that, at a population level, the age-dependent decline in cercarial infectivity towards human skin is essentially driven by cercarial mortality. The recently described phenomenon of delayed tail loss (DTL) in S. mansoni cercariae infecting human skin is confirmed in the present study. For cercariae aged up to 13·5 h post-emergence, 90% or more of invading cercariae took their tails with them into the keratinocyte culture. The infection dynamics described in this study suggest that diurnally shed S. mansoni cercariae, with peak emergence around mid-day, will have near maximal infectivity towards humans in contact with water through all remaining daylight hours in the tropics.
Information
- Type
- Research Article
- Information
- Copyright
- 2003 Cambridge University Press
INTRODUCTION
Schistosome cercariae emerge from their molluscan hosts with a circadian rhythm and a finite nutrient reserve of glycogen (Lawson & Wilson, 1980). For cercariae of S. mansoni which infect humans, the rhythm of emergence is diurnal, peaking at midday with no significant emergence at night (Jourdane & Théron, 1987; Wolmarans et al. 2002). As cercariae do not feed, the age-dependent dynamics of cercarial survival and infectivity must both ultimately be driven by the rate of utilization of the glycogen reserve (Anderson & Whitfield, 1975). Quantitative information on the age dependency of cercarial survival and infectivity of S. mansoni would contribute to an explicit understanding of the changing risk of human infection via water contact through any 24-h period.
Detailed information is available on the survival of S. mansoni cercariae. Lawson & Wilson (1980) demonstrated that mortality was temperature dependent with survival curves of reverse sigmoid form and maximal life-spans of around 35, 28 and 21 h at 20, 25 and 30 °C, respectively. Previous work on the age-dependent infectivity of S. mansoni cercariae is, however, of only indirect usefulness in predicting time-related patterns of human infection because it has all been derived from studies with laboratory animal models rather than human skin. Early studies by Stirewalt & Fregeau (1968) with infection through tail skin of mice demonstrated that the post-emergence age of cercariae did influence infectivity. Percentage infectivity (determined by direct counting of unattached cercariae after 1 h exposure) was around 96% at 1 h post-emergence, had dropped to 88% by 8 h and 62% by 24 h. Lawson & Wilson (1983) also examined age-dependent infectivity with respect to the mouse tail infection route. They used 30-min exposures with cercariae aged at 25 °C and showed that the percentage of the total population of cercariae which penetrated (or became irreversibly attached) declined from around 75% 1 h after emergence to less than 5% at 25 h. By monitoring cercarial survival in parallel, they surmised that penetration capacity remained effectively unchanged throughout cercarial lives, with the decline in population infectivity being caused by age-dependent cercarial mortality. Percentage cercarial development to adult maturity in mice did, however, decline with cercarial ageing. Lawson & Wilson (1980) also indicated that while ageing, the glycogen content of both the head and tail of a cercaria declined exponentially, with a more rapid rate of loss in the tail.
We have recently attempted to gain direct insights into S. mansoni cercarial interactions with human skin by a variety of experimental routes. Bartlett et al. (2000) determined the temporal dynamics of cercarial attachment to viable human skin derived from cosmetic surgical sources and held in a Franz cell system. Khammo et al. (2002) extended these findings using a variety of cultured cell types from human skin and showed that initial cercarial attachment/penetration dynamics, with stratum corneum-like cultures of differentiated human keratinocytes, were remarkably similar to those obtained with entire skin. They concluded that differentiated human keratinocyte cultures provided an ideal experimental system for highly replicated studies on determinants of cercarial infectivity towards human skin. The present investigation has used such cultures to find the relationship between the post-emergence age of S. mansoni cercariae and their capacity to infect the human skin surface. To confirm the appropriateness of the cellular model, parallel studies were carried out with fresh human skin of the type from which keratinocytes in the model were obtained. The experiments specifically set out to determine the age-dependency of cercarial infectivity and survival as well as the temporal dynamics of spontaneous and skin-induced tail loss by cercariae. The experimental design also provided information on the fate of cercarial tails during infection. Whitfield et al. (2003) have recently described the phenomenon of delayed tail loss (DTL) in schistosome cercariae during human skin penetration. The present study enabled the variation in this phenomenon with respect to post-emergence cercarial age to be determined.
MATERIALS AND METHODS
Unless otherwise stated all chemicals were obtained from Sigma–Aldrich, UK.
Keratinocyte cultures
All cultures were prepared on Cellogen™ membranes (ICN Biochemicals Inc) made of cross-linked collagen pre-coated with an attachment factor, FNC™. The models were prepared as described by Khammo et al. (2002) with cells derived from adult human foreskin samples and raised to the air/liquid interface 2 weeks before use.
Human skin
Skin was adult human foreskin obtained at routine circumcision, with patient consent under ethical approval.
Parasites
A Puerto Rican strain of S. mansoni, was routinely maintained in Biomphalaria glabrata snails and NMRI strain, female laboratory mice essentially as described by Standen (1949). All water for use with the snails and parasites was filtered through a carbon/resin cartridge (Prosep Filter Systems Ltd, Huddersfield, UK) to remove chlorine and heavy metals.
Age-related cercarial survival
When each aliquot of aged cercarial suspension was used in the following experiments, 4×200 μl samples containing about 40 cercariae were placed in the wells of a 96-well microtitre plate. Each sample was then immediately observed microscopically and the number of cercariae immobile after stimulation was recorded. Swimming cercariae could not be counted accurately so samples were then fixed and stained with Lugol's iodine to determine the total number of cercariae present. Percentage survival could thus be determined.
Cercarial age-related infectivity towards differentiated keratinocytes
Snails with patent infections of 6–8 weeks, were exposed to bright light (100W lamp directly overhead) at a temperature of 28 °C and allowed to shed cercariae into filtered water for 1 h. The suspension of cercariae was then separated from snails and detritus, swirled gently to give an homogenous suspension, then divided into 15 aliquots of approximately 50 ml. These were kept at 25 °C, in dim light until they were used. Division of the whole suspension into aliquots, each of which was used once only, was carried out to minimize mechanical damage to cercariae.
The concentration of cercariae in each aliquot was determined as the mean number present (of whole cercariae, separated heads and detached tails) in 5×500 μl samples taken from an homogenous suspension. Cercariae from the first aliquot were counted then used immediately; at time 0 h (mean age of cercariae=37 min) 500 μl of cercarial suspension were added to the upper surface of cultures of differentiated keratinocytes. After an interval of 5 min, the cercarial suspension was removed from the cell culture and transferred to a counting dish. The keratinocyte surface was rinsed with 500 μl of filtered water which was transferred to the counting dish. The cercariae were then fixed and stained with Lugol's iodine and the numbers of whole cercariae, detached heads, and separated tails present were counted. Five replicate cultures were used and this process was repeated, with the same level of replication, at intervals of 1 or 1·5 h, as shown in Table 1, until the cercariae were more than 16 h old.

Cercarial infectivity towards whole human skin
Adult foreskin samples were washed 3 times in PBS, fatty dermal tissue was excised and the samples were stored at 4 °C in tissue-culture medium L15 overnight. They were then washed twice in PBS and spread flat, epidermis upwards on a sterile Petri dish. The surface was blotted dry and stainless steel rings, 1 ml volume, were placed on the skin and sealed with Vaseline. A 1 ml aliquot of cercarial suspension (3 h post-emergence) of known density was added to each ring. After 5 min the cercarial suspension was removed and processed as described above. Ten replicate rings were used.
Spontaneous age-dependent cercarial de-tailing
Separate counts were made of whole cercariae, detached heads and detached tails for each of the aged cercarial aliquots. It was possible therefore, to determine the percentage of cercariae which had spontaneously lost their tails at known time-intervals post-emergence.
The fate of tails of penetrating cercariae
Separate counts of whole cercariae, heads and tails were made before and after infection experiments with differentiated keratinocytes. It was therefore possible to determine the percentage of tails which were released into the surrounding water as the cercariae penetrated keratinocyte layers. This analysis was used to calculate the percentage of tails taken into the keratinocyte layers by the invading cercariae and the influence of post-emergence age on this phenomenon. Delayed tail loss was calculated by the method previously described by Whitfield et al. (2003).
Statistical analysis
In infection experiments, the number of cercariae attached was expressed as a percentage of the original inoculum. Arcsine transformed percentage values were used for all statistical analyses. Values were compared using one-way ANOVA with a post hoc Tukey test and P values of <0·05 were considered significant.
RESULTS
Age-related cercarial survival
Survival was assessed by recording the number of non-motile cercariae and subtracting this value from the total number present in subsamples from the aged cercarial aliquots. At least 90% of the cercariae present were alive and active up to about 8 h after emergence (Fig. 1). Thereafter there was a gradual increase in the number immobile and presumed dead.
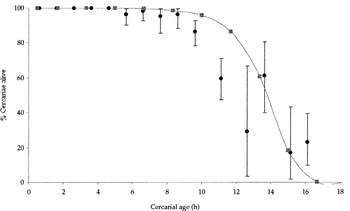
Fig. 1. Age-dependent survival of cercariae at 25 °C. Individual data points represent mean values±S.D. The fitted curve has been calculated using an equation which assumes that the instantaneous death rate of cercariae increases exponentially with time (Anderson & Whitfield, 1975). Instantaneous death rates were calculated from raw survival values through time and a best fit exponential curve generated of the form y=aebt (where y is the instantaneous death rate at time t and a and b are calculated constants). This enabled the estimation of a and b as 3·4×10−7 and 1·2239×10−2 respectively. The fitted survival curve in the figure was then derived from the equation: where Pt is the proportion of cercariae alive at time t.
Cercarial age-related infectivity towards differentiated keratinocytes
The overall infectivity curve was unexpectedly complex (Fig. 2). The mean percentage of cercariae attaching over the first 2 h rose from an initial value of about 60% to a maximum of about 90%. This value was then maintained for a long plateau period of about 8 h before infectivity levels progressively declined, between 10 and 16 h, to values approaching 0%. The low initial infectivity value of cercariae at emergence was found to be significantly different from the subsequent plateau values (for all comparisons P<0·05: Tukey's test).
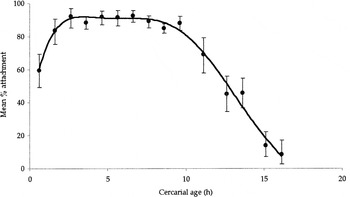
Fig. 2. Age-dependent infectivity of cercariae at 25 °C towards differentiated keratinocytes. Individual data points represent means±S.D. The fitted curve is based on the best fit polynomial equation of the form y=−0·0003x6+0·0151x5−0·3446x4+3·7796x3−21·169x2+31·578 (R=0·9923).
Cercarial infectivity towards whole human skin
Attachment of cercariae to fresh adult foreskin samples was tested at 3 h post-emergence with non-penetrants removed after 5 min contact with the skin. The mean percentage of cercariae attached was 91·2% (S.D.±4·3). Infections of differentiated keratinocytes with cercariae from the same aged aliquot were not significantly different (t=1·0863, D.F.=13, P>0·05), with an attachment percentage of 88·7% (S.D.±3·8).
Spontaneous age-dependent cercarial de-tailing
In preliminary experiments (data not shown) it was demonstrated that sequential sampling of cercariae from a single aliquot through time induced levels of tail separation in excess of spontaneous values. The presumption must be that the disturbance caused by sampling induced some de-tailing. Consequently, the present experiment was designed to minimize and standardize this effect and each aged aliquot was used only once. The age dependency of spontaneous de-tailing is illustrated in Fig. 3. Up to 10 h post-emergence 90% or more of cercariae were intact with tails still attached to heads. Thereafter there was a progressive increase in the proportion of cercariae where separation of tails had occurred. Fig. 4 shows the relationship between levels of spontaneous detailing (expressed inversely as the percentage of intact cercariae) and mean infectivity (expressed as the percentage of cercariae attaching to the keratinocyte target).
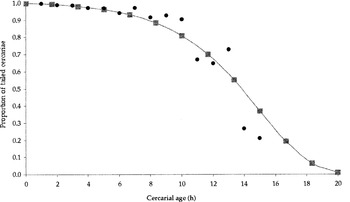
Fig. 3. Age-dependent spontaneous de-tailing of cercariae at 25 °C. The fitted curve has been calculated by assuming that the instantaneous rate of de-tailing can be treated in the same way as age dependent mortality (see Fig. 1). Estimated coefficients: a=5·4×10−5 and b=5·047×10−3 (calculated with minutes as units of age).
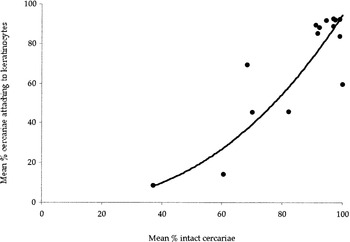
Fig. 4. Relationship between levels of spontaneous de-tailing with age and cercarial infectivity. The fitted curve is based on the best fit power law equation y=0·0011x2·4634 (R=0·9148).
The fate of cercarial tails during infection
Whitfield et al. (2003) have recently demonstrated that when S. mansoni cercariae infect a variety of human skin-derived targets a high proportion of penetrating larvae take their tails with them into the target tissues. This phenomenon was termed delayed tail loss (DTL). It was shown to occur with previously frozen as well as fresh human skin in Franz cells, with fresh human foreskin samples and with differentiated human keratinocyte cultures. DTL was expressed as the percentage of invading cercariae that took their tails into the tissues. In the range of targets listed above this varied between 69 and 92% with exposure times between 5 min and 1 h.
The present experiment has made it possible to assess the value of DTL with respect to a standardized target (differentiated keratinocytes) and a standardized exposure time (5 min) but where the post-emergence age of cercariae varied in a known way. There was a consistently high level of DTL (between 90 and 100%) shown by cercariae up to 13·5 h post-emergence (Fig. 5). Over the period through which DTL has been calculated there was a slight but highly significant increase in tail retention level with increasing age (R=0·7135, P<0·01).
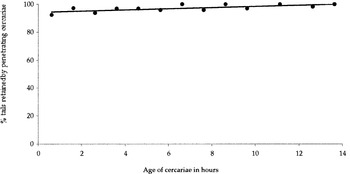
Fig. 5. Age-dependent variation in delayed tail loss. The percentage of tails retained by penetrating cercariae (delayed tail loss, DTL) was calculated from the formula produced by Whitfield et al. (2003), DTL=((W1+T1)−(W2+T2)/(W1+H1)−(W2+H2))×100 where pre-infection counts for whole cercariae, heads and tails were respectively W1, H1, T1, and post-infection values W2, H2, T2. The fitted curve is based on the best fit linear equation y=94·328+0·4186x (R=0·7135).
DISCUSSION
The most significant new data provided by this investigation relate to the age-dependent infection capabilities of S. mansoni cercariae. We contend that the use of differentiated human keratinocyte cultures as a target for cercarial attachment/penetration is a higher fidelity model for in vivo human infection than the animal models used previously. The evidence for this conclusion rests partly on previous findings (Khammo et al. 2002) which showed a good correspondence between attachment to differentiated keratinocytes and that towards entire human skin in Franz cells (Bartlett et al. 2000). More direct evidence comes from a control experiment carried out within the present study. An aliquot of cercariae aged for 3 h was used to infect both a standardized, differentiated keratinocyte target and fresh biopsy specimens of entire human foreskin. This direct comparison of the infectivity to keratinocytes and human skin showed that there was no significant difference in infectivity towards these two targets.
The infectivity pattern revealed by the present study with differentiated keratinocytes has implications for understanding in vivo infection potential. Cercariae maintained a plateau of maximal infectivity of about 90% from 1 until 9 h post-emergence when kept at 25 °C. This long period of optimal infection efficiency was achieved during a time when previous studies have shown that cercarial glycogen reserves are being depleted at an exponential rate (Lawson & Wilson, 1980). At least during the period up to 9 h post-emergence, infectivity was clearly not directly influenced by the falling levels of cercarial energy reserves. If the pattern of changing infectivity described in this study mirrors that which obtains in the field, it follows that, with a midday-peaking diurnal emergence rhythm of cercariae, (Jourdane & Théron, 1987) larval infectivity will be maintained at close to maximal levels for all remaining daylight hours in the tropics. As human hosts are diurnally active, with most water contact occurring in daylight hours, this temporal patterning of maximal cercarial infectivity could be considered as a component of an ‘optimal transmission strategy’ (OTS) as described by Combes, Bartoli & Théron (2002). Parenthetically, it is intriguing to consider why human-infecting S. mansoni cercariae begin their emergence at midday rather than dawn. They seem to be missing an infection opportunity.
Our findings have demonstrated, for the first time, a less than maximal infectivity of cercariae close to the time of their emergence. As glycogen reserves must be at their highest at this time these initial lower levels of infectivity seem enigmatic. This variability could be non-adaptive and due simply to the finite time taken by cercariae for the transition from an endoparasitic to a free-living physiology. Another possibility is contamination of the cercarial surface with molluscan mucus for a period after emergence, reducing the sensitivity of necessary tegumental receptors. Alternatively, the low initial infectivity could be adaptive. Cercariae might improve their overall infection efficiency by having a below optimal infectivity for a short period, thus facilitating their spatial dispersion. Evans & Gordon (1983) examined the age-dependent infectivity of cercariae of Echinoparyphium recurvatum infecting Lymnaea peregra and also found an early period of low infectivity. They too postulated that this pattern was adaptive, reducing superinfection of L. peregra that were releasing cercariae and also ensuring a period of dispersal. A short early period of low or non-infectivity has been demonstrated for miracidia of some digenean species (Ulmer, 1971) and for the oncomiracidia of several monogeneans (Llewellyn, 1972) presumably to aid spatial dispersal before infection.
Determining causation in the relationships between declining glycogen levels, spontaneous de-tailing, survival and infectivity is intrinsically difficult. It is intriguing though, that the end of the plateau period of infectivity broadly coincides with a period of increased de-tailing and mortality. It has been possible to show that there is a close positive relationship between the proportion of tailed cercariae and infectivity levels. Nothing in these results invalidates the conclusion of Lawson & Wilson (1980) that the infection capacity of an individual live (presumably tailed) cercaria remains constant throughout its life-span. As also concluded by those authors, the declining infectivity with age of a population of cercariae is a consequence of increasing numbers of cercarial deaths.
The results on age-dependent changes in DTL suggest that the tail retention process during skin invasion is tightly controlled. The fact that there is so little alteration in DTL percentage during cercarial ageing, while overall infectivity drops from around 90% to about 40%, implies that this behavioural trait is not fortuitous and can be presumed to be adaptive (Whitfield et al. 2003).
This work was funded by the Sir Halley Stewart Trust and the industrial supporters of the FRAME Research Programme.
References
REFERENCES
ANDERSON, R. M. &
WHITFIELD, P. J.
(1975).
Survival characteristics of the free-living cercarial population of the ectoparasitic digenean, Transversotrema patialense.
Parasitology 70, 295–310.CrossRefGoogle Scholar
BARTLETT, A.,
BROWN, M.,
MARRIOTT, C. &
WHITFIELD, P. J.
(2000).
The infection of human skin by schistosome cercariae: studies using Franz cells.
Parasitology 121, 49–54.CrossRefGoogle Scholar
COMBES, C.,
BARTOLI, P. &
THÉRON, A.
(2002).
Trematode transmission strategies. In The Behavioural Ecology of Parasites (
ed. Lewis, E. E.,
Campbell, J. F. &
Sukhedeo, M. V. K.), pp. 1–12. CABI Publishing,
Wallingford, UK.CrossRef
EVANS, N. A. &
GORDON, D. M.
(1983).
Experimental studies on the transmission dynamics of the cercariae of Echinoparyphium recurvatum (Digenea, Echinostomatidae).
Parasitology 87, 167–174.CrossRefGoogle Scholar
JOURDANE, J. &
THÉRON, A.
(1987).
Larval development: eggs to cercariae. In The Biology of Schistosomes: from Genes to Latrines
(ed. Rollinson, D. &
Simpson, A. J. G.),
pp. 83–113.
Academic Press, London.
KHAMMO, N.,
BARTLETT, A.,
CLOTHIER, R. H. &
WHITFIELD, P. J.
(2002).
The attachment of Schistosoma mansoni cercariae to human skin cells.
Parasitology 124, 25–30.CrossRefGoogle Scholar
LAWSON, J. R. &
WILSON, R. A.
(1980).
The survival of the cercariae of Schistosoma mansoni in relation to water temperature and glycogen utilization.
Parasitology 81, 337–348.CrossRefGoogle Scholar
LAWSON, J. R. &
WILSON, R. A.
(1983).
The relationship between the age of Schistosoma mansoni cercariae and their ability to penetrate and infect the mammalian host.
Parasitology 87, 481–492.CrossRefGoogle Scholar
LLEWELLYN, J.
(1972).
Behaviour of Monogeneans. In Behavioural Aspects of Parasite Transmission
(ed. Canning, E. U. &
Wright, C. A.),
pp. 19–30.
Academic Press, London.
STANDEN, O. D.
(1949).
Experimental schistosomiasis II: Maintenance of Schistosoma mansoni in the laboratory, with some notes on experimental infection with S. haematobium.
Annals of Tropical Medicine and Parasitology 43, 268–283.CrossRefGoogle Scholar
STIREWALT, M. A. &
FREGEAU, W. A.
(1968).
Effect of selected experimental conditions on penetration and maturation of cercariae of Schistosoma mansoni in mice. II. Parasite-related conditions.
Experimental Parasitology 22, 73–95.CrossRefGoogle Scholar
ULMER, M. J.
(1971).
Site finding behaviour in helminths in intermediate and definitive hosts. In Ecology and Physiology of Parasites
(ed. Fallis, A. M.),
pp. 123–160.
University of Toronto Press, Toronto.
WHITFIELD, P. J.,
BARTLETT, A.,
KHAMMO, N.,
BRAIN, A. P. R.,
BROWN, M. B.,
MARRIOTT, C. &
CLOTHIER, R.
(2003).
Delayed tail loss during invasion of human skin by schistosome cercariae.
Parasitology 126, 135–140.CrossRefGoogle Scholar
WOLMARANS, C. T.,
DE KOCK, K. N.,
STRAUSS, H. D. &
BORNMAN, M.
(2002).
Daily emergence of Schistosoma mansoni and S. haematobium cercariae from naturally infected snails under field conditions.
Journal of Helminthology 76, 273–277.Google Scholar

Table 1. The age at which each aliquot of cercarial suspension was used to infect keratinocytes
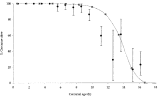
Fig. 1. Age-dependent survival of cercariae at 25 °C. Individual data points represent mean values±S.D. The fitted curve has been calculated using an equation which assumes that the instantaneous death rate of cercariae increases exponentially with time (Anderson & Whitfield, 1975). Instantaneous death rates were calculated from raw survival values through time and a best fit exponential curve generated of the form y=aebt (where y is the instantaneous death rate at time t and a and b are calculated constants). This enabled the estimation of a and b as 3·4×10−7 and 1·2239×10−2 respectively. The fitted survival curve in the figure was then derived from the equation: where Pt is the proportion of cercariae alive at time t.
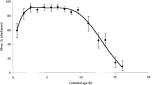
Fig. 2. Age-dependent infectivity of cercariae at 25 °C towards differentiated keratinocytes. Individual data points represent means±S.D. The fitted curve is based on the best fit polynomial equation of the form y=−0·0003x6+0·0151x5−0·3446x4+3·7796x3−21·169x2+31·578 (R=0·9923).
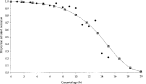
Fig. 3. Age-dependent spontaneous de-tailing of cercariae at 25 °C. The fitted curve has been calculated by assuming that the instantaneous rate of de-tailing can be treated in the same way as age dependent mortality (see Fig. 1). Estimated coefficients: a=5·4×10−5 and b=5·047×10−3 (calculated with minutes as units of age).
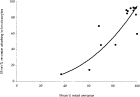
Fig. 4. Relationship between levels of spontaneous de-tailing with age and cercarial infectivity. The fitted curve is based on the best fit power law equation y=0·0011x2·4634 (R=0·9148).
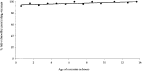
Fig. 5. Age-dependent variation in delayed tail loss. The percentage of tails retained by penetrating cercariae (delayed tail loss, DTL) was calculated from the formula produced by Whitfield et al. (2003), DTL=((W1+T1)−(W2+T2)/(W1+H1)−(W2+H2))×100 where pre-infection counts for whole cercariae, heads and tails were respectively W1, H1, T1, and post-infection values W2, H2, T2. The fitted curve is based on the best fit linear equation y=94·328+0·4186x (R=0·7135).
 You have
Access
- 29
- Cited by