INTRODUCTION
During the early Holocene and previous interglacial periods, large parts of the Sahara were wetter and greener than today. The evidence for episodic wet periods in the now very dry Sahara, and especially during the early to mid-Holocene African Humid Period (or AHP), is incontrovertible and is based on literally hundreds of published studies and multiple reviews (e.g., Street and Grove, Reference Street and Grove1979; Petit-Maire and Riser, Reference Petit-Maire and Riser1981; Fontes and Gasse, Reference Fontes and Gasse1991; Hoelzmann et al., Reference Hoelzmann, Gasse, Dupont, Salzmann, Staubwasser, Leuschner and Sirocko2004; Lézine et al., Reference Lézine, Hély, Grenier and Braconnot2011). This includes sedimentologic evidence such as widespread green mudstones, subaqueous tufas and travertines, evaporites, and organic-rich mats (e.g., Fabre and Petit-Maire, Reference Fabre and Petit-Maire1988; Haynes et al., Reference Haynes, Eyles, Pavlish, Ritchie and Rybak1989; Grunert et al., Reference Grunert, Baumhauer and Völkel1991; Szabo et al., Reference Szabo, Haynes and Maxwell1995; Cremaschi et al., Reference Cremaschi, Zerboni, Spötl and Felleti2010); geomorphic evidence for abandoned river systems, some detected only by radar (or “radar rivers”) (e.g., McCauley et al., Reference McCauley, Schaber, Breed, Grolier, Haynes, Issawi, Elachi and Blom1982; Ghoneim and El-Baz, Reference Ghoneim and El-Baz2007; Paillou et al., Reference Paillou, Schuster, Tooth, Farr, Rosenqvist, Lopez and Malezieux2009; Skonieczny et al., Reference Skonieczny, Paillou, Bory, Bayon, Biscara, Crosta and Eynaud2015); faunal evidence from snails, diatoms, ostracods, and large mammals and reptiles (e.g., Haynes and Mead, Reference Haynes and Mead1982; Pachur and Hoelzmann, Reference Pachur and Hoelzmann1991; Drake et al., Reference Drake, Blench, Armitage, Bristow and White2011); paleo-floral evidence from pollen (e.g., Ritchie et al., Reference Ritchie, Eyles and Haynes1985; Jolly et al., Reference Jolly, Prentice, Bonnefille, Ballouche, Bengo, Brenac and Buchet1998; Kröpelin et al., Reference Kröpelin, Vershuren, Lezine, Eggermont, Coquyt, Francus and Cazet2008); and archeological evidence for widespread occupation of the inhospitable modern Sahara in the middle and upper Paleolithic and Neolithic periods (e.g., McHugh et al., Reference McHugh, Breed, Schaber, McCauley and Szabo1988; Kuper and Kröpelin, Reference Kuper and Kröpelin2006).
Still under debate is the latitudinal extent and magnitude of the AHP and the relative contribution of Mediterranean moisture from the north versus tropical moisture from the south. More important is how to translate the evidence for the wetter environments into estimates of paleo-rainfall rates. Opinion seems to vary widely on this point, ranging from modest changes based largely on paleoecologic evidence (Haynes and Mead, Reference Haynes and Mead1982; Ritchie and Haynes, Reference Ritchie and Haynes1987; Jolly et al., Reference Jolly, Prentice, Bonnefille, Ballouche, Bengo, Brenac and Buchet1998; Peyron et al., Reference Peyron, Jolly, Braconnet, Bonnefille, Guiot, Wirrman and Chalie2006; Kröpelin et al., Reference Kröpelin, Vershuren, Lezine, Eggermont, Coquyt, Francus and Cazet2008) to significant changes required to build and sustain megalakes and interconnected waterways of the Sahara (Armitage et al., Reference Armitage, Drake, Stokes, El-Hawat, Salem, White, Tunrer and McLaren2007; Drake et al., Reference Drake, Blench, Armitage, Bristow and White2011). The question that we raise in this review is how much wetter than today was the Sahara during the AHP, and does the presence or absence of megalakes help constrain paleo-rainfall amounts?
The paleohydrologic state of the Sahara during its proposed wet phases provides a test of how sensitive the thermal equator, the Intertropical Convergence Zone (ITCZ), and the associated maximum rain belt (e.g., Nicholson, Reference Nicholson2009) are to asymmetric heating of the hemispheres. This is because greening of the Sahara is widely considered to be the result of a northward shift in the boreal summer ITCZ in response to increased summertime irradiance of the Northern Hemisphere (e.g., Kutzbach, Reference Kutzbach1981; Kutzbach and Liu, Reference Kutzbach and Liu1997; Claussen et al., Reference Claussen, Kubatzki, Brivkin, Ganpolski, Hoelzmann and Pachur1999). Moreover, the wet and green corridors through the Sahara that resulted from this shift are thought to have facilitated the spread of invasive species like hominids out of Africa at various times in the Pleistocene.
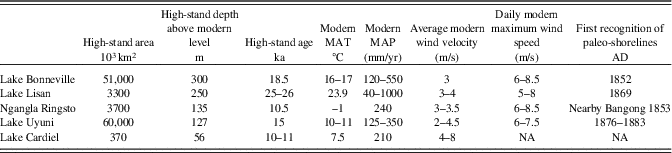
Megalakes in the Sahara Desert would have been key links in these hydrologic corridors through the Sahara, and they potentially provide quantitative evidence for exactly how wet the Sahara was during pluvial Quaternary intervals. The term “megalake” has no formal definition, but in this paper, we take it to refer to lakes >10,000 km2 in area. Modern examples of megalakes include all of the North American Great Lakes ranging from Lake Erie (26,000 km2) to Lake Superior (82,000 km2), the Caspian Sea (371,000 km2) and Lake Baikal (32,000 km2) in Asia, Lake Victoria (68,800 km2) in Uganda and Tanzania; paleolakes include Lake Bonneville (51,000 km2) and Lahontan (22,000 km2) in the western United States, Lake Uyuni (~60,000 km2) in the central Andes (Fig. 1, Table 1), and Lake Agassiz (>250,000 km2), the late glacial-age antecedent to the Great Lakes.
(color online) Locations of modern and ancient lakes discussed in text.

Attributes of large paleolakes discussed in text.

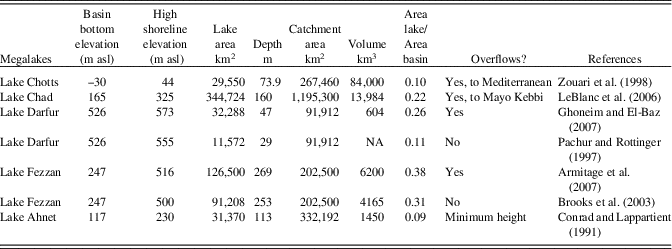
Various researchers have suggested that megalakes coevally covered portions of the Sahara during the AHP and previous periods, such as paleolakes Chad, Darfur, Fezzan, Ahnet-Mouydir, and Chotts (Fig. 2, Table 2). These proposed paleolakes range in size by an order of magnitude in surface area from the Caspian Sea–scale paleo-Lake Chad at 350,000 km2 to Lake Chotts at 30,000 km2. At their maximum, megalakes would have covered ~10% of the central and western Sahara, similar to the coverage by megalakes Victoria, Malawi, and Tanganyika in the equatorial tropics of the African Rift today. This observation alone should raise questions of the existence of megalakes in the Sahara, and especially if they developed coevally.
ETOPO1 digital elevation model (1 arc-minute; Amante and Eakins, Reference Amante and Eakins2009) of proposed megalakes in the Sahara Desert during the late Quaternary. Colors denote Köppen-Geiger climate zones: blue, Aw, Af, Am (tropical); light tan, Bwk, BSh, BSk, Csa, Csb, Cwb, Cfa, Cfb (temperate); red-brown, Bwh (arid, hot desert and steppe climate). Lake area at proposed megalake high stands and present Lake Victoria are in blue, and contributing catchment areas are shown as thin solid black lines. The main tributaries of Lake Chad are denoted by blue lines (from west to east: the Komadougou-Yobe, Logone, and Chari Rivers; source: Global Runoff Data Center, Koblenz, Germany). Rainfall isohyets (50, 200, 800, 1200, and 1600) are marked in dashed gray-scale lines. Physical parameters of each basin are shown in white boxes: A bt, total basin area; A W, lake area; V w, lake volume; and a W =A W/A bt. Black dots mark the location of the paleohydrological records from Lezine et al. (2011), also compiled in Supplementary Table S5. (For interpretation of the references to color in this figure legend, the reader is referred to the web version of this article.)

Characteristics of proposed megalakes and their catchments from DEM ETOPO 1.8 km analysis.

Megalakes, because of their significant depth and area, generate large waves that become powerful modifiers of the land surface and leave conspicuous and extensive traces in the geologic record. In this paper, we review the many geologic features associated with megalakes, and assess their preservation potential with time, as these features are gradually erased by subsequent wind and water erosion. We then turn to the geologic evidence for megalakes in the Sahara and ask two questions: If they really existed, what are the paleohydrologic implications, and how does this compare to evidence from other paleoenvironmental proxies in the Sahara? In the end, we are skeptical about the presence of megalakes in the Sahara and that conditions were ever wet enough to produce them. Because this is a crucial point for hydrologic and climate modeling, we challenge the geologic community to really demonstrate their former presence.
Lakes, megalakes, and wetlands
The term “lake” is variously defined, but for this paper it is a large, continuous area of water surrounded by land. As lakes diminish in size, they often segment into marshes, swamps, or more generally “wetlands.” Lakes and wetlands may be perennial or ephemeral, but our focus here is on their perennial forms. There is no clear cutoff in size between lakes and wetlands. However, lakes tend to leave recognizable shorelines and other shallow-water features where they exceed 1–10 km2 in surface area, features that distinguish them from perennial wetlands, depending on water depth, bedrock type, and local shore gradients (Enzel et al., Reference Enzel, Kushnir and Quade2015, Reference Enzel, Quade and Kushnir2017).
There is a growing body of literature on the geologic distinction between lakes and wetlands (e.g., Quade et al., Reference Quade, Mifflin, Pratt, McCoy and Burckle1995; Rech et al., Reference Rech, Quade and Betancourt2002, Reference Rech, Ginat, Catlett, Mischke, Winer and Pigati2017; Ashley et al., Reference Ashley, Tactikos and Owen2008; Pigati et al., Reference Pigati, Rech, Quade and Bright2014; Enzel et al., Reference Enzel, Kushnir and Quade2015). In deserts such as the Sahara, springs and associated wet meadows and wetlands are supported mostly or entirely by ground water, and in the geologic record they produce what has been termed “ground-water discharge deposits” or GWDs (Pigati et al., Reference Pigati, Rech, Quade and Bright2014). The main features of GWDs are summarized and illustrated elsewhere (Pigati et al., Reference Pigati, Rech, Quade and Bright2014; Enzel et al., Reference Enzel, Kushnir and Quade2015) and will be only briefly reviewed here.
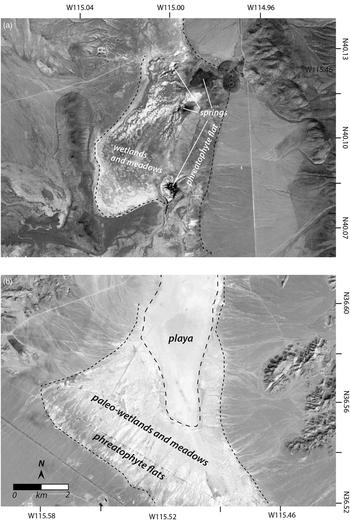
GWDs are a complex ensemble of generally fine-grained (fine sand, silt, and lesser clay; Pigati et al., Reference Pigati, Miller, Bright, Mahan, Nekola and Paces2011) deposits that form where shallow aquifers come near to or intersect the land surface (Fig. 3). In areas surrounding springs and wetlands, ground water can be within a few meters of the surface and is often tapped by phreatophytes. Dense stands of phreatophytes are capable of trapping fine-grained, wind-blown and alluvial silt and sand over broad areas of the basin bottom (Fig. 3). These deposits are tan in color; poor to well bedded, with small-scale bedforms; can contain abundant fine root voids; and are generally nonfossiliferous (Quade et al., Reference Quade, Mifflin, Pratt, McCoy and Burckle1995; Pigati et al., Reference Pigati, Miller, Bright, Mahan, Nekola and Paces2011, Reference Pigati, Rech, Quade and Bright2014).
Landsat-8 gray-tone images of a modern and fossil ground-water discharge deposits (or GWDs) shown at the same scale. (a) Spring-fed wetlands in the Butte Valley, NE, United States (Fig. 1), showing the locations of several springs that sustain wet meadows and ponds in the valley bottom. Butte Valley is not hydrographically closed and drains to the south. However, the N-S gradient in the valley is very low (~0.15%), and spring discharge is partly impounded against the low hills in the SW portion of the image, slowing drainage and leading to wetland development. White areas represent fine-grained sediments, possibly deposited by older wetlands in the valley. The lake was not occupied by a paleolake during the late Quaternary, hence the lack of paleo-shorelines. However, a sharp boundary (fine dashed outline) distinguishes the dry alluvial fans from wet meadows and wetlands formed by the shallow water table in the valley center. (b) Late glacial-age paleo-wetland deposits in the Three Lakes Valley north of Las Vegas, NE, United States. These and similar deposits have been systematically studied in the region as examples of GWDs. Note the lack of paleo-shorelines but a very sharp transition (fine dashed outline) from alluvial fan deposits to white-colored deposits in the valley bottom, as in Butte Valley in a). A dry, non-phreatic playa occupies the basin center (coarse dashed outline).

Springs can form along a simple, nontectonic intersection of the water table with the land surface, as seen in the examples in Figure 3a, or in other cases along faults (e.g., Quade et al., Reference Quade, Mifflin, Pratt, McCoy and Burckle1995). Spring orifices themselves are rarely but occasionally visible in the geologic record. By contrast, the GWD facies deposited in wetlands and wet meadows fed by springs abound in the geologic record and are distinctive both geologically and biologically from lake deposits. These facies are dominated by white to pale-green mud and minor sands and are usually massive rather than finely bedded, due to intense shallow-water bioturbation by plants and animals, in contrast to the fine bedding or laminations of deeper lake deposits. Organic-rich mats also typify these systems and form around spring orifices and in adjacent wetlands (Haynes, Reference Haynes1987; Quade et al., Reference Quade, Forester, Pratt and Carter1998). Cementation by primary and secondary carbonate is also common in some GWDs, especially where surrounding country rock contains limestone. Generally, bedded evaporites are not found in the spring, wet-meadow, and channel-outflow facies of GWDs, but can develop where discharge collects in shallow spillover or terminal basins (Pigati et al., Reference Pigati, Rech, Quade and Bright2014; Fig. 3b).
Biologically, GWDs contain a distinctive mix of moist terrestrial, semiaquatic, and fully aquatic snails and bivalves, as well as a diverse array of diatoms and especially ostracods, reflecting spring, spring-fed channel, and wetland microhabitats (Quade et al., Reference Quade, Forester and Whelan2003). Salt-tolerant (euryhaline) ostracods, which characterize some lakes, are uncommon in GWDs, but may be present where spring discharge reaches and evaporates in a terminal basin. One unusual feature of ostracod faunas in GWDs is the local abundance of minute subterranean taxa that live in intergranular spaces and fractures of the saturated zone (Reeves et al., Reference Reeves, De Deckker and Halse2007; Forester et al., Reference Forester, Carter, Quade and Smith2016). Fish are also found in GWDs, as are turtles, and in the Old World, crocodile and hippopotamus.
Despite these differences, there is enough overlap both biologically and geologically between GWDs and lake deposits that the two are often confused, especially in the deep geologic record, where key geomorphic indicators of lakes such as paleo-shorelines have been erased. However, paleo-shorelines and other features are often preserved in late Quaternary–age systems and are crucial for distinguishing between lakes and GWDs.
Active ground-water discharge systems abound in the Sahara today, although they were much more widespread in the AHP. They range from isolated springs and wet ground in many oases scattered across the Sahara (e.g., Haynes et al., Reference Haynes, Eyles, Pavlish, Ritchie and Rybak1989) to wetlands and small lakes (Kröpelin et al., Reference Kröpelin, Vershuren, Lezine, Eggermont, Coquyt, Francus and Cazet2008). Ground water feeding these systems is dominated by fossil AHP-age and older water (e.g., Edmunds and Wright Reference Edmunds and Wright1979; Sonntag et al., Reference Sonntag, Thorweihe, Rudolph, Lohnert, Junghans, Munnich, Klitzsch, El Shazly and Swailem1980), although recently recharged water (<50 yr) has been locally identified in Saharan ground water (e.g., Sultan et al., Reference Sultan, Sturchio, Gheith, Hady and El Anbeawy2000; Maduapuchi et al., Reference Maduapuchi, Faye and Maloszewski2006).
Turning to the geomorphic and sedimentologic characteristics of large lake systems, the authors offer five examples based on firsthand experience: Lake Bonneville (Utah, United States), Lake Uyuni (Bolivia), Lago Cardiel (Argentina), Ngangla Ringtso (Tibet, China), and Lake Lisan (Levant) (Fig. 1, Table 1). These examples are relevant because they are found in arid and semiarid settings similar to the Sahelian Sahara today. These settings are also geologically very active, experiencing strong winds, extreme temperature fluctuations, and active regional tectonism that all would tend to erase shoreline features at least as readily as in the Sahara. Finally, in most of these examples, the highest paleo-shoreline systems are double to triple (18–30 ka) the age of AHP, the exceptions being Ngangla Ringtso and Lago Cardiel, where the high shorelines are roughly AHP in age. These examples therefore provide a conservative assessment of the geologic preservability of shorelines of AHP age.
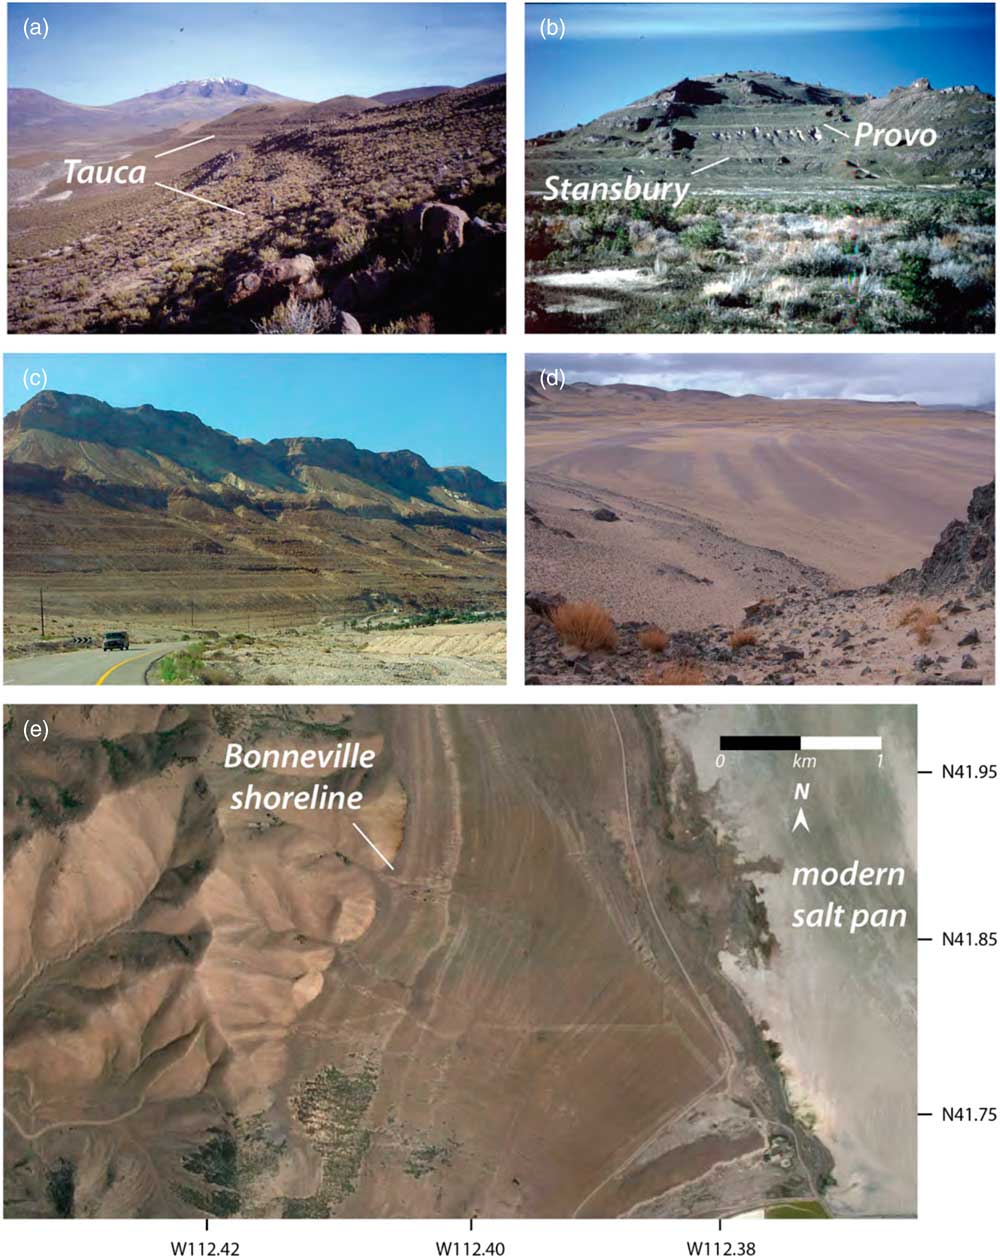
Large lakes are powerful agents of landscape modification, and their shorelines and other features are not subtle (Fig. 4), as readily recognized by the earliest explorers and naturalists, some of them non-geologists, in remote desert locations. For example, in the 1850s, surveyors (Stansbury, Reference Stansbury1852) and early geologists (J.H. Simpson in 1859, published in Simpson, Reference Simpson1876) recognized the presence of a former large pluvial lake, Lake Bonneville, in western Utah. This system was later made famous by the thorough study of Gilbert (Reference Gilbert1890), who named the most prominent shorelines that are visible today nearly continuously around the basin circumference (Fig. 4b and e) and on interior islands. Early naturalists (Agassiz, Reference Agassiz1876; Minchin, Reference Minchin1882; Hettner, Reference Hettner1889) exploring the Altiplano of Bolivia recognized the extensive paleo-shorelines fringing the Titicaca and overflow desert basins of Poopó, Coipasa, and Uyuni to the south (Fig. 4a) as remains of an ancient megalake system. Edouard Lartet (in Lartet, Reference Lartet1869), a paleontologist traveling through the Levant in the area of the Dead Sea in the early 1860s, provided the first systematic description of paleo-Lake Lisan shorelines and deposits (Fig. 4c). In Tibet, the British geographer H. Strachey left clear descriptions of paleo-shorelines around Lake Bangong and other modern salt lakes in western Tibet and interpreted them as evidence for the former presence of large lakes (Strachey, Reference Strachey1853).
(color online) Examples of paleo-shorelines from large lake systems around the world (Fig. 1). (a) The Tauca shoreline complex, the high stand of mega-Lake Uyuni (55,000 km2) formed from spillover into central Bolivia of Lake Titicaca at 16.5–15 ka (Placzek et al. Reference Placzek, Quade and Patchett2006). (b) the Provo and Stansbury paleo-shorelines of mega-Lake Bonneville (53,000 km2) in central Utah formed during lake transgression and regression 25–13 ka; (c) paleo-shorelines in the 30–15 ka range formed around Lake Lisan near Ein Gedi, Israel (credit Yuval Bartov); (d) paleo-shorelines formed around Ngangla Ring Tso (6400 km2) in west central Tibet; dated 10.3–8.6 ka; (e) Landsat image natural color image of some typical lake and non-lake features associated with mega-Lake Bonneville on the east side of the Promontory Mountains in central Utah. The Bonneville shoreline formed during the lake high stand between 19 and 18 ka, and the regressional shorelines below it formed 18–12 ka. Offshore deposition infilled and smoothed topography below the high shoreline, later modified by shallow wave action into multiple shorelines during lake regression. In large and megalake systems such conspicuous preservation of paleo-shorelines is quite typical. Note the sharp contrast between this smoothed sub-lake topography and the deeply dissected hillslopes above the Bonneville shoreline.

Except around Lake Chad (see Tilho, Reference Tilho1925), there has not been an equivalent recognition of obvious paleo-shorelines tied to ancient megalakes during the long history of Saharan exploration and study, starting in the early nineteenth century and continuing right up to the present. In later sections of the paper we will review a few instances (e.g., Haynes et al., Reference Haynes, Eyles, Pavlish, Ritchie and Rybak1989; Armitage et al., Reference Armitage, Drake, Stokes, El-Hawat, Salem, White, Tunrer and McLaren2007; Ghoneim and El-Baz, Reference Ghoneim and El-Baz2007) in which the presence of paleo-shorelines has been suggested, but these features are not apparently extensive and warrant much more investigation. Fine-grained deposits and their aquatic fossils have been widely interpreted as lake deposits in the Sahara by geologists and geographers, but we argue that this is insufficient evidence of former large lakes and more probable evidence of restricted paleo-wetlands and small lakes.
In basins once occupied by large lakes, many outcrops will generally preserve some sort of evidence of wave action and former submergence (for thorough reviews of shoreline features and processes, see Adams and Wesnousky, Reference Adams and Wesnousky1998; Reheis et al., Reference Reheis, Adams, Oviatt and Bacon2014). On nonlithified materials, such evidence includes shoreline complexes with steep constructional berms, gravel bars with well-sorted, well-rounded gravels (Fig. 5a) often mantled by shingle gravel, and back-bar lagoons, in packages repeated many times, as the lake regressed from its highest shoreline down to modern lake or playa level (Fig. 4e). On bedrock, lacustrine features include wave-cut notches, in some cases carved tens of meters back into hillsides (Lifton et al., Reference Lifton, Jull and Quade2001), and polished bedrock in resistant lithologies like quartzite (Fig. 5e) or basalt, but almost never on limestone or dolostone. Most of these features are visible around the five large lake systems listed earlier, with the best preservation around the 11–6 ka Tibetan paleolakes, and the least around 30–18 ka Lake Lisan. Moreover, shoreline development tends to be strongest during lake stillstands, often controlled by spillover thresholds, such as the Bonneville and Provo shorelines in the Bonneville system (Fig. 4b and e). Secondary cementation by tufas (Fig. 5c and d) is also a very common shoreline outcrop-scale feature in all these modern lake examples, although we recognize that this is not the case in all lakes and paleolakes.
(color online) Typical outcrop features of large lake systems from around the world (Fig. 1): (a) Polished pebbles on a beach bar (inset close-up) from Lago Cardiel, Argentina, ~8 ka in age. Person for scale. (b) Deltaic system with inclined Gilbert delta foresets indicating flow to the left, from Ngangla Ring Tso, Tibet, knapsack for scale. Person for scale. (c) Spring mound tufa formed by sublacustrine spring discharge into the paleo Ngangla Ring Tso, Tibet, ~7.8 ka. The tufa mound is about 3 m tall. Early Holocene paleo-shorelines are visible in the background. (d) Tufa encrusting a large boulder near the high shoreline dated 10.3–8.6 ka from Ngangla Ring Tso, Tibet. Person for scale. (e) Wave-polished quartzite boulder from the Bonneville shoreline, dated ~19–18 ka, Utah, United States; water bottle for scale. (f) Laminated lake beds from Ngangla Ring Tso, Tibet, 10.3–8.6 ka, sitting person for scale on skyline.

Paleo-shorelines tend to preserve well in deserts, although their traces will eventually be erased given enough time. Mifflin and Wheat (Reference Mifflin and Wheat1979), in their systematic survey of paleolakes in the Great Basin, United States, observed that paleo-shorelines ≤30 ka are widely preserved in semiarid regions. As an example, our survey by Landsat (U.S. Geological Survey products) or other satellite imagery reveals multiple shorelines formed 18–12 ka around Lake Bonneville (Fig. 4e) that are visible in every previously submerged basin. In an example from the Great Basin, United States, preservation of paleo-shorelines in lakes >20 m in depth in this time range is typically >75% of the original circumference, whereas in smaller lakes that are <20 m deep, preservation is <30% (Mifflin and Wheat, Reference Mifflin and Wheat1979). The Tibetan examples are exceptionally well preserved (Hudson and Quade, Reference Hudson and Quade2013; Fig. 4d), despite ≥ 6000 yr of flashy monsoon runoff, strong midtropospheric winds, cryogenesis, and active tectonism.
Shoreline preservation can be variable, however, and depends on several factors, including time, local rainfall, bedrock durability, as well as the size and extent of the original shoreline features. Mifflin and Wheat (Reference Mifflin and Wheat1979) showed that paleo-shorelines can persist up to 100–150 ka (OIS 6) in the semiarid Great Basin (and in very rare instances, to OIS 16 [Reheis et al., Reference Reheis, Sarna-Wojcicki, Reynolds, Repenning and Mifflin2002]) but are significantly less common than <30 ka shorelines, a pattern also observed in arid Tibet (Hudson and Quade, Reference Hudson and Quade2013) and the high Andes of South America (Chen et al., Reference Chen, McGee and Quade2015). Very old shorelines would probably be even more widely visible if not for the tendency of younger lakes to re-inundate and therefore erode and bury them. Deep gullying of high paleo-shorelines is one common erosional pattern (e.g., Fig. 4b, along Lake Bonneville’s Provo shoreline), accompanied by downslope redeposition of the eroded material, obscuring shorelines, especially in embayments fed by large catchments and less so around headlands. Perched springs and wet meadows can also emerge along old shorelines, covering them over time. And finally, eolian processes can also erode and cover old, abandoned shorelines. Winds will not transport gravel-size material and so will have little erosive effect on prominent shoreline features such as gravel bars, except for ventifaction. Sand dunes and sheets can locally cover paleo-shorelines, and this is an important issue in the Sahara and other sand deserts like the Arabian and the Taklamakan.
A final important feature of lake systems is terrain filling and smoothing, whereby shallow-water erosion and deposition smooth out the gullied, pre-lake alluvial fans and bedrock on hillsides and across the basin bottom (Fig. 4e). This effect is basin-wide but strongest closer to river mouths, where large deltaic complexes with their distinctive large-scale foreset beds can be found (Fig. 5b). Large-scale deltaic complexes are virtually never found in GWDs. Farther offshore, fine-grained, bedded or laminated lacustrine sediments blanket the bottom of the basin (Fig. 5f). These sediments are extremely variable in character, ranging from clastic silt and sand to authigenic marls and organic-rich mats, to diatomites or ostracod limestones depending on lake chemistry, and bedded evaporites where the lakes are dry or near dry (Cohen, Reference Cohen2003). Unfortunately, for the purposes of distinguishing lakes versus GWDs, these fine-grained sediments are the least diagnostic and are most often confused with each other in the general geologic and Quaternary literature. Evaporites are the one exception. GWDs are dominated by spring, wet-meadow, wetland, and channel-outflow deposits, and these almost never contain evaporites. These kinds of deposits can stretch for many kilometers, and if large spring complexes terminate in closed basins, then evaporites can develop if the water table is near the surface (e.g., Quade et al., Reference Quade, Rech, Betancourt, Latorre, Quade, Fisher and Rylander2008). By contrast, evaporites commonly develop in waning stages of closed-basin lakes. Detailed analysis of the microfauna will often assist in the distinction between lake versus GWDs (e.g., Mischke et al., Reference Mischke, Ginat, Salem Al-Saqarat, Faershtein, Porat, Braun and Rech2017).
With this perspective in hand on the characteristics of GWDs versus lake deposits and shoreline landforms, we can turn to the recent geological record from the Sahara and the question raised in the title of this paper: Were there megalakes in the Sahara during the AHP or before?
Megalakes in the Sahara
Various researchers have suggested that megalakes once covered portions of the Sahara during the AHP and earlier intervals, including paleo-Lakes Chad, Darfur, Fezzan, Ahnet, and Chotts (Fig. 2). In this section, we review the evidence for each of these using a combination of published literature, digital elevation model (DEM) reconstructions of potential shoreline elevations, and Landsat and Copernicus imagery to search for evidence of shorelines.
Mega-Lake Chad
In our view, Lake Chad is the only former megalake in the Sahara firmly documented by sedimentologic and geomorphic evidence. Mega-Lake Chad is thought to have covered ~345,000 km2, stretching for nearly 8° (10–18°N) of latitude (Ghienne et al., Reference Ghienne, Schuster, Bernard, Duringer and Brunet2002) (Fig. 2). The presence of paleo-Lake Chad was at one point challenged, but several—and in our view very robust—lines of evidence have been presented to support its development during the AHP. These include: (1) clear paleo-shorelines at various elevations, visible on the ground (Abafoni et al., Reference Abafoni, Arabi and Funtua2014) and in radar and satellite images (Schuster et al., Reference Schuster, Roquin, Duringer, Brunet, Caugy, Fontugne, Mackaye, Vignaud and Ghienne2005; Drake and Bristow, Reference Drake and Bristow2006; Bouchette et al., Reference Bouchette, Schuster, Gienne, Denamiel, Roquim, Moussa, Marseleix and Duringer2010); (2) sand spits and shoreline berms (Thiemeyer, Reference Thiemeyer2000; Abafoni et al., Reference Abafoni, Arabi and Funtua2014); and (3) evaporites and aquatic fauna such as fresh-water mollusks and diatoms in basin deposits (e.g., Servant, Reference Servant1973; Servant and Servant, Reference Servant and Servant1983). Age determinations for all but the Holocene history of mega-Lake Chad are sparse, but there is evidence for Mio-Pliocene lake (s) (Lebatard et al., Reference Lebatard, Bourles, Braucher, Arnold, Duringer, Jolivet and Moussa2010) and major expansion of paleo-Lake Chad during the AHP (LeBlanc et al., Reference LeBlanc, Favreau, Maley, Nazoumou, Leduc, Stagnitti, Van Oevelen, Delclaux and Lamoalle2006; Schuster et al., Reference Schuster, Roquin, Duringer, Brunet, Caugy, Fontugne, Mackaye, Vignaud and Ghienne2005; Abafoni et al., Reference Abafoni, Arabi and Funtua2014; summarized in Armitage et al., Reference Armitage, Bristow and Drake2015) up to the basin overflow level at ~329 m asl.
Mega-Lake Chad was primarily fed today by the Chari and Logone Rivers, rivers that head far to the south, at 6°N near the equator, where mean annual rainfall is >1.5 m in some parts of the contributing watershed. This is a crucial distinction from other proposed Saharan megalakes, where the contributing watersheds are confined between 15°N and 35°N in areas that receive <<100 mm/yr today. Kutzbach (Reference Kutzbach1980) and Coe (Reference Coe1997) estimate that nearly a doubling of basin-wide mean modern rainfall (350 mm/yr today) was required to create Lake Chad during the AHP. Later in the paper and in the supplement, we will revisit and increase this estimate of paleo-rainfall required to support paleo-Lake Chad.
Mega-Lake Darfur
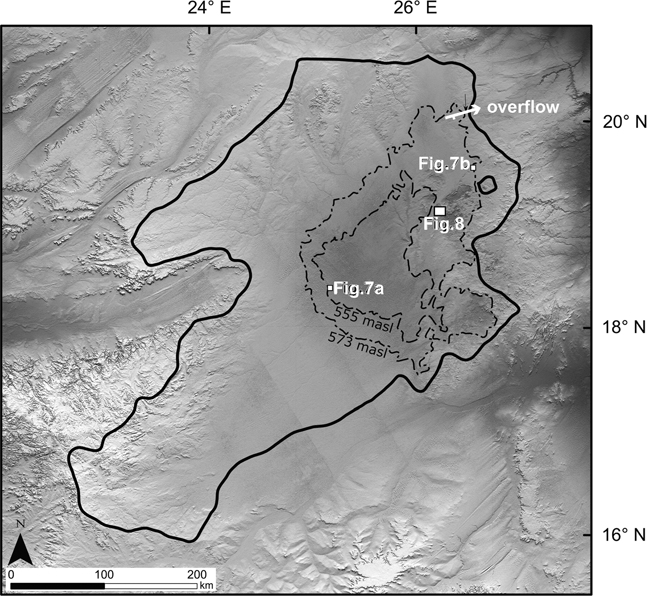
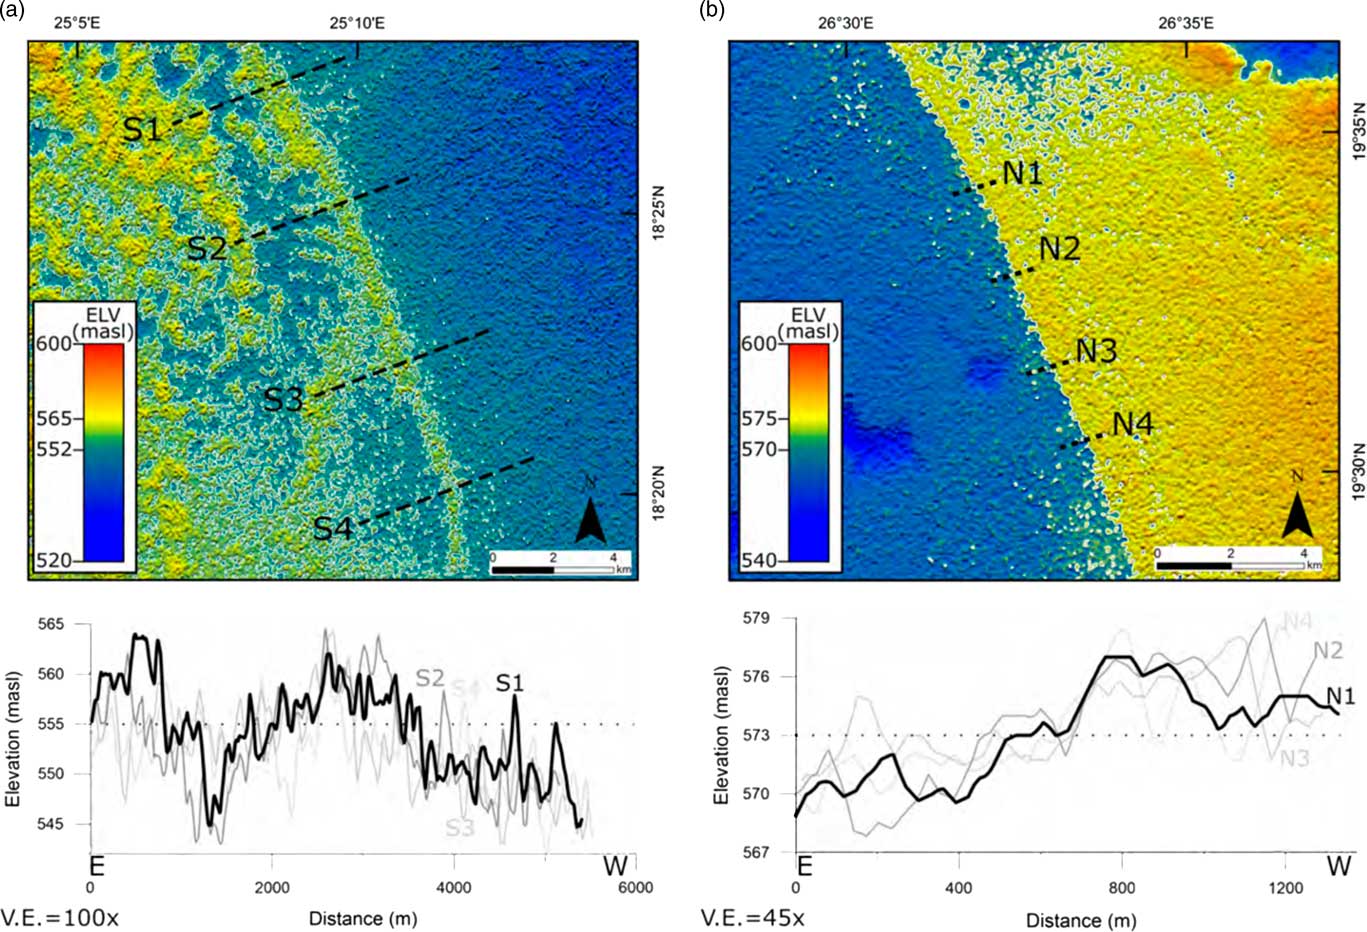
The North Darfur (also referred to as the West Nubian) paleolake basin in northwest Sudan (Fig. 2), the driest sector of the Sahara today, contains abundant and unequivocal evidence for perennial surface water during the AHP. These water bodies were initially interpreted as interconnected shallow wetlands and lakes (Pachur and Hoelzmann, Reference Pachur and Hoelzmann1991). But in recent publications, estimates of the size and depth of this lake system have significantly increased, based on the distribution of fine-grained deposits containing marls, diatoms, aquatic snails, hippopotamus, and crocodiles. By drawing a circumference around such deposits, Hoelzmann et al. (Reference Hoelzmann, Kruse and Rottinger2000) estimated the lake surface of the North Darfur paleolake during the AHP had ranged between 1100 and 7000 km2. Evidence of possible shorelines based on DEM radar data from Pachur and Rottinger (Reference Pachur and Rottinger1997) and Ghoneim and El-Baz (Reference Ghoneim and El-Baz2007) increased the estimates of the integrated paleolake to ~32,200 km2, roughly the size of Lake Erie, the smallest of the Great Lakes in the United States (Figs. 6 and 7). As far as we know, the apparent shorelines on these images remain undated and undocumented on the ground by geomorphic mapping and/or sedimentologic analyses, but are suggested to be of AHP age, based on the extensive dating of fine-grained deposits that they encompass.
Hill-shaded Shuttle Radar Topography Mission (SRTM, U.S. Geological Survey products) 3 arc-second digital elevation model (from 380 m asl [black] to 2200 m asl [white]) of the key features of the North Darfur basin and proposed mega-Lake Darfur. Solid black line marks the hydrographic limits of the basin. Dashed black lines mark the location of the proposed high-stand lake of Ghoneim and El-Baz (Reference Ghoneim and El-Baz2007) at 573 m asl (see detail in Fig. 7b) and of the 555 m asl shoreline (see detail in Fig. 7a) of Pachur and Rottinger (Reference Pachur and Rottinger1997). Overflow point of the basin at 573 m asl indicated with a white arrow. Also indicated is the location of the rocky upland area shown in Fig. 8 from the Nukheila area.

(color online) SRTM 3 arc-second digital elevation model images and cross section from the North Darfur basin of the hypothesized paleo-shorelines at (a) ~555 m asl of Parchur and Rottinger (1997) and (b) ~573 m asl of Ghoneim and El-Baz (Reference Ghoneim and El-Baz2007). See Fig. 6 for locations.

The evidence for a North Darfur megalake is intriguing but needs much more field documentation to be convincing. Unquestionably the basin contains considerable evidence for perennial standing and flowing water at many locations, but these could represent disconnected wetlands and springs rather than a continuous lake. The images of apparent paleo-shorelines shown in figures 5 and 7 of Ghoneim and El-Baz (Reference Ghoneim and El-Baz2007), as well as those reported in Pachur and Rottinger (Reference Pachur and Rottinger1997), are possible vestiges of shorelines buried beneath dunes. Our DEM images of the features (Fig. 7) reveal 10- to 15-m-high berms, large by lacustrine standards but not excessively so. How the high-standing ridges of Pachur and Rottinger (Reference Pachur and Rottinger1997) were formed in the middle of broad, flat plains by lacustrine processes remains to be explained (Fig. 7a), and clearly requires field investigation. It is possible that the shorelines reported by Ghoneim and El-Baz (Reference Ghoneim and El-Baz2007; Fig. 7b) represent vestiges of a much older lake (>100 ka) whose shorelines were shielded from erosion by burial under sand at some point. Even at this greater age, the lack of multiple inset shorelines imaged at a range of elevations is unusual for a lake of this size and, in our opinion, challenges the presence of a megalake at any time during the late Quaternary. As far as we know, these “shoreline” features have not been mapped or investigated on the ground, and this is necessary to firmly establish their origins.
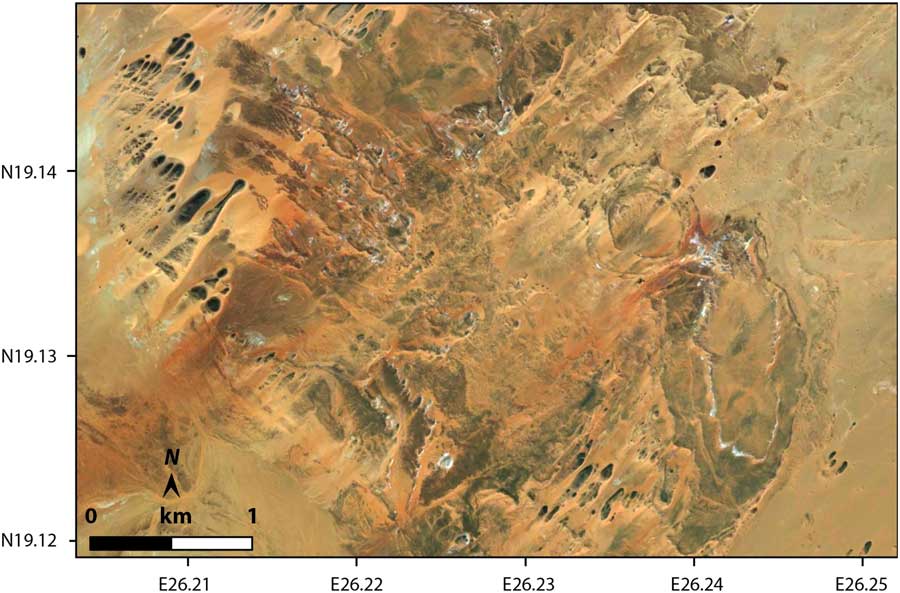
We can find no evidence of paleo-shorelines in other parts of the basin not covered by sand. For example, bedrock and alluvium is well exposed at various points around the basin in the 500–575 m asl range, such as the uplands of the Nukheila area (Fig. 8). These areas on the east side of the proposed lake would have been exposed to the full force of waves fetching across the proposed deep (50 m) and open (>150 km) water, driven by summer winds blowing from the southwest. This is the context in modern and ancient megalake systems for pervasive modification by powerful wave action at multiple elevations during the lake’s high stand and subsequent regression. Landsat/Copernicus images of the hilly Nukheila area reveal a network of dendritic drainages but no shoreline features, nor the smoothed and infilled terranes so typical of once-inundated areas, evidence that should be readily visible at the scale shown in Figure 8.
DigitalGlobe image (0.5 m/pixel; source: ESRI) of the Nukheila area on the eastern side of Darfur basin (see Fig. 6 for location). This rocky upland area is relatively free of sand. The elevation in the frame spans 520–570 m asl, and would have covered by mega-Lake Darfur, which is speculated to have reached 573 m but left distinct shorelines at 555, 560, and 565 m asl (Pachur and Rottinger, Reference Pachur and Rottinger1997; Ghoneim and El-Baz, Reference Ghoneim and El-Baz2007). No shorelines are visible in this well-exposed area, but should be preserved all across the area had a large lake been present, as at Lake Bonneville at the same scale in Fig. 4e. NE to SW lineaments are dunes, and NW to SE lineaments are bedrock ridges in Paleozoic sediments (Elsheikh et al., Reference Elsheikh, Abdelsalam and Mickus2011).

Mega-Lake Fezzan
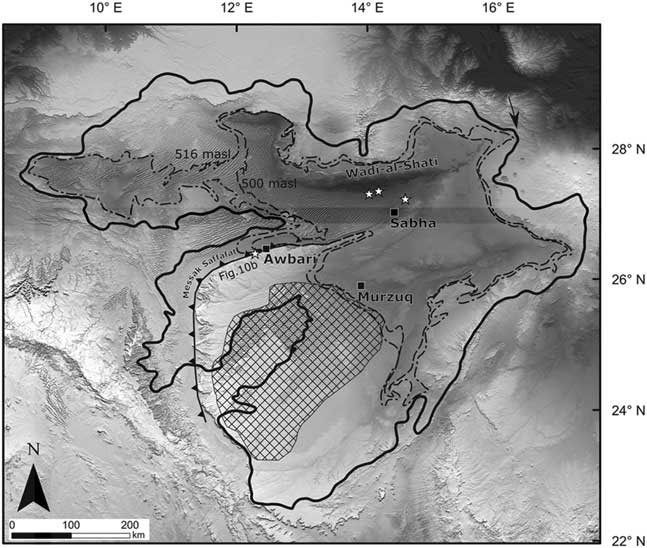
Further north in western Libya, many basins hosted perennial water bodies at various times in the Quaternary. The largest of these, termed “Lake MegaFezzan”, is interpreted to have encompassed the areas of Awbari, Brak, Sabha, and Murzuq (Fig. 9) during OIS 11 (Thiedig et al., Reference Thiedig, Oezen, El-Chair and Geyh2000; Brooks et al., Reference Brooks, Drake, McLaren and White2003; depicted in fig. 1 in Armitage et al., Reference Armitage, Drake, Stokes, El-Hawat, Salem, White, Tunrer and McLaren2007) and covered an area of 91,000–125,500 km2. As in many other studies, the extent of these “megalakes” is largely based on the distribution of rather widely dispersed, fine-grained clay and mollusk-rich sedimentary deposits, and not on any identified encompassing shoreline features. Armitage et al. (Reference Armitage, Drake, Stokes, El-Hawat, Salem, White, Tunrer and McLaren2007) dated fine-grained deposits to the AHP at two sites along the Messak Sattafat escarpment (Figs. 9 and10) at altitudes of approximately 519 and 524 m asl. Nearby, Brooks et al. (Reference Brooks, Drake, McLaren and White2003) speculated about the presence of shoreline benches near the base of this escarpment at about 500 m. Both these studies interpreted these deposits and features as lacustrine, the basis for mega-Lake Fezzan.
Hill-shaded SRTM 3 arc-second digital elevation model (from 0 m asl [black] to 3400 m asl [white]) of the Fezzan region of southwest Libya. Black squares mark local towns and oases, and the cross-hatched polygon is the extent of Murzuq sand seas, based on Armitage et al. (Reference Armitage, Drake, Stokes, El-Hawat, Salem, White, Tunrer and McLaren2007). The toothed line marks the base of the Messak Saffafat escarpment. The solid line denotes the hydrographic limits of the basin. Dashed lines trace the 500 and 516 m asl elevations around the basin, where paleo-shorelines associated with paleo-mega-Lake Fezzan would have been approximately located (Armitage et al. Reference Armitage, Drake, Stokes, El-Hawat, Salem, White, Tunrer and McLaren2007). The black arrow marks the 516 m spillway location for the hydrographic basin. The white star just west of Awbari indicates the location shown in Fig. 10b and described in Armitage et al. (Reference Armitage, Drake, Stokes, El-Hawat, Salem, White, Tunrer and McLaren2007). The other white stars around Wadi al-Shati and Sabha mark other key study locations discussed in the text.

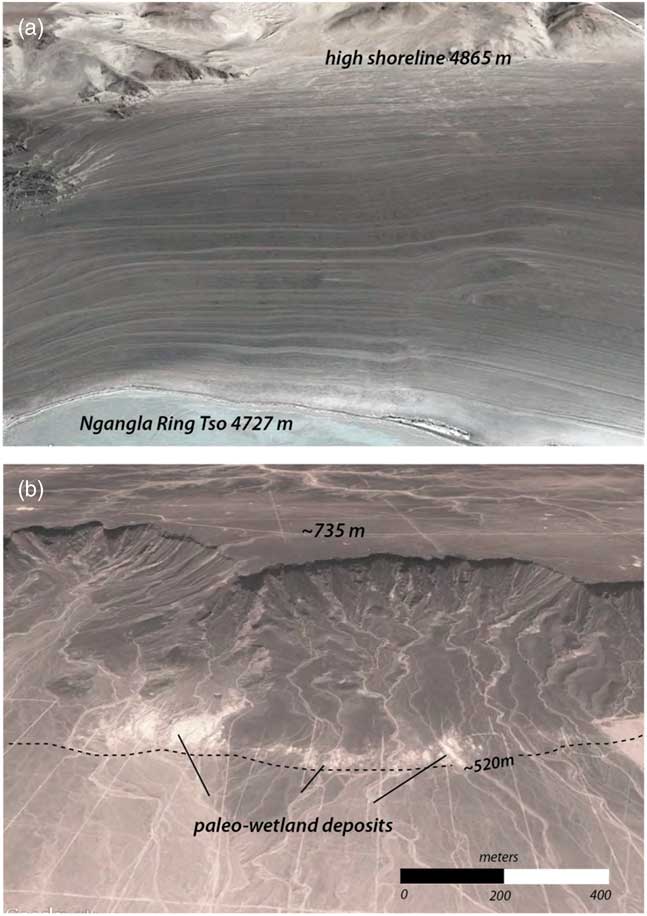
(color online) Landsat-8 images (a, natural color, RGB-432; b, gray tone) depicted at the same scale of (a) the margin of the Ngangla Ringtso basin in south-central Tibet (Fig. 1) once occupied by a large lake, ~135 m deep at its high stand and 3700 km2 in area. The lake high-stand shoreline is indicated and dates to 10.3–8.6 ka (Hudson et al., Reference Hudson, Quade, Huth, Lei, Cheng, Edwards, Olsen and Zhang2015). Typical lacustrine features include infilling and smoothing of topography below the high-stand shoreline that was later resculpted by successive paleo-shorelines as the lake receded between 8.5 to 4 ka. Although Tibet is much wetter than the Sahara, such preservation of early Holocene-age paleo-shorelines is quite typical (Hudson and Quade, 2013) in Tibet, despite some dune encroachment and postlacustrine dissection. (b) Messak Sattafat escarpment and adjacent alluvial apron in the Lake Fezzan basin, in the vicinity of the study sites of Armitage et al. (Reference Armitage, Drake, Stokes, El-Hawat, Salem, White, Tunrer and McLaren2007) in the basin. Dashed line denotes the approximate trace of the 520 m asl elevation where paleo-shorelines should be preserved if mega-Lake Fezzan had been present. None of the diagnostic features of large lake systems shown in (a) are visible in this scene. Instead of paleo-shorelines developed on smoothed lacustrine topography, drainage networks are well preserved on the escarpment and alluvial slopes. Paleo-Lake Fezzan would have been about the same depth (250–275 m) but 30 to 50 times bigger than Ngangla Ringsto at its high stand, and thus should have been capable of generating significantly greater wind power for shoreline formation. Bright white areas are probable GWDs similar to those described nearby by Armitage et al. (Reference Armitage, Drake, Stokes, El-Hawat, Salem, White, Tunrer and McLaren2007).

Our DEM analysis reveals that today the basin could fill with water to 516 m asl before spilling to the northeast, creating a lake ~270 m in depth and 126,500 km2 in area (Fig. 9). A lake filled to 516 m asl could submerge all the features described in Armitage et al. (Reference Armitage, Drake, Stokes, El-Hawat, Salem, White, Tunrer and McLaren2007) and Brooks et al. (Reference Brooks, Drake, McLaren and White2003), after correction for post–lake surface rebound (e.g., Bills et al., Reference Bills, Adams and Wesnousky2007). Mega-Lake Fezzan at 516 m asl would have been 1.5 times the size of modern Lake Superior.
As we have argued with examples in previous sections, megalakes of this size should have produced conspicuous shorelines on the many colluvium-covered hillslopes, alluvial fans and bedrock surfaces intersected by the ~500 and 516 m asl shorelines. As far as we know, no such evidence has been mapped or published, nor can we see evidence of shoreline features in Landsat/Copernicus imagery or DEMs at these elevations. The absence of shoreline features is especially conspicuous along the north-facing Messak Sattafat escarpment (Fig. 10b), where significant wave action, built over its >100-km-long fetch, would have intersected the base of the escarpment. A megalake would have completely resculpted these hillsides by cutting shorelines and burying pre-lake drainages, as is visible at Ngangla Ring Tso in Tibet (Figs. 1 and 10a). Subsequent erosion has not obscured/reworked these shorelines in Tibet, despite yearly torrential monsoonal rains, in sharp contrast to the post-AHP hyperaridity of the central Sahara. Instead of shorelines, a well-preserved network of paleodrainages cut into bedrock and alluvium is visible between 500 and 516 m asl all along the Messak Sattafat escarpment, as illustrated in Figure 10b. In short, there is no clear evidence of megalakes in this area during the last 30 ka.
Instead, several lines of evidence point to the fine-grained deposits and shell coquinas of the basin as GWDs, rather than lacustrine deposits. First, they have been identified in areas of near-surface or actively discharging ground-water. Springs discharge today along the base of the Messak Sattafat escarpment, as well as on the north side of the basin along the Wadi al-Shati (Fig. 9), where shell coquinas have been documented by several researchers (Gaven et al., Reference Gaven, Hillaire-Marcel and Petiti-Maire1981; Thiedig et al., Reference Thiedig, Oezen, El-Chair and Geyh2000). Moreover, the “lake” deposits sampled by Armitage et al. (Reference Armitage, Drake, Stokes, El-Hawat, Salem, White, Tunrer and McLaren2007) at 524 m asl appear to be springs and wetland deposits, some localized along short faults at the base of the Messak Sattafat escarpment (Fig. 10b). Localized deposits along faults or at the base of escarpments is a very common context for GWDs (Quade et al., Reference Quade, Mifflin, Pratt, McCoy and Burckle1995; Pigati et al., Reference Pigati, Miller, Bright, Mahan, Nekola and Paces2011).
It is important to acknowledge that the radiometrically dated coquinas and other aquatic carbonates in the basin appear to be >40 ka (Gaven et al., Reference Gaven, Hillaire-Marcel and Petiti-Maire1981; Theidig et al. 2000), when preservation of shorelines should be diminished. Nonetheless, we would urge caution in interpreting every fine-grained and aquatic fauna–rich deposit in the pre-AHP record as lacustrine, inasmuch as such deposits are not demonstrably lacustrine in the AHP.
Mega-Lake Chotts
Mega-Lake Chotts inscribes a ~30,000 km2 area thought to have once filled a series of the dry lake basins (or “chotts”) in southern Tunisia and northeast Algeria (Fig. 2). The proposed lake overflowed eastward into the Mediterranean Sea across a sill ~+45 m asl. Mega-Lake Chotts is viewed as part of an interconnected network of Saharan waterways that linked aquatic fauna and humans between sub-Saharan Africa and Mediterranean during the AHP and earlier interglacials. However, ages from this system are scant and based mostly on U-Th ages of mollusks, viewed by many (e.g., Kaufman et al., Reference Kaufman, Broecker, Ku and Thurber1971; Schwarcz and Gascoyne, Reference Schwarcz and Gascoyne1984) as highly unreliable due to open-system loss and uptake of radionuclides. The extent of the megalake was calculated using the overflow threshold at 45 m asl as the upper limit on its size (Drake et al., Reference Drake, Blench, Armitage, Bristow and White2011), a basin threshold confirmed by our DEM analysis.
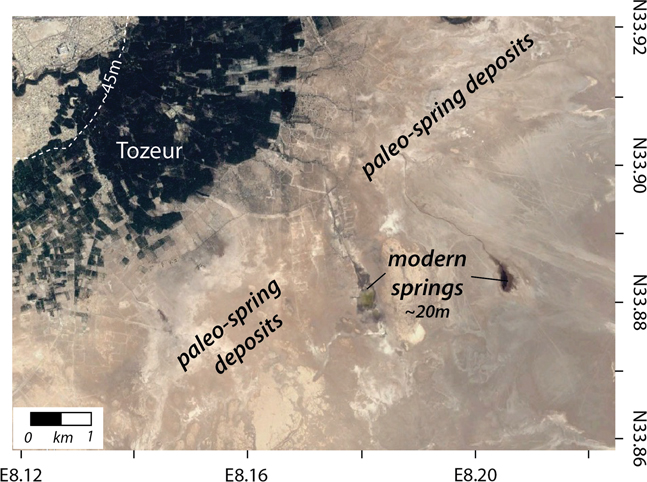
We examined much of the Chotts basin at and below the 45 m asl contour and found no evidence for paleo-shorelines (Fig. 11b) from a megalake 20–150 ka, like that proposed by Zouari et al. (Reference Zouari, Chkir and Causse1998) and Causse et al. (Reference Causse, Ghaleb, Chkir, Zouari, Ouezdou and Mamou2003). There are scattered outcrops below the 45 m asl elevation containing aquatic fauna that are interpreted as lacustrine (Zouari et al., Reference Zouari, Chkir and Causse1998). Such deposits are reported near Tozeur (Fig. 12), where springs and wetlands discharge into the basin today. Given the lack of paleo-shorelines, we suggest that these deposits are GWDs related to springs still active in the area today. Elsewhere, such as at Chott Rharsa, there is clear evidence for phreatic-playa/shallow-lake conditions alternating with cycles of eolian deposition 10–25 m below sea level (Blum et al, Reference Blum, Kocurek, Deynoux, Swezey, Lancaster, Price and Pion1998; Swezey et al., Reference Swezey, Lancaster, Kocurek, Deynoux, Blum, Price and Pion1999).
(color online) Landsat-8 images (a, gray tone; b, natural color, RGB-432) of (a) the margin of paleo-Lake Bonneville in central Utah, United States (Fig. 1) showing the high Bonneville shoreline (19–18 ka). Typical lacustrine features include burial and smoothing of topography below the high-stand shoreline that was later resculpted by successive paleo-shorelines as the lake receded between 16 and 13 ka. (b) The northern margin Chotts el Fejej basin in southern Tunisia (Figs. 1 and 2). The dashed line denotes the approximate trace of the 45 m asl elevation where the paleo–high stand shoreline of mega-Lake Chotts should be preserved had a lake been present. None of the diagnostic features of large lake systems shown in (a) are visible in this scene or around the basin. Instead of multiple paleo-shorelines developed on smoothed lacustrine topography, deep drainage networks are well preserved on the alluvial slopes south of the Douz Tozeur Mountains. Traces of faults that localize spring discharge are visible.

(color online) Landsat-8 (natural color, RGB-432) image of the Tozeur area on the north edge of Chott el Jerid, a part of the Chotts system in southern Tunisia (Fig. 2). Tozeur oasis is visible in the northwest quadrant of the image. Evidence for lake sediments thought to represent deposition in mega-Lake Chotts was described from this area south of Tozeur by Zouari et al. (Reference Zouari, Chkir and Causse1998). The approximate location of the 45 m asl elevation representing the paleo–high stand shoreline of mega-Lake Chotts had it been present are indicated with a dashed line. There are at least two active springs visible downslope of Tozeur, and many patches of white sediment. This association, along with the total lack of shoreline features below 45 m asl, suggests that the white patches are fossil GWDs. These are probably the kinds of deposits sampled by Zoauri et al. (1998) for aquatic shell and ostracods that were misinterpreted as lacustrine. The modern analog for this setting can be seen in Fig. 3a.

Mega-Lake Ahnet-Mouydir
The final proposed Saharan megalake is located in central Algeria in the Ahnet-Mouydir and nearby Touat basins (Fig. 2), which we refer to simply as paleo-Lake Ahnet. Conrad (Reference Conrad1969) and Conrad and Lappartient (Reference Conrad and Lappartient1991) attribute scattered outcrops up to 35 m thick of sands, limestone, argillites, and diatomites representing a “vast lacustrine cycle.” The deposits are rich in aquatic fauna, including aquatic bivalves (Cardium) and gastropods (Melanoides tuberculatus, Bithynia sp., assorted other Hydrobiids and Planorbids), ostracods, and diatoms, as well as fish, hippopotamus, and crocodile. Based on the faunal assemblages, Conrad and Lappartient (Reference Conrad and Lappartient1991) suggest an early Pleistocene age, although younger age deposits in the basin are also seen as possible. White-colored sediments do reach up to ~230 m asl in a few areas of the basin today, and perhaps these are the basis for projecting a megalake over the region at this minimum elevation, as described in Drake et al. (Reference Drake, Blench, Armitage, Bristow and White2011) (Fig. 13). Using Landsat/Copernicus images, we surveyed bedrock and alluvial areas around the rest of the basin and can see no evidence of paleo-shorelines at 230 m asl.
Hill-shaded SRTM 3 arc-second digital elevation model (from 100 m asl [black] to 3200 m asl [white]) of Ahnet-Mouydir basin in central Algeria (Fig. 2) showing the coarsely dashed outline of the minimum elevation of the paleolake projected by Drake et al. (Reference Drake, Blench, Armitage, Bristow and White2011) at 230 m asl, based on outcrops described by Conrad and Lappartient (Reference Conrad and Lappartient1991). No shorelines are apparent on Landsat images at this elevation. However, paleo-shorelines are visible at ~122 m asl, suggesting the presence of three lakes (finely dashed outline), covering a total ~600 km2 and <10 m deep, perhaps seasonally recharged from the nearby uplands.

However, weakly developed shorelines appear to be preserved around salt pans at several locations at about the 121–123 m asl level (Fig. 13). Three apparent lakes at these elevations would have been <10 m deep and ~600 km2 in total area, accounting for the weak development of the shorelines. Ephemeral lakes like this can develop on salt pans after heavy rains in tributary uplands, as seen in examples from the Mojave Desert (Enzel et al., Reference Enzel, Brown, Anderson, McFadden and Wells1992; Enzel and Wells, Reference Enzel and Wells1997).
In summary, we can find no strong evidence for large lakes in the Sahara except mega-Lake Chad. Outside of mega-Lake Chad, no clear shorelines have been positively documented, nor are they obvious in Landsat/Copernicus imagery. Other features of large lake systems also have not been described in published papers, such as beach shingles, wave-polished rock, large deltaic complexes, and tufas. The apparent lack of tufas encrusting shorelines or around sublacustrine spring vents is especially noteworthy. Most surface and ground water in the Sahara is of the Ca-HCO3 type and is therefore capable of forming carbonate, especially in dry climates such as in the Sahara, where evaporation and photosynthesis by lake margin plants should enrich lake water with respect to carbonate. For this reason, travertine and tufa are common around springs and paleo-springs in the Sahara (e.g., Pachur and Hoelzmann, Reference Pachur and Hoelzmann1991; Sultan et al., Reference Sultan, Sturchio, Hassan, Hamdan, Alfy and Stein1997). Except perhaps in a few cases, such as around Selima Oasis (Haynes et al., Reference Haynes, Eyles, Pavlish, Ritchie and Rybak1989), the lack of mention of tufa-encrusting shoreline benches and beach gravels, diagnostic features of many paleolakes, is significant additional evidence against the presence of large lakes.
Insights from hydrologic mass balance of megalakes
In this section, we examine the paleo-climatic conditions required to sustain megalakes in the Sahara during the AHP and earlier wet phases. The global distribution of modern megalakes provides a useful qualitative starting point for discussion. The world’s largest lakes, ones comparable in size to the proposed Saharan megalakes, are mostly located in the Northern Hemisphere, >40°N or within 15° of the equator. For example, the Caspian Sea and Lake Baikal in Asia, and the Great Lakes system (244,000 km2) in North America are sustained by rainfall generally >1 m/yr over large catchments and by modest evaporation rates due to low average annual temperatures. Extant megalakes in Africa, which include Victoria, Tanganyika, and Malawi, have catchments falling almost entirely within 15° of the equator and experience high rainfall (>1 m/yr) and modest evaporation rates (<1–1.5 m/yr) due to their elevation, high humidity, and cloud cover. Lake Victoria covers 68,800 km2 (84,000 km2 where closed; see “Boundary conditions of Lake Victoria” section), bracketed in area by Saharan mega-Lakes Chad (345,000 km2), Fezzan (125,000 km2), Darfur (32,300 km2), Ahnet (31,370 km2), and Chotts (30,000 km2). This comparison gives a qualitative sense of the profound hydrologic and climatic changes required to produce megalakes in the Sahara.
We can more quantitatively explore the rainfall and temperature requirements necessary to sustain Saharan megalakes during the AHP through hydrologic mass-balance models (Kutzbach, Reference Kutzbach1980; Coe, Reference Coe1997; Hoelzmann et al., Reference Hoelzmann, Kruse and Rottinger2000). The basic principle is that inputs from precipitation onto a closed basin (partly then converted to runoff and ground-water recharge) must equal output through evaporation and evapotranspiration from the lake and land to maintain the lake level at steady state and thus form a shoreline (Kutzbach, Reference Kutzbach1980). Paleo-rainfall can be estimated using a basic hydrologic mass-balance model for a closed-basin lake.
 $$P\;{\equals}\;E_{{\rm W}}\,{\asterisk}\,a_{{\rm W}} {\plus}E_{{\rm L}}\,{\asterisk}\,a_{{\rm L}} $$
where P is precipitation rate over the entire basin; E W and E L the evaporation rates from the lake and land surface, respectively; and a W and a L represent the fractional area of the basin covered by water and land, respectively. The fractional lake area is expressed as a W =A W/(A W + A L )=A W /A bt, where A W is the area of the lake, A L is the area of the basin excluding the lake, and A bt is the area of the basin and lake.
Evaporation from a basin is a function of a variety of parameters. One is lake area, which in ancient systems can be measured from the extent of paleo-shorelines. Other controls on evaporation must be measured or estimated, such as temperature, cloudiness, relative humidity, windiness, and the nature and extent of vegetation covering the catchment that intercepts rainfall and returns it to the atmosphere by evapotranspiration (E L). Evapotranspiration is in turn related to the fraction of rainfall falling on the catchment that is converted to runoff, through:
 $$k\;{\equals}\;1{\minus}\left( {E_{{\rm L}} \,/\,P} \right)$$
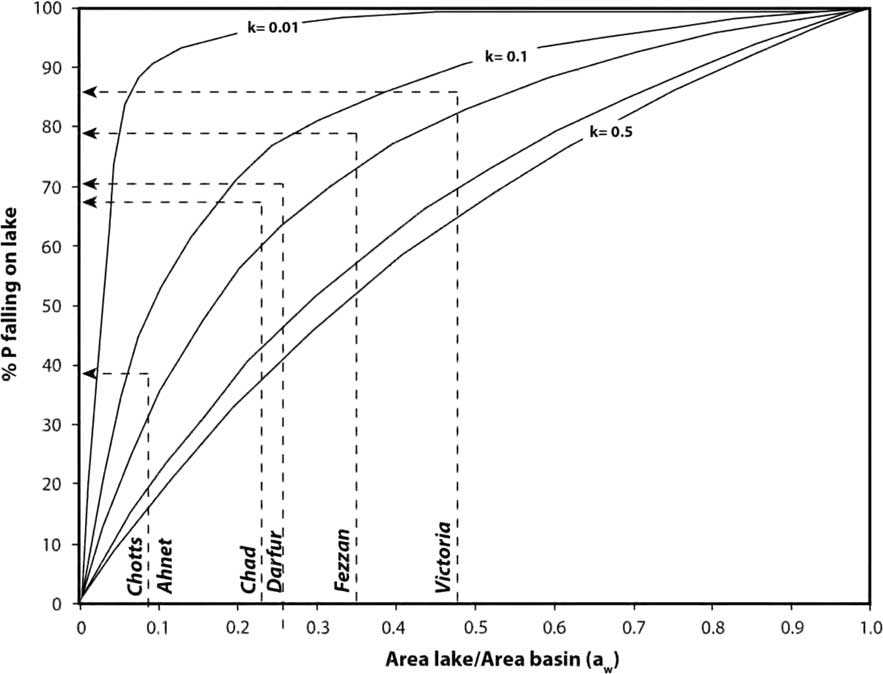
where k is the runoff coefficient. In systems in which lake areas are small relative to basin area (a w<0.1), most water reaches the lake as runoff rather than as direct rainfall onto the lake. In this case, small uncertainties in the estimate of k lead to large uncertainties in the paleo-precipitation estimate. This would pertain to mega-Lakes Chotts and Ahnet, where a w =0.09. Mega-Lakes Fezzan and Darfur have high a w values (0.26 to 0.34; Figs. 2 and 14, Table 2), meaning that k would have been small (we estimate <0.2) compared with evaporation (E w) and rainfall onto the lake itself. E w can generally be estimated with more confidence than k.
Graph showing a w (area lake/area basin, A W/A L) versus percent precipitation (P) falling directly onto the lake as a function of runoff coefficient, k. Measured a w and calculated percent precipitation (P) also shown for Lake Victoria and Saharan megalakes. All these systems probably had k<0.20, the upper limiting value for Lake Victoria. Assuming k=0.15 on this graph, mega-Lakes Victoria, Fezzan, and Darfur were largely sustained by rainfall falling directly on the lake surfaces, whereas the Chotts and Ahnet systems would have been dominated by runoff.

What are the modern climatic conditions required to sustain a hypothetical closed surface area of 30–125,000 km2 in the East African Rift and Sahara? To answer this, we turn to a comparison of hydrologic lake budgets of Lake Victoria in East Africa and the artificial Lake Nasser in the eastern Sahara. Lake Nasser offers an example of the hydroclimatic requirements for sustaining a lake in the presence of the hot, dry, and windy climate of the Sahara today. These conditions would place upper limits on paleo-rainfall required to sustain megalakes. Lake Victoria offers an alternative example of a lake in a climate unlike the Sahara today, where feedbacks from denser vegetation, higher humidity, and local lake effects significantly alter E w and hence the reconstruction of P. As we will argue, Lake Victoria provides lower limits on paleo-rainfall required to sustain megalakes in the Sahara.
Boundary conditions of Lake Nasser
Lake Nasser is an artificial lake created by impoundment of the Nile by the Aswan Dam and is sustained almost entirely by Nile flow; local rainfall and runoff into the lake from the surrounding catchment are negligible. Evaporative losses from Lake Nasser are estimated to be in the range 2.1–2.7 m/yr (Omar and El-Bakry, Reference Omar and El-Bakry1981; Elsawwaf et al., Reference Elsawwaf, Willems, Pagano and Berlamont2010), similar to evaporation rates from other dryland water bodies such as Lake Chad (2.2 m/yr) and Lake Mead, United States (2.3 m/yr). To raise and maintain a lake in the Sahara today solely by rainfall onto the lake (rather than Nile discharge, as in the case of Lake Nasser) would therefore require rainfall of 2–3 m/yr (Supplementary Table S2). This high value reflects the high mean annual air temperatures (24.7°C), low annual cloud cover (<10%), strong winds (4–5 m/s), and low relative humidity (13% in May, 37% in December) of the eastern Sahara (Omar and El-Bakry, Reference Omar and El-Bakry1981) (Supplementary Table S2). We can therefore assume that 2–3 m/yr serves as an upper limit for the rainfall required to sustain lakes with high a w in the Sahara.
Boundary conditions of Lake Victoria
A lower limiting value on Saharan rainfall during the AHP is provided by Lake Victoria, which straddles the equator at 1300 m asl, is 68,800 km2 in area (Yin and Nicholson, Reference Yin and Nicholson1998; confirmed by our DEM analysis), and occupies a basin with a catchment area of ~180,000 km2, yielding an a w of 0.378. However, Lake Victoria overflows into the White Nile, and for comparison to closed Saharan lakes we must estimate from published discharge records what the lake size would be if all losses (actual evaporation plus overflow) were by evaporation. This yields an estimated surface area for a hydrographically closed Lake Victoria of ~84,000 km2, and a w =0.47 (Supplementary Table S1).
The hydroclimate of the Lake Victoria basin has been fairly well characterized in a series of studies such as Kite (Reference Kite1982), Hastenrath and Kutzbach (Reference Hastenrath and Kutzbach1983), Howell et al. (Reference Howell, Lock and Cobb1988), Yin and Nicholson (Reference Yin and Nicholson1998), and Swenson and Wahr (Reference Swenson and Wahr2009). These studies estimate catchment mean annual rainfall to be ~1.35 m/yr, in a closed basin balanced by losses by lake (>80%) and land evaporation and evapotranspiration (<20%). This is very close to our modeled estimate for basin-wide rainfall of ~1.28 m/yr (Supplementary Table S1). Large water bodies such as Lake Victoria create their own local climate, with important effects on evaporation rates and the hydrologic budget. At Lake Victoria, strong heating and evaporation of lake water create stratocumulus clusters over the lake and abundant nightly rainfall. This “lake effect” increases rainfall over the lake by 25–30% compared with surrounding land areas (Yin and Nicholson, Reference Yin and Nicholson1998). Besides increasing local rainfall and cloud cover, lake evaporation also increases local relative humidity. The combined effect is suppressed evaporation rates and enhanced local rainfall due to the presence of large bodies of water. This means that significantly less rainfall is required to create large lakes because of the way they recycle much of their own moisture, compared with desert lakes such as Nasser, far removed from the moist recharge areas of the White and Blue Nile.
Modeling Saharan megalakes
To model the paleohydrology of the proposed Saharan megalakes, we can work from the same set of hydrologic models tested and verified for Lake Victoria by Yin and Nicholson (Reference Yin and Nicholson1998), adjusting them (Supplementary Table S3) for differences in lake size and probable paleo-climate in the Sahara during the AHP. Because the Sahara is at lower elevation but at a higher latitude, the net effect is a slight increase in probable mean annual temperature during the AHP, from 22.3°C at Lake Victoria today to 23°C in the Sahara in the AHP. Most other parameters from the Lake Victoria model were left untouched, recognizing that cloudiness and relative humidity were certainly much higher in the Sahara during the AHP, due to more plant cover, more rainfall, strong evaporation from the surface of lakes and wetlands, and evapotranspiration from land. This is consistent with coupled-model simulations that also incorporate these feedbacks to simulate AHP climate (e.g., Braconnot et al., Reference Braconnot, Harrison, Kageyama, Bartlein, Masson-Delmotte, Ade-Ouchi, Otto-Bliesner and Zhao2012). So, for example, we assume 65% cloud cover and 67% relative humidity for Saharan climate near the megalakes, much higher than average values for the Sahara today. We did not increase average annual wind-speed in the AHP in the Sahara relative to modern Lake Victoria (1.5 m/s), although it is probably warranted, because seasonally the Sahara experiences strong winds. These combined assumptions make our estimate of E w conservative with respect to predicted rainfall, and substantially reduce E w in the Sahara (to ~1.4–1.8 m/yr) during the AHP, compared with E w of 2–3 m/yr today, as at Lake Nasser. We also adopt the same E L from the Victoria basin, a conservative approach because of the sandy nature of Saharan soils, which would tend to absorb rainfall more efficiently than clay-rich volcanic soils of the East African Rift. The Saharan megalakes would differ in that their a w values are lower (<0.34) than for a closed Lake Victoria (0.47).
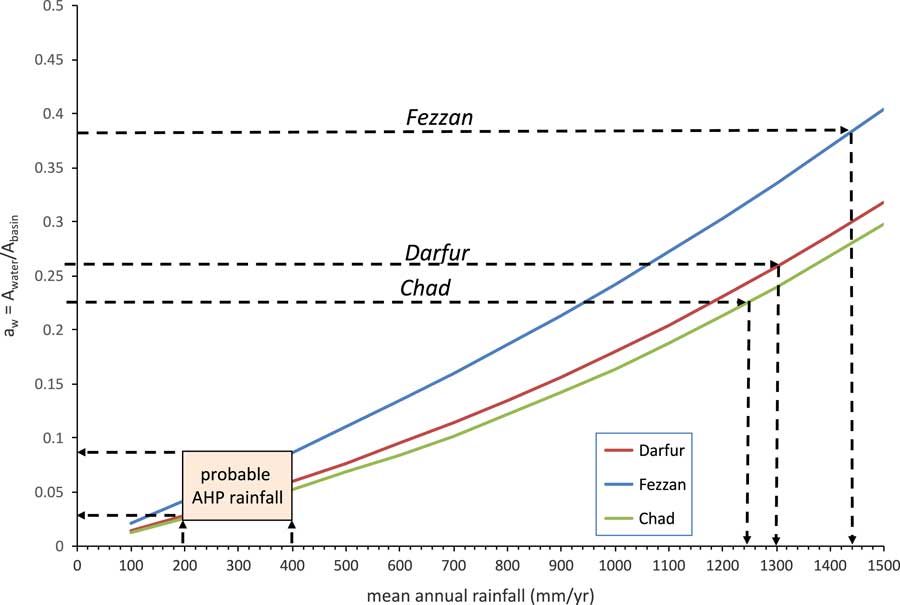
Using these conservative conditions (i.e., erring in the direction that will support megalake formation), our hydrologic models for the two biggest central Saharan megalakes (Darfur and Fezzan) require minimum annual average rainfall amounts of ~1.1 m/yr to balance moisture losses from their respective basins (Supplementary Table S1). Lake Chad required a similar amount (~1 m/yr; Supplementary Table S1) during the AHP according to our calculations, but this is plausible, because even today the southern third of the Chad basin receives ≥1.2 m/yr (Fig. 2) and experiences a climate similar to Lake Victoria. A modest 5° shift in the rainfall belt would bring this moist zone northward to cover a much larger portion of the Chad basin, which spans N13°±7°. Estimated rainfall rates for Darfur and Fezzan are slightly less than the average of ~1.3 m/yr for the Lake Victoria basin, because of the lower a w values, that is, smaller areas of Saharan megalakes compared with their respective drainage basins (Fig. 15). We did not attempt rainfall reconstruction for Ahnet and Chotts because of the high uncertainty in the term E L, which dominates the calculation of P in such low a w systems. In summary, our model calculations indicate that mega-Lakes Darfur and Fezzan in the central Sahara would have required major increases in rainfall from <50 mm/yr in the driest areas today to at least 1.1 m/yr during the AHP, and northward displacement of equatorial and subequatorial climates by 8–10°.
Graph of mean annual rainfall (mm/yr) versus a w (area lake/area basin, A W/A L) ; their modeled relationship using our Sahelo-Sudanian hydrologic model for the different lake basins are shown as solid colored lines. Superimposed on this (dashed lines) are the a w values for individual megalake basins and the mean annual rainfall required to sustain them. Mean annual paleo-rainfall estimates of 200–400 mm/yr during the AHP from fossil pollen and mollusk evidence is shown as a tan box. The intersection of this box with the solid colored lines describes the resulting a w for Saharan paleolakes on the y-axis. The low predicted values for a w suggest that very large lakes would not form under Sahelo-Sudanian conditions where sustained by purely local rainfall and runoff. (For interpretation of the references to color in this figure legend, the reader is referred to the web version of this article.)

Estimates of paleo-rainfall during the AHP
Published estimates of paleo-rainfall during the AHP vary rather widely in the Sahara, but in general they are considerably lower than the ≥1.1 m/yr from our estimates required to sustain megalakes, calling into question their existence. Tierney et al. (Reference Tierney, Pausata and deMenocal2017; and see also Hély et al., 2014) estimate an average rainfall rate during the AHP of 640 mm/yr +1670/−250 (1σ) from analysis of n-alkanes obtained off the west coast of Africa. Paleo-rainfall estimates from other evidence tend to fall on the lower side of this range, ~500 mm/yr or less, depending on latitude. For example, paleo-vegetation reconstruction using fossil pollen from many sites in the Sahara during the AHP presents a clear picture of grassy Sahelian steppe at low elevations and xerophytic woods/scrub with pockets of forest at higher elevations, such as the Tibesti and Hoggar Mountains (Ritchie et al., Reference Ritchie, Eyles and Haynes1985; Ritchie and Haynes, Reference Ritchie and Haynes1987; Kröpelin et al., Reference Kröpelin, Vershuren, Lezine, Eggermont, Coquyt, Francus and Cazet2008; summarized in Jolly et al.,Reference Jolly, Prentice, Bonnefille, Ballouche, Bengo, Brenac and Buchet1998; Peyron et al., Reference Peyron, Jolly, Braconnet, Bonnefille, Guiot, Wirrman and Chalie2006). The belt of Sahelian steppe that bounds the southern edge of the Sahara today at about 15°N is sustained by 200–300 mm/yr of rainfall. This would have been the minimum amount needed to expand Sahelian steppe across the southern part of the Sahara, as required by the pollen evidence (Jolly et al., Reference Jolly, Prentice, Bonnefille, Ballouche, Bengo, Brenac and Buchet1998). Jolly et al. (Reference Jolly, Prentice, Bonnefille, Ballouche, Bengo, Brenac and Buchet1998) and Watrin et al. (Reference Watrin, Lézine and Hely2009) show that hot-desert biomes dominated the latitudes of the central and northern Sahara above ~23°N in the AHP. Humid-adapted species from tropical forests and wooded grasslands are represented in some sites in the Sahara during the AHP, but Watrin et al. (Reference Watrin, Lézine and Hely2009) emphasized that these represent isolated gallery forest formation along perennial watercourses. And so there is no palynologic evidence from the Sahara, except in a few riparian areas, for the kind of subtropical to tropical savannahs mixed with evergreen (at higher elevations) to semideciduous forest that characterize the Lake Victoria drainage basin today (Kendall, Reference Kendall1969). In short, none of the palynological evidence is compatible with >1.2 m/yr rainfall rates that paleohydrological modeling indicates are needed to sustain megalakes.
Modest, not extreme, increases in paleo-rainfall during the AHP are also supported by the presence of the fossil land snail Limicolaria kambeul chudeaui in both the western and eastern Sahara up to 20°N. Today this species is common in southern Sahelian mixed forest/steppe 500 km south of the fossil localities, where rainfall is ~300 mm/yr (Haynes and Mead, Reference Haynes and Mead1982). Furthermore, Lézine et al. (Reference Lézine, Hély, Grenier and Braconnot2011), in their summary of lacustrine and lacustrine-like environments, indicate that the largest change during the AHP in their frequency was centered over 18–22°N (i.e., the change is largely minimal farther north). These observations indicate that increase in rainfall during the AHP at latitudes >22–23°N was small, where the basins encompassing paleo-Lakes Fezzan (N27°±3°), Ahnet (N26°±2°), and Chotts (N33°±3°) lie.
Our hydrologic models (Supplementary Table S3) can be run for the Sahelo-Sudanian climatic conditions suggested by pollen and fossil snail evidence for the Sahara, the more realistic framework for reconstructing paleo-rainfall than the dry and wet extremes of Lakes Nasser and Victoria, respectively. Key changes compared with the Lake Victoria model would be modest increases (2°C) temperature, and decreases in cloud cover to typical Sahelo-Sudanian values of ~30–40% (Supplementary Table S3). Combined, these changes increase basin evaporation rates, requiring paleo-rainfall amounts in the range of 1.2 to 1.5 m/yr to sustain lakes the size of Fezzan and Darfur (Fig. 15, Supplementary Table S3).
Here major contradictions develop between the model outcomes and paleo-vegetation evidence, because our Sahelo-Sudanian hydrologic model predicts wetter conditions and therefore more tropical vegetation assemblages than found around Lake Victoria today. In fact, none of the very wet rainfall scenarios required by all our model runs can be reconciled with the relatively dry conditions implied by the fossil plant and animal evidence. In short, megalakes cannot be produced in Sahelo-Sudanian conditions past or present; to form, they require a tropical or subtropical setting, and major displacements of the African monsoon or extra-desert moisture sources.
This general conclusion matches the more global pattern of large-lake formation in desert areas insofar as recharge from wetter areas external to the desert is generally required to create and support them. Classic modern examples are the Caspian and Aral Seas in central Asia, enormous desert lakes fed almost entirely by rainy regions far to the north (Caspian Sea fed by the Volga River) or mountainous east (Aral Sea fed by the Amu and Syr Darya). Paleolake examples of desert lakes fed in the past by wetter latitudes or altitudes include Lake Eyre/Lake Mega-Frome in Australia (Cohen et al., Reference Cohen, Nanson, Jansen, Jones, Jacobs, Treble and Price2011), the Owens River (Owens–Searles–Panamint–Death Valley) system in the United States (Hollett et al., Reference Hollett, Danskin, McCaffrey and Walti1991), the Lake Titicaca–Uyuni system in Bolivia (Placzek et al., Reference Placzek, Quade and Patchett2006), Lake Lahontan in the Great Basin, United States, and paleo-mega-Lake Makgadikgadi in Botswana (Burrough et al., 2009). Not all large desert lakes, however, rely on far-removed sources, some examples being the internally drained pluvial lakes of the central and northern Great Basin and in central Tibet. Modern climates in these regions lie much closer to the threshold of large-lake formation than the Sahara. Colder (~7°C lower than present) temperatures and a modest precipitation increase of 1.9-fold, with a large component of mountain snow, produced and sustained the Great Basin pluvial lakes during the last deglacial period (Barth et al., Reference Barth, Boyle, Hatchett, Bassett, Garner and Adams2016). In Tibet, an ~1.6-fold increase in rainfall was sufficient to sharply expand lakes in central Tibet during the early Holocene (Huth et al., Reference Huth, Hudson and Quade2015). By contrast, our analysis indicates that the current Saharan climate (<100 mm/yr) is much further removed than the modern climates of the Great Basin or Tibet from the rainfall threshold of >1.2 m/yr—a >12-fold increase in rainfall—required to sustain megalakes.
Model-data discrepancies
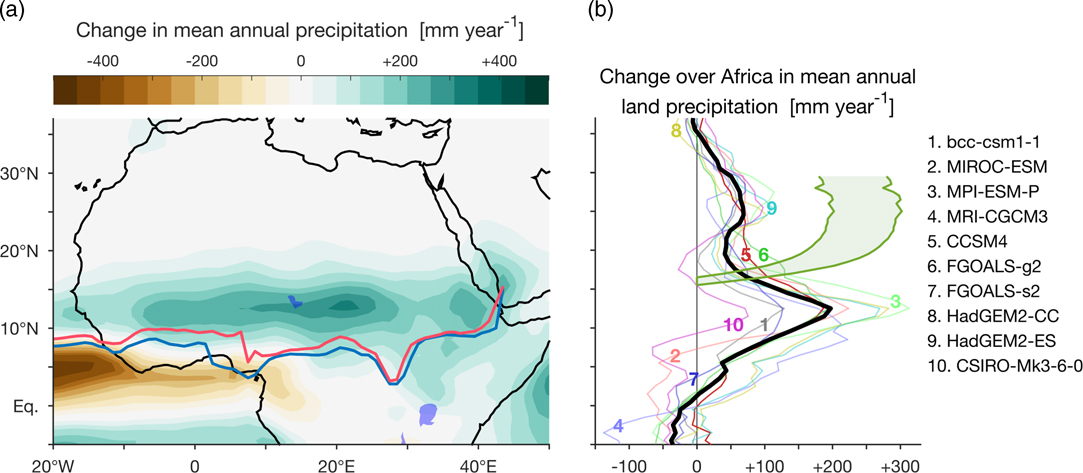
Most comprehensive climate models also fail to produce the high rainfall required to sustain Saharan megalakes, even where feedbacks are included (for a review, see Claussen et al., Reference Claussen, Dallmeyer and Bader2017). The tendency of the tropical rain belt to migrate toward the differentially warming hemisphere (Chiang and Friedmann, Reference Chiang and Friedman2012, Schneider et al., Reference Schneider, Bischoff and Haug2014) and the increased Northern Hemisphere summer insolation during AHP due to summer solstice coinciding with perihelion, provide a compelling argument for attributing the AHP to variations in Earth’s orbital parameters. This has been the starting point of many modeling studies of the AHP, most notable of which is the Palaeoclimate Modelling Intercomparison Project (PMIP; Fig. 16). However, modern climate models forced by AHP insolation underestimate the Saharan precipitation changes required to sustain megalakes across northern Africa, as can be seen by comparing Figures 2 and 16 (cf. Joussaume et al., Reference Joussaume, Taylor, Braconnot, MItchell, Kutzbach, Harrison and Prentice1999). This underestimation may reflect the fact that regional changes in the ITCZ position are not constrained by the interhemispheric heating imbalance (Adam et al., Reference Adam, Bischoff and Schneider2016). Local mechanisms have been shown to inhibit the poleward migration of the ITCZ during the AHP, in support of relatively modest estimates of the precipitation changes. Prime examples of these are the “monsoon–desert mechanism,” which links the intensification of the Indian monsoon to enhanced descent over northern Africa and hence drying (Rodwell and Hoskins, Reference Rodwell and Hoskins1996), and the “ventilation mechanism,” in which the decreased relative humidity of the warming Sahara limits convection there (Su and Neelin, Reference Su and Neelin2005).
Change in mean annual precipitation over northern Africa between mid-Holocene (6 ka) and pre-industrial conditions in PMIP3 models (affiliations are provided in Supplementary Table S4). Lakes Victoria and Chad outlined in blue. (a) Ensemble mean change in mean annual precipitation and positions of the African summer (July–September) ensemble mean ITCZ during mid-Holocene (solid red line) and pre-industrial conditions (solid blue line). (b) Zonal average of change in mean annual precipitation over land (20°W–30°E) for the ensemble mean (thick black) and individual models are listed on right). The range of minimal estimated change in mean annual precipitation required to sustain steppe is shown in shaded green (Jolly et al., 1998). (For interpretation of the references to color in this figure legend, the reader is referred to the web version of this article.)

The most humid models of the third phase of PMIP simulate an increase in precipitation not exceeding 100 mm/yr in the middle of the current Sahara, compared with a minimal 200 mm/year required to sustained Sahelian steppe (Jolly et al., Reference Jolly, Prentice, Bonnefille, Ballouche, Bengo, Brenac and Buchet1998). The mean poleward shift of the summer ITCZ in these models is less than 2° (Fig. 16), far short of the 8–10° northward shift required to sustain megalakes. The inclusion of ocean (e.g., Kutzbach and Liu, Reference Kutzbach and Liu1997), surface vegetation, and water-body feedbacks (e.g., TEMPO, 1996; Lézine et al., Reference Lézine, Hély, Grenier and Braconnot2011) has been shown to increase the precipitation response to orbital forcing, but not by the 3- to 10-fold required to sustain megalakes in the Sahara.
IMPLICATIONS AND CONCLUDING THOUGHTS
Megalakes are thought to represent important links in the chain of aquatic environments that formed a connected aquatic corridor of water across the Sahara during wet periods. In this paper, we question the existence of these large lakes (except Lake Chad) and the concept of continuous aquatic corridors across the Sahara during the AHP. We challenge the geologic community to critically reexamine, using the list of geologic criteria laid out this paper, whether megalakes or large lakes of any description once existed in the Sahara.
Other elements of the proposed aquatic linkage across the Sahara are more abundant wetlands and springs, which certainly existed in the AHP, and ancient watercourses. Much compelling evidence has been published on the “radar river” systems in the Sahara (Robinson et al., Reference Robinson, El-Baz, Ozdagan, Lewith, Banco, Oakley and Inzana2000; Paillou et al., Reference Paillou, Schuster, Tooth, Farr, Rosenqvist, Lopez and Malezieux2009; Skonieczny et al., Reference Skonieczny, Paillou, Bory, Bayon, Biscara, Crosta and Eynaud2015), and some (e.g., Osborne et al., Reference Osborne, Vance, Rihling, Barton, Rogerson and Fello2008; Drake et al., Reference Drake, Blench, Armitage, Bristow and White2011; Coulthard et al., Reference Coulthard, Ramirez, Barton, Rogerson and Brücher2013) argue that they were occupied by perennial flow, part of the uninterrupted fresh-water corridor across much of the Sahara. Perennial flow of any age would leave many telltale paleontological signs, such as crocodile, hippopotamus, aquatic gastropod, and ostracod remains in fluvial channel sands associated with the radar rivers. There have been a few field investigations of radar river deposits (McCauley et al., Reference McCauley, Schaber, Breed, Grolier, Haynes, Issawi, Elachi and Blom1982; McHugh et al., Reference McHugh, Breed, Schaber, McCauley and Szabo1988; Szabo et al., Reference Szabo, McHugh, Schaber, Haynes and Breed1989), and there is no evidence of perennial flow from these studies. In our view, the hydrologic character of radar river systems in the Sahara needs much more evaluation on the ground, following the example of such studies as McCauley et al. (Reference McCauley, Schaber, Breed, Grolier, Haynes, Issawi, Elachi and Blom1982); and we should remain open to the idea that they formed largely by flow of ephemeral, not perennial, water flow. However, we do not advocate that a paler green Sahara was necessarily an effective barrier to human migrations during the AHP or earlier wet periods. Prehistoric modern humans were well adapted to the highly discontinuous aquatic habitats of the deserts of the Great Basin in the United States, central Australia, the southern Levant, the central Andes, and other dry regions, and we see no reason why they would not have been similarly adapted to a semi-arid (but not hyperarid <<50 mm/yr) Sahara during the AHP and earlier wet phases such as 117–130 ka.
We close with one final challenge for future research: If not megalakes, what size lakes, marshes, discharging springs, and flowing rivers in the Sahara were sustainable in Sahelo-Sudanian climatic conditions? For lakes and perennial rivers to be created and sustained, net rainfall in the basin has to exceed loss to evapotranspiration, evaporation, and infiltration, yielding runoff that then supplies a local lake or river. Our hydrologic models (see Supplementary Material) and empirical observations (Gash et al., Reference Gash, Wallace, Lloyd and Dolman1991; Monteith, Reference Monteith1991) for the Sahel suggest that this limit is in the 200–300 mm/yr range, meaning that most of the Sahara during the AHP was probably too dry to support very large lakes or perennial rivers by means of local runoff. This does not preclude creation of local wetlands supplied by ground-water recharge focused from a very large recharge area or forced to the surface by hydrologic barriers such as faults, nor megalakes like Chad supplied by moisture from the subtropics and tropics outside the Sahel. But it does raise a key question concerning the size of paleolakes, if not megalakes, in the Sahara during the AHP. Our analysis suggests that Sahelo-Sudanian climate could perhaps support a paleolake approximately ≤5000 km2 in area in the Darfur basin and ≤10,000–20,000 km2 in the Fezzan basin. These are more than an order of magnitude smaller than the megalakes envisioned for these basins, but they are still sizable, and if enclosed in a single body of water, should have been large enough to generate clear shorelines (Enzel et al., Reference Enzel, Kushnir and Quade2015, Reference Enzel, Quade and Kushnir2017). On the other hand, if surface water was dispersed across a series of shallow and extensive but partly disconnected wetlands, as also implied by previous research (e.g., Pachur and Hoelzmann, Reference Pachur and Hoelzmann1991), then shorelines may not have developed. We hope that the criteria laid out in this paper for identifying paleolake deposits will be applied in future paleohydrologic research in the Sahara, thereby establishing the true extent of standing paleo-water bodies during wet phases.
ACKNOWLEDGMENTS
This paper is an outgrowth of a graduate student seminar held in 2016–2017 at the Institute of Earth Sciences at the Hebrew University of Jerusalem. Without the energy and keen interest of all the participating students and colleagues, this paper would never have come about. We thank Rivka Rabinovich, Moti Stein, Yoni Goldsmith, and Michal Ben-Israel for their discussion and participation in the seminar. J. Quade received generous support from the Lady Davis Fellowship Trust during his stay at the Hebrew University, and his thanks go to Y. Enzel, A. Matmon, H. Affek, and E. Hovers (Hebrew University) and Mark Sopher (Lady Davis Fellowship Trust) for facilitating this. Y. Enzel thanks Israel Science Foundation (ISF) Center of Excellence—the Dead Sea Borehole (grant 1436/14). Landsat and SRTM data available from the U.S. Geological Survey.
SUPPLEMENTARY MATERIALS
To view supplementary material for this article, please visit https://doi.org/10.1017/qua.2018.46