Introduction
Antibiotics have been widely employed for decades as growth promoters in pig production to enhance zootechnical performance (Sung et al., Reference Sung, Deng and Kim2025). Increasing concerns regarding antimicrobial resistance and food safety, however, have led to restrictions regarding their use in several countries (Lee et al., Reference Lee, Choi, Joo, Baeg, Kim, Kim, Lee and Kim2024; Van Boeckel et al., Reference Van Boeckel, Glennon, Chen, Gilbert, Robinson, Grenfell, Levin, Bonhoeffer and Laxminarayan2017). This has intensified the search for natural feed additives capable of maintaining animal performance while still ensuring product safety (Gao et al., Reference Gao, Yang, Zhao, Tang, Jiang and Yin2022; Mei et al., Reference Mei, Li, Wu and He2024; Yang et al., Reference Yang, Chowdhury, Huo and Gong2015). Among available alternatives, plant-derived phenolic compounds have received considerable attention due to their biological properties, including antioxidant, anti-inflammatory, antimicrobial and immunomodulatory activities, that support pig gut health and performance (Gao et al., Reference Gao, Yang, Zhao, Tang, Jiang and Yin2022; Mahfuz et al., Reference Mahfuz, Shang and Piao2021; Mei et al., Reference Mei, Li, Wu and He2024; Yang et al., Reference Yang, Chowdhury, Huo and Gong2015). Within this group, flavonoids and tocopherols stand out as two major classes exhibiting distinct but potentially complementary mechanisms of action (Biswas and Kim, Reference Biswas and Kim2025; Keum et al., Reference Keum, Doo, Kwak, Sun, Cho and Kim2025; Proca et al., Reference Proca, Horodincu, Solcan and Solcan2024).
Flavonoids display prebiotic effects and selective antimicrobial activity, promoting increases in the abundance of beneficial bacteria, such as Bifidobacterium and Lactobacillus, while reducing the proliferation of potential pathogens (Pan et al., Reference Pan, Ye, Pi, Liu, Wang, Zhang and Zheng2023; Xiong et al., Reference Xiong, Lin, Chen, Ouyang and Wang2023; Yang et al., Reference Yang, Gao, Farag, Gong, Su, Cao, Zhang, Zhao and Wang2023). These compounds also modulate the production of short-chain fatty acids and other metabolites that influence nutrient absorption, lipid metabolism and energy homeostasis (Oteiza et al., Reference Oteiza, Fraga, Mills and Taft2018; Xiong et al., Reference Xiong, Lin, Chen, Ouyang and Wang2023; Zhou et al., Reference Zhou, Ma, Kang, Tang, Xia, Yin and Yin2023). In the intestine, they also contribute to epithelial barrier protection by regulating tight junctions and local inflammatory response, resulting in improved digestive efficiency and nutrient use (Oteiza et al., Reference Oteiza, Fraga, Mills and Taft2018; Xiong et al., Reference Xiong, Lin, Chen, Ouyang and Wang2023).
Tocopherols, lipid-soluble forms of vitamin E, act primarily as potent antioxidants, playing a key role in protecting cellular membranes against oxidative stress (Traber and Atkinson, Reference Traber and Atkinson2007; Trela-Makowej et al., Reference Trela-Makowej, Leśkiewicz, Kruk, Żądło, Basta-Kaim and Szymańska2022). These compounds function as peroxyl radical scavengers, interrupting the peroxidation of polyunsaturated fatty acids within lipid membranes (Traber and Atkinson, Reference Traber and Atkinson2007). They are also incorporated into the phospholipid bilayer, preferentially associating with regions rich in unsaturated lipids and structurally disordered domains, thus contributing to membrane stabilization (DiPasquale et al., Reference DiPasquale, Nguyen, Pabst and Marquardt2022). As a result, tocopherols limit damage caused by reactive oxygen species, phospholipases and hydrolytic products, preserving cellular and organelle membrane integrity, fluidity and functionality (Kagan, Reference Kagan1989; Traber and Atkinson, Reference Traber and Atkinson2007; Trela-Makowej et al., Reference Trela-Makowej, Leśkiewicz, Kruk, Żądło, Basta-Kaim and Szymańska2022).
In finishing pigs, oxidative stress and metabolic demands can negatively affect growth performance and meat quality traits, particularly lipid stability and colour parameters (Campbell et al., Reference Campbell, Crenshaw and Polo2013). In this context, dietary flavonoid and tocopherol supplementation has been investigated as a strategy to improve both productive performance and pork quality (Menci et al., Reference Menci, Khelil-Arfa, Blanchard, Biondi, Bella, Priolo, Luciano and Natalello2022; Muzolf-Panek et al., Reference Muzolf-Panek, Zaworska-Zakrzewska, Czech, Lisiak and Kasprowicz-Potocka2024; Rey et al., Reference Rey, Puig, Cardozo and Hechavarría2021; Zheng et al., Reference Zheng, Li, Yu, Luo, Huang, Zheng, Mao, Dai, Yu, Yan, Luo and He2024). Previous studies have reported feed intake, feed efficiency, carcass trait and meat characteristic effects, such as colour, lipid oxidation and tenderness (Guo et al., Reference Guo, Chen, Huang, Chen, Li, Yu, He, Luo, Yan and Zheng2022; Liu et al., Reference Liu, Peng, Chen, Ren, Zhu, Deng, Cui, Hu, He, Li, Zhu, Yin, He and Xiao2024; Zhang et al., Reference Zhang, Lu, Xue, Wu, Wen, Ding and Zhou2016).
Despite these findings, results remain inconsistent due to differences in experimental conditions and the sources and inclusion levels of these compounds. Moreover, no quantitative synthesis comparing flavonoid and tocopherols effect and identifying optimal inclusion levels for finishing pig diets is available to date, limiting the practical application of these additives in swine nutrition. In this context, this study aimed to perform a systematic review and meta-analysis to evaluate and compare dietary flavonoid and tocopherol effects on the zootechnical performance and meat quality of finishing pigs, also estimating optimal inclusion levels and identifying the most effective strategies for their use.
Materials and methods
Study design and protocol
A systematic review coupled to a meta-analysis was carried out to assess the effects of dietary phenolic compounds, specifically flavonoids and tocopherols, on the productive performance, carcass characteristics and meat quality of finishing pigs. The applied methodological approach followed Preferred Reporting Items for Systematic Reviews and Meta-Analyses (PRISMA) guidelines (Page et al., Reference Page, McKenzie, Bossuyt, Boutron, Hoffmann, Mulrow, Shamseer, Tetzlaff, Akl, Brennan, Chou, Glanville, Grimshaw, Hróbjartsson, Lalu, Li, Loder, Mayo-Wilson, McDonald, McGuinness, Stewart, Thomas, Tricco, Welch, Whiting and Moher2022), which provide a structured framework for the identification, selection and quantitative synthesis of scientific evidence. The review protocol comprised research question definition, eligibility criteria establishment, a systematic search of electronic databases, study screening and selection, relevant data extraction and organization, quality assessment of the included studies, and a statistical synthesis through meta-analysis and meta-regression models.
Literature search strategy
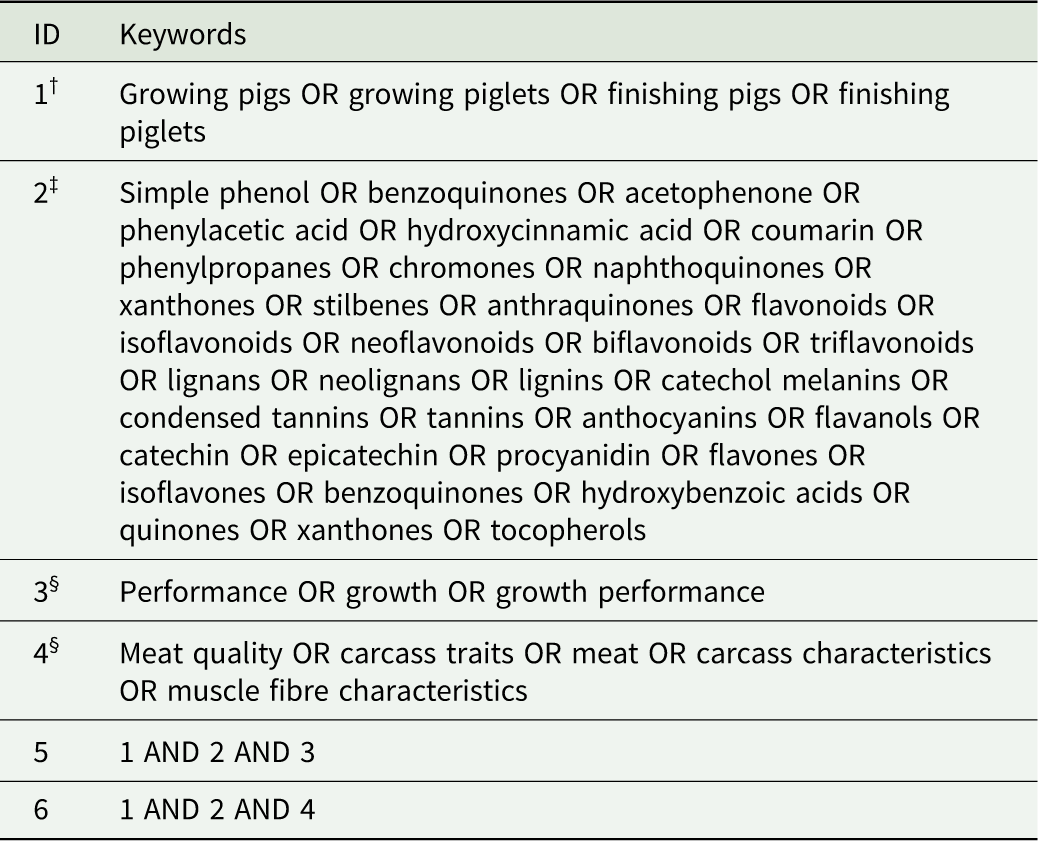
Primary studies published up to May 15, 2024, were identified through a systematic search carried out at four electronic databases, namely PubMed, Scopus, SciELO and Web of Science. The search strategy was developed based on the PICO framework (acronym for P: population/patients; I: intervention; C: comparison/control; O: outcome/result), adapted to animal production studies (Camargo et al., Reference Camargo, Cony, Silva, Franceschi and Andretta2023). Two independent searches were conducted to ensure comprehensive literature coverage, one focusing on productive performance outcomes and the other on carcass traits and meat quality parameters. Combinations of keywords related to pigs, phenolic compounds, flavonoids, tocopherols, performance, carcass traits and meat quality were used, combined through Boolean operators (“AND” and “OR”) to refine the search results. The complete search strategy and descriptor combinations applied in the database queries are presented in Table 1.
Database search strategy applied in this systematic review and meta-analysis

Table 1. Long description
A table detailing the search strategy used for a systematic review and meta-analysis. The table has six rows and two columns. The columns are labeled ID and Keywords. Row 1: ID 1, Keywords Growing pigs OR growing piglets OR finishing pigs OR finishing piglets. Row 2: ID 2, Keywords Simple phenol OR benzoquinones OR acetophenone OR phenylacetic acid OR hydroxycinnamic acid OR coumarin OR phenylpropane OR chromones OR naphthoquinones OR xanthones OR stilbenes OR anthraquinones OR flavonoids OR isoflavonoids OR neoflavonoids OR biflavonoids OR triflavonoids OR lignans OR neolignans OR lignins OR catechol melanins OR condensed tannins OR tannins OR anthocyanins OR flavanols OR catechin OR epicatechin OR procyanidin OR flavones OR isoflavones OR benzoquinones OR hydroxybenzoic acids OR quinones OR xanthones OR tocopherols. Row 3: ID 3, Keywords Performance OR growth OR growth performance. Row 4: ID 4, Keywords Meat quality OR carcass traits OR meat OR carcass characteristics OR muscle fibre characteristics. Row 5: ID 5, Keywords 1 AND 2 AND 3. Row 6: ID 6, Keywords 1 AND 2 AND 4.
Modified PICO method: †population; ‡intervention; §results.
Study selection and eligibility criteria
The study selection process was carried out in three sequential stages, consisting of title screening, abstract evaluation and full-text assessment of potentially eligible studies. The screening procedure was carried out independently by three reviewers to minimize selection bias and any disagreements were resolved by consensus. Duplicate records identified across the selected databases were removed prior to the screening process. Studies were considered eligible when they met the following criteria: publication in peer-reviewed scientific journals, full-text availability, experiments conducted with pigs in the growing or finishing phase, comparison between control diets and phenolic compound-supplemented diets and the reporting of quantitative data related to productive performance, carcass traits or meat quality variables. Studies were excluded when comprising reviews, conference abstracts, theses or other non-primary research publications, as well as then the full text was not available, when experiments were conducted with animal categories other than growing or finishing pigs, when dietary treatments included mixtures of phenolic compounds combined with other functional additives that prevent effect isolation and when results were presented only in graphical form without extractable numerical data.
Data extraction and database construction
Following eligibility assessments, selected studies were compiled into a structured database using the Microsoft Excel software. When studies reported more than one experiment or treatment comparison, each experiment was considered as an independent observational unit, whenever possible, allowing for multiple observations to be derived from a single publication. Information concerning study identification (first author, publication year and journal), experimental design, animal characteristics (genetic lineage, sex category, age and initial and final body weight), and dietary treatments was extracted from each study. Additional information consisted in type of phenolic compound, dietary inclusion levels (expressed as mg/kg of diet), metabolizable energy and dietary digestible lysine levels, number of treatments, number of replicates per treatment, number of animals per experimental unit and experiment duration. Identified phenolic compounds were initially classified into several chemical categories, however the limited number of available studies and the incomplete characterization of certain extracts led to a quantitative analysis restriction to two well-defined classes of compounds, flavonoids and tocopherols.
Outcome variables
Extracted response variables were grouped into two main categories: productive performance and carcass traits and meat quality. Productive performance variables included average daily feed intake (ADFI), average daily gain (ADG), feed conversion ratio (FCR) and FBW. Carcass traits and meat quality variables included hot carcass weight, carcass yield, carcass length, backfat thickness, loin eye area, intramuscular fat (marbling), meat pH, colour parameters (L*: luminosity, a*: redness and b*: yellowness), drip loss, shear force, and lipid oxidation indicators, i.e., thiobarbituric acid reactive substances (TBARS) or malondialdehyde (MDA). When necessary, values reported in different units were standardized to allow for adequate comparisons among studies.
Quality assessment of the included studies
The methodological quality of the data reported in the selected studies was assessed based on twelve predefined criteria adapted from previous systematic reviews in the animal science field, as follows: A – genetic lineage; B – animal age (growth and/or finishing); C – animal sex category; D – compound characterization or purity; E – methodology employed to obtain the investigated compound; F – metabolizable dietary energy; G – digestible lysine levels; H – treatment randomization; I – initial and final temperatures (environment); J – provided light period; and K – sanitary or environmental challenge. Each criterion received a score of two points when the information was clearly reported and one point when the information was not reported. The resulting scores were used to describe the overall methodological reporting level of the included studies but were not applied as exclusion criteria.
Statistical analyses
A quantitative data synthesis was performed through meta-regression models to investigate associations between dietary phenolic compound inclusion and analysed response variables. As the original studies reported only treatment means without associated dispersion measures (e.g., standard deviations or standard errors), conventional effect size measures, such as the standardized mean difference, could not be calculated. Thus, dose–response relationships were modelled directly employing mixed-effects regression models, with study IDs included as a random effect. Due to the lack of variance measures in most studies, formal publication bias assessment was not performed.
Dietary flavonoid or tocopherol inclusion levels (mg/kg of diet) were employed as the continuous explanatory variables in the applied models. Both linear and quadratic models were tested for each response variable. The inclusion of studies as a random effect allowed the models to account for inter-study variability and potential experimental heterogeneity. Model selection was based on the Akaike Information Criterion (AIC) and the Bayesian Information Criterion (BIC), while the coefficient of determination (R2) was used to assess the variances explained by the models. The statistical significance of the regression coefficients was assessed employing t-tests, adopting a significance level of P ≤ 0.05, whereas values between 0.05 and 0.10 were considered indicative of statistical trends. All statistical analyses were performed within the R software (R Core Team, 2025) environment, and mixed-effects meta-regression models were fitted using the nlme package (Pinheiro et al., Reference Pinheiro, Bates, DebRoy, Sarkar and Team2025).
Results
Study selection and database characterization
The applied database search identified 215 records, 141 concerning performance (ID 5, Table 1) and 74, meat quality (ID 6, Table 1). Following duplicate removal and eligibility criteria application, 15 articles were included (Figure 1), totaling 888 animals (Table 2). Among these, 11 studies contributed to the performance dataset and 11 to the carcass traits and meat quality dataset, with some included in both. The included studies were published between 1999 and 2020 across ten scientific journals. The most frequently reported genetic lineage was Duroc × Landrace × Large White (33.33%), followed by Large White (26.67%). Initial and final average weights were 65.50 kg and 106.78 kg, respectively, with an average experimental period of 56 days. Mean inclusion levels for flavonoids and tocopherols were 409.30 mg/kg 213.93 mg/kg, respectively. Article exclusions were as follows: duplicates (2.33%), title (84.19%), full text not available (1.40%), impossibility of isolating compound/mixture effects (1.40%), different animal category (1.86%), outside the aim of this study (1.86%).
PRISMA flowchart detailing article search and selection for inclusion in this systematic review and meta-analysis.

General summary of the articles included in systematic review and meta-analysis

Table 2. Long description
A table summarizing articles included in a systematic review and meta-analysis on animal studies. The table has 15 rows and 9 columns. Column headers are Author/Year, Journal, Genetics, Number of animals, Compound source, Compound, Level (mg/kg), Period (days), and Results. Row labels are Chen et al. (2016), Eichenberger et al. (2004), Gebert et al. (1999b), Gebert et al. (1999a), He et al. (2010), Lahucký et al. (2005), Lauridsen et al. (1999), Li et al. (2015), Payne et al. (2001), Pieszka et al. (2006), Smith et al. (2020), Sun et al. (2020), Soler-Velasquez et al. (1998), Wang et al. (2012), and Wang et al. (2020). Row 1: Chen et al. (2016), G, Duroc × Landrace × Large White, 48, Daidzein, GNFST, Daidzein, 640, 64, MQ (ns) and P (+). Row 2: Eichenberger et al. (2004), C, Large White, 40, DL-α-tocopheryl acetate, Vitamin E, 200, Nsp, P (ns) and QC (ns). Row 3: Gebert et al. (1999b), E, Large White, 40, α-tocopherol acetate, USCC, Vitamin E, 200, Nsp, MQ (ns). Row 4: Gebert et al. (1999a), E, Large White, 40, α-tocopherol acetate, USCC, Vitamin E, 200, Nsp, P (ns). Row 5: He et al. (2010), J, Duroc × Yorkshire × Landrace, 40, α-tocopherol, Vitamin E, 300, 42, MQ (+). Row 6: Lahucký et al. (2005), F, Nsp, 30, Tocopherol acetate, Vitamin E, 500, 30, MQ (+). Row 7: Lauridsen et al. (1999), F, Yorkshire × Landrace, 82, DL-α-tocopheryl acetate, Vitamin E, 100, 200, 76, P (ns). Row 8: Li et al. (2015), A, Duroc × Yorkshire × Landrace, 60, α-tocopherol acetate, Vitamin E, 400, 28, MQ (+). Row 9: Payne et al. (2001), F, Yorkshire × Landrace, 60, Nsp, Soy isoflavones, 161, 78; 642, 79; 70, 02 e 282, 94, 35, 48, P (ns) and MQ (ns). Row 10: Pieszka et al. (2006), D, Large white, 50, γ-Tocopherol acetate, Lutamix, Vitamin E, 300, Nsp, MQ (ns). Row 11: Smith et al. (2020), F, 1050 Cambro genetics, 96, Novasoy 400, Soy isoflavones, 1, 60, Nsp, P (−). Row 12: Sun et al. (2020), B, Duroc × Yorkshire × Landrace, 72, JBC, Daidzein, 12, 50; 37, 50; e 62, 50, 96, P (+) and MQ (+). Row 13: Soler-Velasquez et al. (1998), K, Yorkshire × Duroc × Hampshire, 96, Nsp, Vitamin E, 50, 125, e 200, 42, P (ns). Row 14: Wang et al. (2012), H, Duroc × Landrace × Large white, 48, D-α-tocopherol acetate, Vitamin E, 10 e 210, 48, MQ (+) and P (ns). Row 15: Wang et al. (2020), I, Yorkshire × Rongchang, 96, Naringin, XHBC, Naringin, 0, 50; 1, 00; e 1, 50, Nsp, MQ (ns) and P (ns).
A: Animal Bioscience; B: Animal Feed Science and Technology; C: Archives of Animal Nutrition; D: Journal of Animal and Feed Sciences; E: Journal of Animal Physiology and Animal Nutrition; F: Journal of Animal Science; G: Journal of Animal Science and Biotechnology; H: Livestock Science; I: South African Journal of Animal Science; J: The Journal of Animal and Plant Sciences; K: American Society of Animal Science; GNFST: Guangdong Newland Feed Science & Technology Co., Ltd.; USCC: U. S. Copyright Clearance Center Code Statement; JBC: Junzheng Biotechnology Co., Ltd. (Chengdu, China); Novasoy400: Archer Daniels Midland Company, Decatur, IL; XHBC: Xi’an Haoxuan Biotechnology Company; P: performance; MQ: meat quality; (+): positive effect; (−): negative effect; ns: not significant; Nsp: not specified; *Flavonoids; **Tocopherols.
Regarding methodological quality assessment concerning performance studies, percentages of score 2 studies were as follows for each criterion: A – 100%; B – 90.91%; C – 63.64%; D – 27.27%; E – 72.73%; F – 54.55%; G – 72.73%; H – 63.64%; I – 9.09%; J – 0%; and K – 9.09%. For studies concerning carcass characteristics and meat quality, considering the same criteria and scoring system, percentages were: A – 90.91%; B – 81.82%; C – 72.73%; D – 18.18%; E – 72.73%; F – 45.45%; G – 63.64%; H – 54.55%; I – 9.09%; J – 0%; and K – 0%. None of the studies in either dataset achieved the maximum possible score (24 points), indicating that none of the articles reported all the methodological information considered necessary for a comprehensive study understanding (Table 3).
Article quality assessment

Table 3. Long description
A table comparing article quality assessments for performance and meat quality studies. The table has 11 columns labeled A through K and a total column, with rows for different studies. Each row lists scores for each criterion and a total score. The studies are grouped under two categories: Performance and Meat quality. Each study is listed with its author and year. The Performance group includes studies by Chen et al. (2016), Eichenberger et al. (2004), Gebert et al. (1999a), He et al. (2010), Lauridsen et al. (1999), Payne et al. (2001), Smith et al. (2020), Sun et al. (2020), Soler-Velasquez et al. (1998), and Wang et al. (2012). The Meat quality group includes studies by Chen et al. (2016), Eichenberger et al. (2004), Gebert et al. (1999b), He et al. (2010), Lahucký et al. (2005), Lauridsen et al. (1999), Payne et al. (2001), Pieszka et al. (2006), Sun et al. (2020), Wang et al. (2012), and Wang et al. (2020). Each study’s scores for criteria A through K are listed, followed by the total score. The table provides a detailed comparison of the methodological quality of various studies.
* This article was divided into two studies (35 and 42 days), both presenting the same quality pattern; A: Genetic line; B: Animal age (growth and/or finishing); C: Animal sex category; D: Compound characterization/purity; E: Compound obtainment methodology; F: Metabolizable energy; G: Digestible lysine; H: Randomization; I: Initial and final temperature (environment); J: Provided light period; and K: Sanitary or environmental challenge.
General effects across studies
Phenolic supplementation resulted in heterogeneous effects depending on the investigated outcome across all included studies. Overall, positive and significant responses were observed in 7.14% of performance-related variables, 35.71% of carcass and meat quality traits and 64.29% of antioxidant-related parameters. When stratified by compound class, flavonoid supplementation resulted in greater performance variability, with 33.33% of the studies reporting positive effects and 16.67% reporting negative effects. In contrast, tocopherol supplementation did not lead to significant performance effects in any of the evaluated studies.
Flavonoids exhibited limited effectiveness regarding carcass characteristics and meat quality, with only 20% of the studies reporting positive responses, while 80% reported no significant differences compared to control treatments. Conversely, tocopherols were more consistently associated with carcass characteristic and meat quality improvements, with 67% of the studies reporting positive effects and 33% indicating no significant effects.
Meta-analysis concerning productive performance
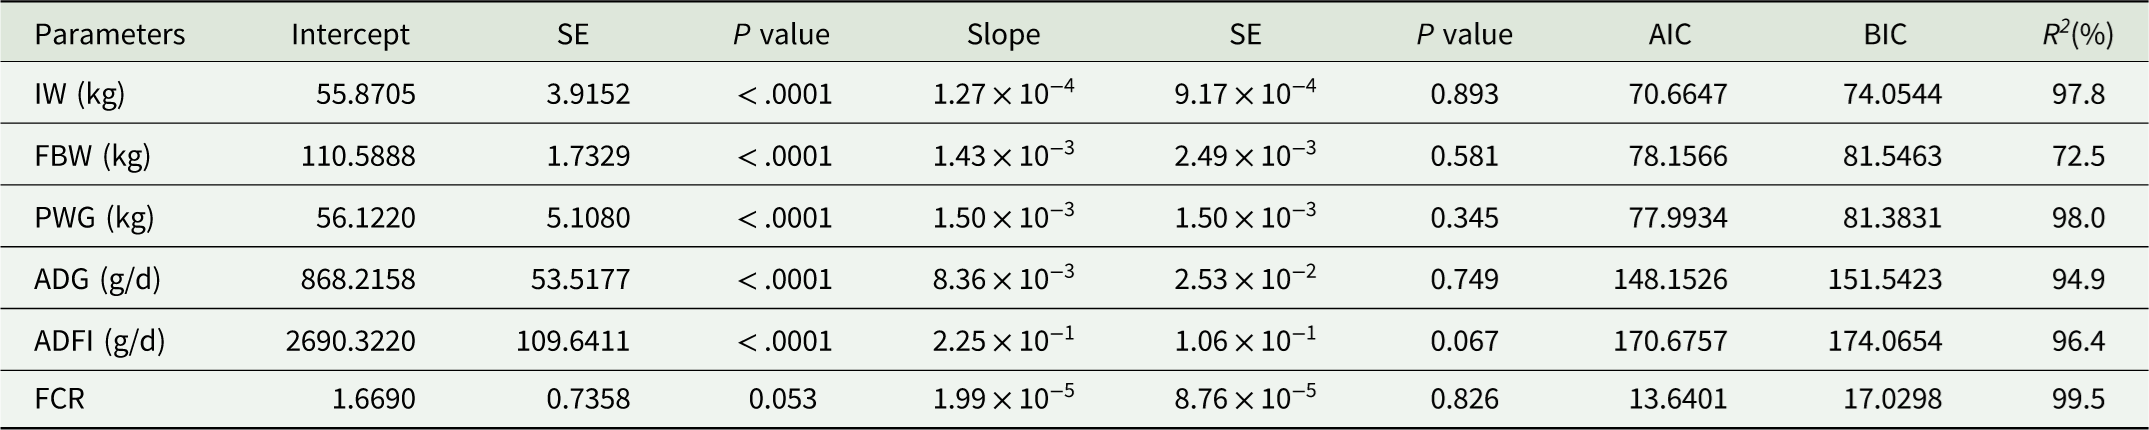
A meta-regression approach was applied considering supplementation dose as a continuous explanatory variable, with linear and quadratic models fitted applying mixed-effect structures. Regarding flavonoids, the linear model revealed a trend towards significance (0.05 ≤ P < 0.10) for ADFI, indicating a positive association between flavonoid/tocopherol inclusion level and feed intake (Table 4). Concerning FC, the quadratic model indicated significant linear and quadratic coefficients (P < 0.05), with an excellent model fit (R 2 = 99.9%). The estimated optimal inclusion level for flavonoids was 502.20 mg/kg, corresponding to a predicted FCR of 1.58 (Table 5). No significant effects were observed for the applied linear models concerning performance variables for tocopherols (Table 6). In the quadratic model, however, FBW exhibited a trend towards significance (P = 0.056 for linear terms and P = 0.069) for quadratic terms, with an estimated minimum point at 139.61 mg/kg, corresponding to a predicted FBW of 101.66 kg (Table 7).
Productive performance of finishing pigs supplemented with flavonoids (Linear model)

Table 4. Long description
A table comparing various parameters and their statistical analysis in a study on the productive performance of finishing pigs supplemented with flavonoids. The table has 6 rows and 10 columns. The columns are labeled as Intercept, SE, P value, Slope, SE, P value, AIC, BIC, and R squared (percent). The rows are labeled as IW (kg), FBW (kg), PWG (kg), ADG (g/d), ADFI (g/d), and FCR. Each row provides values for the intercept, its standard error (SE), P value, slope, its SE, P value, AIC, BIC, and R squared (percent). For example, the first row (IW (kg)) shows values like 55.8705 for Intercept, 3.9152 for SE, less than 0.0001 for P value, 1.27 times 10 to the power of -4 for Slope, 9.17 times 10 to the power of -4 for SE, 0.893 for P value, 70.6647 for AIC, 74.0544 for BIC, and 97.8 for R squared (percent). The table provides a detailed statistical analysis of the parameters, showing trends and significance levels.
IW: initial weight; FBW: final body weight; PWG: period weight gain; ADG: average daily gain; ADFI: average daily feed intake; FCR: feed conversion ratio; AIC: Akaike information criterion; BIC: Bayesian information criterion; R 2 : represents the variance explained by the entire model, including both fixed and random effects.
Productive performance of finishing pigs supplemented with flavonoids (Quadratic model)

Table 5. Long description
A table comparing the effects of flavonoids on the performance of finishing pigs using a quadratic model. The table has 7 rows and 13 columns. The columns are labeled as Parameters, Intercept, SE, P value, Slope, SE, P value, Slope squared, SE, P value, AIC, BIC, and R squared (percent). The rows are labeled as IW (kg), FBW (kg), PWG (kg), ADG (g/d), ADFI (g/d), and FCR. Each row provides values for the intercept, standard error (SE), P value, slope, SE, P value, slope squared, SE, P value, AIC, BIC, and R squared (percent) for the respective parameter. The table shows the statistical analysis results of the quadratic model applied to the performance variables of finishing pigs supplemented with flavonoids.
IW: initial weight; FBW: final body weight; PWG: period weight gain; ADG: average daily gain; ADFI: average daily feed intake; FCR: feed conversion ratio; AIC: Akaike information criterion; BIC: Bayesian information criterion; R2: represents the variance explained by the entire model, including both fixed and random effects.
Productive performance of finishing pigs supplemented with tocopherols (Linear model)

Table 6. Long description
A table showing the parameters of a linear model for the productive performance of finishing pigs supplemented with tocopherols. The table has 2 rows and 10 columns. The columns are labeled as Parameters, Intercept, SE, P value, Slope, SE, P value, AIC, BIC, and R^2 (%). The rows are labeled as IW (kg) and FBW (kg). The values in the table are as follows: Row 1: Parameters, IW (kg); Intercept, 40.8390; SE, 9.5538; P value, 0.008; Slope, -6.81 x 10^-4; SE, 5.94 x 10^-4; P value, 0.303; AIC, 56.0800; BIC, 58.4674; R^2 (%), 100.0. Row 2: Parameters, FBW (kg); Intercept, 101.9648; SE, 2.7767; P value, <0.001; Slope, -7.56 x 10^-4; SE, 6.84 x 10^-4; P value, 0.320; AIC, 42.1212; BIC, 44.5085; R^2 (%), 99.9.
IW: initial weight; FW: final body weight; AIC: Akaike information criterion; BIC: Bayesian information criterion; R2: represents the variance explained by the entire model, including both fixed and random effects.
Productive performance of finishing pigs supplemented with tocopherols (Quadratic model)

Table 7. Long description
A table comparing parameters of a quadratic model for finishing pigs supplemented with tocopherols. The table has 2 rows and 12 columns. The columns are labeled Parameters, Intercept, SE, P value, Slope, SE, P value, Slope squared, SE, P value, AIC, BIC, and R squared (percent). The rows are labeled IW (kg) and FBW (kg). For IW (kg), the values are Intercept: 40.8410, SE: 10.1288, P value: 0.016, Slope: -1.21 x 10^-3, SE: 0.0028, P value: 0.683, Slope squared: 2.37 x 10^-6, SE: 1.15 x 10^-5, P value: 0.846, AIC: 58.0615, BIC: 60.8468, and R squared: 100 percent. For FBW (kg), the values are Intercept: 101.9876, SE: 2.9357, P value: <0.0001, Slope: -4.63 x 10^-3, SE: 0.0017, P value: 0.056, Slope squared: 1.66 x 10^-5, SE: 6.69 x 10^-6, P value: 0.069, AIC: 39.2945, BIC: 42.0798, and R squared: 100 percent.
IW: initial weight; FW: final body weight; AIC: Akaike information criterion; BIC: Bayesian information criterion; R2: represents the variance explained by the entire model, including both fixed and random effects.
Meta-analysis concerning carcass traits and meat quality
The meta-analysis concerning carcass characteristics and meat quality revealed distinct dose–response patterns between flavonoids and tocopherols. For the former, the linear model revealed significant effects on meat colour parameters, specifically a* and b*, with both variables decreasing with increasing supplementation levels (Table 8). No significant effects, however, were observed in the quadratic models for any of the evaluated carcass or meat quality traits (Table 9), suggesting that flavonoid responses follow a predominantly linear pattern within the applied dose range.
Carcass and meat quality of finishing pigs supplemented with flavonoids (Linear model)

Table 8. Long description
A table comparing various parameters of carcass and meat quality in finishing pigs supplemented with flavonoids. The table has 14 rows and 10 columns. The columns are labeled Intercept, SE, P value, Slope, SE, P value, AIC, BIC, and R^2 (%). The rows are labeled with different parameters: Hot carcass weight (kg), % of Yield, % of Total lean, CL (cm), % of IMF, Backfat (cm), LEA (cm^2), pH 45 min, L* 45 min, b* 45 min, L* 24 h, a* 24 h, b* 24 h, % of DL 24 h, and Shear force (N). Each row contains values for Intercept, SE, P value, Slope, SE, P value, AIC, BIC, and R^2 (%) corresponding to the parameter. The table provides detailed statistical analysis of the effects of flavonoid supplementation on various carcass and meat quality traits in finishing pigs.
CL: carcass length; IMF: intramuscular fat (marbling); LEA: loin eye area; L*: lightness; a*: redness; b*: yellowness; DL: drip loss; AIC: Akaike information criterion; BIC: Bayesian information criterion; R2: represents the variance explained by the entire model, including both fixed and random effects.
Carcass and meat quality of finishing pigs supplemented with flavonoids (Quadratic model)

Table 9. Long description
A table comparing various carcass characteristics and meat quality traits of finishing pigs supplemented with flavonoids using a quadratic model. The table has 19 rows and 14 columns. The columns are labeled as Parameters, Intercept, SE, P value, Slope, SE, P value, Slope squared, SE, P value, AIC, BIC, and R squared (percent). The rows are labeled with different parameters such as Hot carcass weight (kg), Percent of Yield, Percent of Total lean, CL (cm), Percent of IMF, Backfat (cm), LEA (cm squared), pH 45 min, pH 24 h, L* 45 min, L* 24 h, a* 24 h, b* 24 h, Percent of DL 24 h, and Shear force (N). Each row contains values for the intercept, standard error (SE), P value, slope, SE, P value, slope squared, SE, P value, Akaike Information Criterion (AIC), Bayesian Information Criterion (BIC), and R squared (percent). Notable trends include significant P values for most parameters, indicating the impact of flavonoid supplementation on various carcass and meat quality traits.
CL: carcass length; IMF: intramuscular fat (marbling); LEA: loin eye area; L*: lightness; a*: redness; b*: yellowness; DL: drip loss; AIC: Akaike information criterion; BIC: Bayesian information criterion; R2: represents the variance explained by the entire model, including both fixed and random effects.
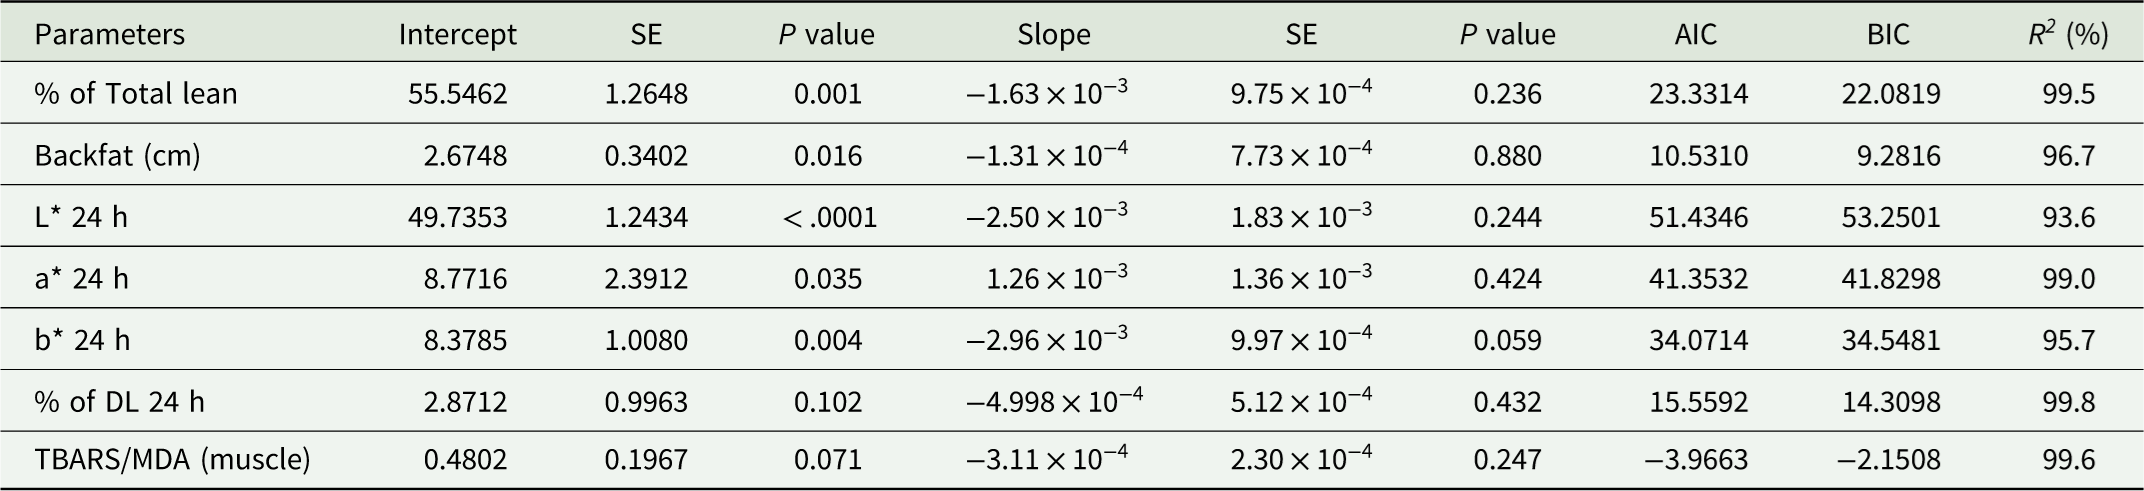
Tocopherols, in turn, exhibited more complex dose–response relationships. A trend towards significance was observed for b* at 24 hours postmortem in the linear model (Table 10), suggesting potential decreases in yellowness with increasing supplementation levels. More pronounced effects were identified in the quadratic models, where significant relationships were observed for both L* and a* at 24 hours postmortem (Table 11). The model estimated a minimum L* value of 47.96 at an inclusion level of 219.80 mg/kg of feed, indicating reduced luminosity at intermediate inclusion levels. In contrast, the maximum a* value (9.84) was observed at 179.55 mg/kg of feed, suggesting increased redness at this inclusion level.
Carcass and meat quality of finishing pigs supplemented with tocopherols (Linear model)

Table 10. Long description
A table comparing various parameters of carcass and meat quality in finishing pigs supplemented with tocopherols. The table has 7 rows and 9 columns. The columns are labeled: Parameters, Intercept, SE, P value, Slope, SE, P value, AIC, BIC, and R^2 (%). The rows are labeled with different parameters: % of Total lean, Backfat (cm), L* 24 h, a* 24 h, b* 24 h, % of DL 24 h, and TBARS/MDA (muscle). Each row contains values for Intercept, SE, P value, Slope, SE, P value, AIC, BIC, and R^2 (%) for the respective parameter. Notable trends include significant P values for % of Total lean, Backfat (cm), L* 24 h, a* 24 h, b* 24 h, and % of DL 24 h, indicating the impact of tocopherol supplementation on these parameters.
L*: lightness; a*: redness; b*: yellowness; DL: drip loss; TBARS: Thiobarbituric acid reactive substances; MDA: malondialdehyde; AIC: Akaike information criterion; BIC: Bayesian information criterion; R2: represents the variance explained by the entire model, including both fixed and random effects.
Carcass and meat quality of finishing pigs supplemented with tocopherols (Quadratic model)

Table 11. Long description
A table comparing carcass and meat quality parameters of finishing pigs supplemented with tocopherols. The table has 8 rows and 12 columns. The columns are labeled as Parameters, Intercept, SE, P value, Slope, SE, P value, Slope^2, SE, P value, AIC, BIC, and R^2 (%). The rows are labeled with different parameters measured at 24 hours: pH, L*, a*, b*, percent of DL, and TBARS/MDA (muscle). Each row provides values for the intercept, standard error (SE), P value, slope, SE, P value, slope squared, SE, P value, AIC, BIC, and R^2 (%) for the respective parameter. The table presents data on how different levels of tocopherol supplementation affect various meat quality attributes in finishing pigs.
L*: lightness; a*: redness; b*: yellowness; DL: drip loss; TBARS: thiobarbituric acid reactive substances; MDA: malondialdehyde; AIC: Akaike information criterion; BIC: Bayesian information criterion; R2: represents the variance explained by the entire model, including both fixed and random effects.
Additionally, the TBARS/MDA parameter exhibited a trend toward significance in the quadratic model, with a minimum estimated value of 0.39 at an inclusion level of 186.89 mg/kg (Table 11). This indicates potential lipid peroxidation decreases at intermediate tocopherol supplementation levels.
Discussion
Systematic review
Data credibility and the individual results of studies included in systematic reviews converge to a higher quality of study evidence (Macleod et al., Reference Macleod, Fisher, O’Collins, Sena, Dirnagl, Bath, Buchan, Van Der Worp, Traystman, Minematsu, Donnan and Howells2009). Herein, a quality assessment of included articles was performed by applying twelve quality criteria to ensure data quality and reliability (Moreira et al., Reference Moreira, Pérez Palencia, Moita, Caputo, Saraiva, Andretta, Ferreira and Abreu2020; Palencia et al., Reference Palencia, Saraiva, Abreu, Zangeronimo, Schinckel and Garbossa2018).
Pig breed or genetic lineage was described in 100% of the performance evaluation studies and in 90.91% of carcass characteristics and meat quality assessments. This is an important information, as genetic differences directly influence meat performance and quality (Lebret et al., Reference Lebret, Ecolan, Bonhomme, Méteau and Prunier2015). Likewise, animal sex categories were mentioned in 63.6% of the articles concerning performance, and in 72.7% of those regarding carcass characteristics and meat quality. It is paramount that animal sexing in experimental trials be planned, performed and reported, given that the physiological differences between males and females are associated with performance variations (Malgwi et al., Reference Malgwi, Giannuzzi, Gallo, Halas, Carnier and Schiavon2022) and meat quality (Malgwi et al., Reference Malgwi, Giannuzzi, Gallo, Halas, Carnier and Schiavon2022; Xia et al., Reference Xia, Liu, Liu, Jiang, Wang, Yang and Liu2023).
Experimental period duration and life stage (age) were reported in 90.9% of the articles included in the performance database and in 81.8% of those aimed at evaluating carcass characteristics and meat quality. This enabled the inclusion of studies specifically addressing tocopherol and flavonoid supplementation during pig growth and finishing phases.
Metabolizable energy values and digestible lysine levels were reported in 54.6% and 72.7% of the performance studies, respectively, also described in 45.5% and 63.6% of the articles assessing carcass characteristics and meat quality. An intake of energy levels that meets nutritional pig requirements is one of the factors that most contributes to the performance of these animals in the finishing phase (Rezende et al., Reference Rezende, Donzele, Oliveira, Abreu, Ferreira, Silva and Apolônio2006). Additionally, providing an appropriate dietary energy/protein ratio, maintaining a constant digestible lysine:calorie ratio, is associated with an adequate balance between energy and protein consumption, avoiding energy partitioning changes deposited in the form of carcass fat or protein (Rezende et al., Reference Rezende, Donzele, Oliveira, Abreu, Ferreira, Silva and Apolônio2006).
Randomization was applied in 63.6% of the performance studies and in 54.6% of the studies investigating carcass characteristics and meat quality. This enables the random selection of individuals for categorization in the treatment and control groups, avoiding selection bias (Kim and Shin, Reference Kim and Shin2014), providing greater scientific rigor and improving result reliability (Cardoso et al., Reference Cardoso, Ferreira, Correa, Silva and Alves2024).
The present systematic review identified a lack of available information regarding environmental experiment characterizations. Only 9.1% of all studies clearly reported the temperature for both data sets, while none mentioned the provided light period. On the other hand, only 9.1% of the articles addressing performance included trial challenges. Detailed descriptions of experimental conditions are, however, paramount, due to the influence of these variables on treatment effects (Camargo et al., Reference Camargo, Cony, Silva, Franceschi and Andretta2023). In this sense, it is important to note that artificial light during milder temperature periods can increase feed consumption (Ferreira et al., Reference Ferreira, Fassani, Rocha, Oliveira, Ribeiro, Abreu and Cantarelli2016). In contrast, temperature ranges outside the comfort zone induce thermal stress in pigs, in turn altering physiological and behavioral reactions (Santos et al., Reference Santos, Carvalho, Silva, Diniz, Soares, Moreira and Cecon2018) and reducing productive performance (Manno et al., Reference Manno, Oliveira, Donzele, Oliveira, Vaz, Silva, Saraiva and Lima2006). Additionally, the application of sanitary challenges allows for extrapolation of the results to actual production conditions, where these challenges are more evident (Camargo et al., Reference Camargo, Cony, Silva, Franceschi and Andretta2023).
Performance improvement has been associated with the consumption of daidzein, a flavonoid known for its anti-inflammatory, anticancer and antioxidant properties (Alshehri et al., Reference Alshehri, Sharifi-Rad, Herrera-Bravo, Jara, Salazar, Kregiel, Uprety, Akram, Iqbal, Martorell, Torrens-Mas, Pons, Daştan, Cruz-Martins, Ozdemir, Kumar and Cho2021). It is also important to note that this compound exhibits a similar chemical structure to oestradiol, giving it the ability to bind to the oestrogen receptors ERα and ERß (Kuiper et al., Reference Kuiper, Lemmen, Carlsson, Corton, Safe, Saag, Burg and Gustafsson1998). This oestrogenic activity can modulate the mammalian neuroendocrine system (Casanova et al., Reference Casanova, You, Gaido, Archibeque-Engle, Janszen and Heck1999), modifying hormone release (Santell et al., Reference Santell, Chang, Nair and Helferich1997), which may favour the growth of male animals (Genlin et al., Reference Genlin, Xiangying, Zhaoyu, Zhaobin and Weirong2002). In this regard, Sun et al. (Reference Sun, Li, Li, Chen, Yu, Yu, Mao, Zheng, Luo, Luo and He2020), reported that dietary supplementation with daidzein in male pigs in the growing and finishing phases increased the serum concentrations of IGF-1, testosterone and oestradiol, concurrently increasing final animal weight. Furthermore, oestrogen also modulates lipid metabolism (Mattsson and Olsson, Reference Mattsson and Olsson2007), reducing lipogenesis (Kuryłowicz, Reference Kuryłowicz2023), so daidzein consumption may also exert this oestrogen-analogous effect.
Concerning carcass characteristics/meat quality, a higher frequency of positive results was noted for tocopherols (66.7%) compared to flavonoids (20.0%). The reported findings are mainly related to decreased TBARS/MDA production (associated with lipid peroxidation), due to antioxidant tocopherol properties, as these compounds contribute to increased enzymatic activity, i.e., glutathione peroxidase and glutathione peroxidase 1, as well as glutathione content, an essential substrate for the aforementioned enzymes (Asghar et al., Reference Asghar, Gray, Booren, Gomaa, Abouzied, Miller and Buckley1991; He et al., Reference He, Wang and Wang2010; Li et al., Reference Li, Li, Li, Zhang, Gao and Zhou2015). Additionally, some reports indicate significant results regarding increased loin eye area and decreased drip loss (Li et al., Reference Li, Li, Li, Zhang, Gao and Zhou2015). Drip loss results may be due to vitamin E’s ability in preventing the breakdown of cell membrane fatty acids, maintaining membrane integrity (Asghar et al., Reference Asghar, Gray, Booren, Gomaa, Abouzied, Miller and Buckley1991; Erin et al., Reference Erin, Gorbunov, Brusovanik and Prilipko1986). This results in consequent water retention capacity, as the release of unsaturated fatty acids affects mitochondria stability, which are semipermeable, resulting in water exudation (Asghar et al., Reference Asghar, Gray, Booren, Gomaa, Abouzied, Miller and Buckley1991; Erin et al., Reference Erin, Gorbunov, Brusovanik and Prilipko1986; He et al., Reference He, Wang and Wang2010).
Meta-analysis
The meta-regression results indicate that flavonoid supplementation productive performance effects follow a dose-dependent pattern, particularly regarding feed intake and feed conversion. The positive association between flavonoid inclusion and ADFI, although exhibiting only a statistical trend, suggests that these compounds may influence feeding behaviour and/or palatability, potentially stimulating feed intake with increasing inclusion levels. In addition, the quadratic response observed for feed conversion indicates a nonlinear relationship between supplementation level and feed efficiency, with an estimated optimal inclusion level of 502.2 mg/kg of diet, corresponding to a predicted feed conversion ratio of 1.58. This suggests that moderate flavonoid levels may enhance nutrient utilization efficiency, whereas higher inclusion levels may not necessarily provide additional benefits. Similar findings were reported by Liu et al. (Reference Liu, Xiao, Xie, Peng, Li, Chen, Li, Zhang, He, Xiao and Yin2022), who investigated the dietary inclusion of flavonoids extracted from mulberry leaves in finishing pigs and observed growth rate, feed intake and feed efficiency improvements at different inclusion levels. These results reinforce the hypothesis that flavonoids may modulate digestive efficiency and metabolic nutrient utilization, possibly through antioxidant activities and gut microbiota interactions (Che et al., Reference Che, Li, Kong, Geng, Wang, Li, Deng, Chen and Wang2024; Cui et al., Reference Cui, Wang, Wang, Diao and Zhang2019).
In contrast, no clear linear performance variable effects were observed regarding tocopherol supplementation, although a trend toward significance was observed for final body weight in the quadratic model. The estimated minimum point at 139.61 mg/kg of diet suggests a potential nonlinear response regarding growth performance associated to dietary tocopherol levels. Although the magnitude of this effect was relatively small, this pattern may reflect the role of vitamin E in maintaining cellular integrity and reducing oxidative stress, indirectly contributing to improved metabolic efficiency and growth performance (Asghar et al., Reference Asghar, Gray, Booren, Gomaa, Abouzied, Miller and Buckley1991; Shastak and Pelletier, Reference Shastak and Pelletier2024; Traber, Reference Traber2024; Wang et al., Reference Wang, Jang, Rentfrow, Azain and Lindemann2022; Wang et al., Reference Wang, Jang, Kelley, Rentfrow, Azain and Lindemann2023). Tocopherols are known to stabilize cell membranes and protect tissues from oxidative damage, improving physiological conditions and potentially enhancing feed efficiency and immune function in pigs (Traber, Reference Traber2024; Wang et al., Reference Wang, Jang, Rentfrow, Azain and Lindemann2022, Reference Wang, Jang, Kelley, Rentfrow, Azain and Lindemann2023). Thus, even moderate growth parameters improvements may reflect improved metabolic resilience under production conditions.
Regarding carcass traits and meat quality, distinct flavonoid and tocopherol responses were observed. For flavonoids, the linear models indicated significant decreases in the colour parameters a* and b* with increasing supplementation levels, suggesting a dose-dependent decrease in meat redness and yellowness. From a practical perspective, excessive decreases in these parameters could negatively affect consumer perceptions, as higher a* values are generally associated with a fresh and attractive pork appearance (Cassens et al., Reference Cassens, Ramanathan, Vanoverbeke and Mafi2021; Gagaoua et al., Reference Gagaoua, Suman, Purslow and Lebret2023). The magnitude of these changes, however, should be interpreted cautiously, as the observed reductions occurred within the range typically reported for pork colour values and may not necessarily result in perceptible differences to consumers (Altmann et al., Reference Altmann, Gertheiss, Tomašević, Engelkes, Glaesener, Meyer, Schäfer, Wiesen and Mörlein2022; Brewer et al., Reference Brewer, Zhu, Bidner, Meisinger and McKeith2001). The antioxidant properties of flavonoids may also influence pigment stability by altering the redox state of myoglobin or interacting with lipid oxidation processes, which can indirectly affect colour development (Asghar et al., Reference Asghar, Gray, Booren, Gomaa, Abouzied, Miller and Buckley1991; Guo et al., Reference Guo, Chen, Huang, Chen, Li, Yu, He, Luo, Yan and Zheng2022; Jensen et al., Reference Jensen, Guider, Skovgaar, Staun, Skibsted, Jensen, Moller, Buckley and Bertelsen1997). In addition, certain plant-derived phenolic compounds may contribute with pigments that mat alter the optical properties of muscle tissue (Muzolf-Panek et al., Reference Muzolf-Panek, Zaworska-Zakrzewska, Czech, Lisiak and Kasprowicz-Potocka2024). Thus, the colour intensity decreased observed herein does not necessarily indicate meat quality deterioration, but rather altered pigment stability and oxidation dynamics.
In contrast, tocopherols exhibited a more complex dose–response pattern concerning meat colour. The quadratic models revealed significant effects for both L* and a* values 24 h postmortem, indicating that intermediate supplementation levels may influence meat lightness and redness. The model predicted a minimum L* value of 47.96 at 219.80 mg/kg of diet and a maximum a* value of 9.84 at 179.55 mg/kg of diet. Although these differences represent moderate variations in absolute terms, they may be relevant from a technological perspective, as small L* and a* changes can influence the visual perception of pork freshness and quality. Increased a* values suggest enhanced redness at intermediate tocopherol levels, consistent with vitamin E’s role in preserving myoglobin in its reduced form and preventing oxidative discolouration (Asghar et al., Reference Asghar, Gray, Booren, Gomaa, Abouzied, Miller and Buckley1991; Jensen et al., Reference Jensen, Guider, Skovgaar, Staun, Skibsted, Jensen, Moller, Buckley and Bertelsen1997).
Furthermore, the trend toward reduced TBARS/MDA values observed in the quadratic model, with a minimum estimated value of 0.39 at 186.89 mg/kg, reinforces the antioxidant role of tocopherols in muscle tissue (Asghar et al., Reference Asghar, Gray, Booren, Gomaa, Abouzied, Miller and Buckley1991; Jensen et al., Reference Jensen, Guider, Skovgaar, Staun, Skibsted, Jensen, Moller, Buckley and Bertelsen1997; Pfalzgraf et al., Reference Pfalzgraf, Frigg and Steinhart1995). Lipid oxidation is closely associated with colour stability and the development of undesirable sensory attributes, including rancid flavours and discolouration (Reitznerová et al., Reference Reitznerová, Šuleková, Nagy, Marcinčák, Semjon, Čertík and Klempová2017). By limiting lipid peroxidation, tocopherols contribute to maintaining membrane integrity and preserving muscle pigments, ultimately supporting both meat quality and shelf life (Asghar et al., Reference Asghar, Gray, Booren, Gomaa, Abouzied, Miller and Buckley1991; Sales and Koukolová, Reference Sales and Koukolová2011). Therefore, the combined effects observed with regard to TBARS values and colour parameters suggest that intermediate tocopherol supplementation levels may provide optimal oxidative stability and visual pork quality conditions.
Conclusion
A scarcity of studies adequately characterizing dietary phenolic compound supplementation in finishing pigs was observed herein. According to the systematic review, dietary supplementation with flavonoids resulted in positive effects on performance (weight, daily weight gain and feed conversion), whereas supplementation with tocopherol stood out more regarding meat quality and antioxidant activity (colour parameters, pH, TBRs, malondialdehyde concentration and antioxidant enzymes). The overall methodological quality of the included studies, however, was limited. These findings highlight the potential of flavonoids and tocopherols as natural feed additives in pig nutrition.
Author contributions
TEBL, PHSF, PNLP and ESM, collected the data for this study; RHRM and PHW, conducted the statistical analyses; RHRM, PHSF and REMO collaborated in result interpretation; TEBL, PHSF, PNLP, REMO and RHRM wrote the initial manuscript draft; TEBL, PHSF and RHRM developed the original hypotheses; RHRM, PHSF, PHW and REMO collaborated in result interpretation and finalized the manuscript. Both authors have read and approved the finalized manuscript.
Funding statement
This work was supported by the Coordenação de Aperfeiçoamento de Pessoal de Nível Superior (grant number 001).
Competing interests
The authors declare no conflicts of interest.
Ethical standards
Not applicable.