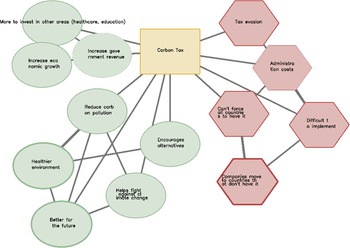


Emotion is often on the sidelines of efforts to understand political ideologies. Since the rise of behaviorist approaches and the subsequent dominance of the rational-choice paradigm in political science (Maynard, Reference Maynard2013), ideological attachment and conflict have been predominantly understood in terms of conscious or “rational” self-interested motivations. Within these models, emotion is widely presumed to be an irrational, and therefore unfathomable, aspect of the human condition (Marcus, Reference Marcus, Sears, Huddy and Jervis2003). Furthermore, the difficulty of separating competing emotional signals leads many researchers to focus on factors that can be more easily measured and controlled for, such as observable behavior and declared interests. As a result, the study of ideological conflict tends to focus on the manipulation of material incentives, with popular approaches aiming to “separate the people from the problem,” focusing instead on disputants’ underlying interests (Fisher & Ury, Reference Fisher and Ury1983; Raiffa, Reference Raiffa1982).
This tendency is detrimental to the study of ideology. Empirical research demonstrates that emotions are fundamentally inseparable from decision-making (Saver & Damasio, Reference Saver and Damasio1991). Interests are not always defined and measured according to the same sets of values, and values explicitly implicate emotion. Emotions are ultimately brain processes, objects in nature, rather than abstractions (Sapolski, Reference Sapolsky2017; Varela & Rosch, Reference Varela, Thompson and Rosch2017). There is no reason, in principle, why they cannot be located and measured (Thagard, Reference Thagard2018). The cognitive sciences have made significant advances toward understanding the psychological and neural processes involved in perception, problem-solving, learning, and emotion (Gross, Reference Gross2013). A straightforward means to apply these advances to modeling the nature and structure of belief systems could have considerable significance to our understanding of politics and its related behaviors. As a step toward integrating emotion into the study of ideologies, we investigate cognitive-affective mapping as a method to capture the basic emotional structure of different attitudes toward a single political issue.
Because political attitudes are complex, researchers often use multiple models to identify and explain the various causal contributors. Currently, political scientists are enthusiastic about the potential for innovative data-driven methods to explain attitude variation. This is particularly true of network approaches, which attempt to leverage the relationship between objects to generate explanations of social phenomena (Cranmer et al., Reference Cranmer, Leifeld, McClurg and Rolfe2017).Footnote 1 Unfortunately, an obstacle to the application of these methods for ideological or attitudinal research is that network approaches do not easily generalize to the level of conscious individual actors. While network analyses can be easily applied to study the impact of specific attitudes on the larger belief networks of individuals or groups (e.g., Bayesian approaches), these measures provide limited insight into questions such as why individuals discriminate between different possible attitudes or why they maintain their existing attitudinal preferences. In other words, current network approaches are typically descriptive or analogical (Ward et al., Reference Ward, Stovel and Sacks2011).
The objective of this project is to develop and test an innovative analytic approach to research that integrates emotion and network analyses in order to provide insights into these and other causal questions about the formation and expression of political attitudes and ideologies. As a point of departure, the project focuses on how individuals structure their thinking about single political issues (the ties between ideas) rather than which ideas they think about (the content of a belief network). To do this, this project borrows from and expands on a technique called cognitive-affective mapping, which allows individuals to visually depict the ideas, beliefs, and emotions they associate with a given political issue (Thagard, Reference Thagard and Martinovski2014). We treat the outcomes of these CAMs, a network of valenced concepts, as a series of undirected graphs and analyze and compare these networks based on their structural properties (Kolaczyk & Csárdi, Reference Kolaczyk and Csárdi2014). Unlike more traditional survey approaches, CAM networks allow us to examine whether the relationship between concepts is an important predictor of political attitudes. These network properties can also be compared with more traditional political science measures such as partisanship or parental socialization (Achen, Reference Achen2002). In this analysis, we focus on the network characteristics of emotional coherence as well as their density and centrality (e.g., degree centrality and closeness). We selected these measures because they provide a quantifiable measure of the extent to which a graph—a visual representation of the ideas and concepts that individuals associate with a single attitude—depends on certain structures (Faust & Skvoretz, Reference Faust and Skvoretz2002; Thagard, Reference Thagard and Martinovski2014). By analyzing variations in how ideological groups structure and connect concepts related to a single political issue, this approach can, in theory, provide unique insights into the basis of differences in ideological thinking and beliefs.
For this initial test, we assess the extent to which support for or opposition to the introduction of the carbon tax in Canada can be explained by the structural properties of CAM networks. We also compare the explanatory power of the emotional network measures (e.g., central node valence and diversity) with two traditional secondary measures: ideological orientation and party identification. For simplicity, we focus on a unidimensional measure of ideology: liberal/conservative.Footnote 2 In designing this project, the issue of the carbon tax was selected primarily because it has figured prominently in recent Canadian federal and provincial political discussions. This is a registered report study; the original pre-analysis plans are available on OSF: https://osf.io/qwpvd.
Cognitive mapping
Cognitive maps—also known as conceptual graphs, concept maps, or mind maps—are frequently used by researchers in psychology, political science, resource management, and computer science to visualize individuals’ mental construction of important aspects of the world (Axelrod, Reference Axelrod1976; Novak, Reference Novak1998; Sowa, Reference Sowa1999; Tolman, Reference Tolman1948). Cognitive maps can be broadly understood as “internal representations of external reality that people use to interact with the world around them” (Jones et al., Reference Jones, Ross, Lynam, Perez and Leitch2011 p. 1). In short, cognitive maps act as a qualitative model of how a given system operates in the mind of an individual (Forrester, Reference Forrester1971; Ozesmi & Ozesmi, Reference Özesmi and Özesmi2004). Cognitive maps are distinct from conceptual models commonly used in computer science. Whereas conceptual models have a predetermined purpose and rely on predefined concepts, cognitive maps are semantic models, which are flexible and open (Davies et al., Reference Davies, Green, Rosemann, Indulska and Gallo2006). The characteristics of flexibility and openness previously made it difficult to capture cognitive maps; however, the development of mapping methods and software tools, such as Empathica and Mental Modeler, has allowed scholars to empirically explore how these representations contribute to cognition and decision-making, attitudes, and behaviors (Gray et al., Reference Gray, Mellor, Jordan, Crall and Newman2014; Thagard, Reference Thagard and McGregor2010).
In psychology, early works on cognitive maps by Craik (Reference Craik1943), Tolman (Reference Tolman1948), Forrester (Reference Forrester1971), and Johnson-Laird (Reference Johnson-Laird1983) focused on the theory that people have internal representations that contribute to cognition, reasoning, and decision-making by helping actors anticipate real-world events. Forrester (Reference Forrester1971), for example, emphasizes that people do not carry complete models of the world, but utilize selected concepts and relationships to represent systems. The implication of Forrester’s thinking is that concepts within the model have value/utility for how an actor perceives or understands a system. More recent theories, such as the mental model theory of reasoning (Johnson-Laird & Byrne, Reference Johnson-Laird and Byrne1991), argue that reasoning does not operate based on logical considerations but based on individuals’ mental models. According to this view, reasoning is based on the construction and comparison of different mental models, with the concepts within the models still being a major determinant of the decision-making process. The mental model theory of reasoning is supported by evidence from a small number of experimental studies that demonstrate that people rely on mental models such as analogical schemes for decision-making (Collins & Gentner, Reference Collins, Gentner, Holland and Quinn1987; Gentner & Gentner, Reference Gentner, Gentner, Gentner and Stevens1983) and that these models are present in working memory (Johnson-Laird, Reference Johnson-Laird1983, Reference Johnson-Laird and Posner1989). Discussed in more detail later, cognitive-affective mapping is one of an array of visualization methods emphasizing that the structure and context of a person’s thinking process are fundamental to its resolution.
In addition to the literature in psychology, a second literature exists in the computer and social sciences. Within this second literature, cognitive maps are generally associated with diagrammatic representations of a system, though examples may include an individual’s internal representation. In 1976, Axelrod introduced a form of cognitive mapping for representing social scientific knowledge. These maps (signed digraphs) depicted concepts as nodes and connections as bivarient edges, with the sign of the edge indicating a positive or negative causal relationship. Axelrod structured his maps so that they could be summarized using an adjacency matrix, allowing for causal chaining information to be extracted.Footnote 3
Unfortunately, Axelrod’s maps are too rigid to be applied to knowledge systems that display complex or nontransparent causes. To overcome this problem, Kosko (Reference Kosko1986) proposed the idea of fuzzy cognitive maps (FCMs). FCMs are signed digraphs that allow for the relationships between concepts to be represented as real numbers. The flexibility of FCMs allows modelers to capture the ambiguity of causal relationships, including the “hazy degrees of causality between hazy causal objects (concepts)” (Kosko, Reference Kosko1986, p. 65). Two further benefits of FCMs over early diagrammatic models are that multiple FCMs could be combined into an augmented matrix (Kosko, Reference Kosko1992; Laszlo et al., Reference Laszlo, Artigiani, Combs and Csányi1996) and that FCMs allow for exploration of the effects of policy options on a given domain (Kosko, Reference Kosko1987, Reference Kosko1988, Reference Kosko, Dubois, Prade and Yager1993). Early works focused on applications of FCMs to map, study, and model the behavior of complex environments and dynamic systems (Dickerson & Kosko, Reference Dickerson and Kosko1993, Reference Dickerson and Kosko1996a, Reference Dickerson and Kosko1996b) or virtual environments (Dickerson & Kosko, Reference Dickerson and Kosko1996a). Today, FCMs are widely applied in natural resource management to explore different policy options for the management of ecological systems, often through the integration of local and scientific knowledge about a given domain (Gray et al., Reference Gray, Gray, De Kok, Helfgott, O’Dwyer, Jordan and Nyaki2015; Hobbs et al., Reference Hobbs, Ludsin, Knight, Ryan, Biberhofer and Ciborowski2002; Hoffman et al., Reference Hoffman, Lubell and Hillis2014; Kok, Reference Kok2009; Papageorgiou & Kontogianni, Reference Papageorgiou and Kontogianni2012; Vanermen et al., Reference Vanermen, Muys, Verheyen, Vanwindekens, Bouriaud, Kardol and Vranken2020). Other applications include the study of agricultural development (Roberts et al., Reference Roberts, Byg, Faccioli, Novo and Kyle2021), banking regulation (Paiva et al., Reference Paiva, Ferreira, Carayannis, Zopounidis, Ferreira, Pereira and Dias2020), and international security (Sharif & Irani, Reference Sharif and Irani2006).
In addition to FCMs, there are a variety of modeling techniques that capture different facets of mental models such as individual or group representations (see Jones et al., Reference Jones, Ross, Lynam, Perez and Leitch2011). Jones et al. (Reference Jones, Ross, Lynam, Perez and Leitch2011) categorize the different modeling approaches according to whether they use indirect and direct elicitation. Indirect elicitations methods extract models from written documents, speeches, or conversations (Carley & Palmquist, Reference Carley and Palmquist1992). Indirect methods include the transect walk method (Abel et al., Reference Abel, Ross and Walker1998) and consensus analysis (Stone-Jovicich et al., Reference Stone-Jovicich, Lynam, Leitch and Jones2011). The transect walk method, for example, elicits causal understandings using a combination of open-ended and semistructured interview questions, while consensus analysis focuses on defining cultural knowledge in terms of the agreement or overlap between people in a group.
Direct elicitation, the focus of the present study, “requires interviewees to form a representation of their understanding of a given issue” (Jones et al., Reference Jones, Ross, Lynam, Perez and Leitch2011, p. 8), which often involves asking participants to draw a diagrammatic representation using pictures, symbols, or words that are either generated spontaneously by the participant or provided by an interviewer. Direct approaches include conceptual content cognitive mapping (Austin, Reference Austin1994; Kearny et al., Reference Kearney, Bradley, Kaplan and Kaplan1999; Kearney & Kaplan, Reference Kearney and Kaplan1997; Tikkanen et al., Reference Tikkanen, Isokääntä, Pykäläinen and Leskinen2006), the approach to FCMs from Ozesmi and Ozesmi (Reference Özesmi and Özesmi2004), the diagrammatic interview method used by Dray et al. (Reference Dray, Perez, Jones, Le Page, Aquino, White and and Auatabu2006), concept mapping (Ausubel et al., Reference Ausubel, Novak and Hanesian1968; Novak and Gowin, Reference Novak and Gowin1984), and cognitive-affective mapping (Thagard, Reference Thagard and McGregor2010). While all of these methods rely on the generation of a diagrammatic representation, they differ according to the properties that participants assign to the concepts and their interconnections. For example, FCM focuses on the strength and causal ordering of the links between concepts, while CAM emphasizes the emotional value of concepts and is unconcerned with causal directionality (Findlay & Thagard, Reference Findlay and Thagard2014). In the next section, we provide a more detailed discussion of CAMs and their significance for the study of political attitudes.
An introduction to cognitive-affective mapping
Emotion and politics
There is a significant literature on the relationship between emotions and politics, with empirical roots dating back to the 1980s and theoretical roots dating back to ancient Greece (Marcus, Reference Marcus, Sears, Huddy and Jervis2003; Nussbaum, Reference Nussbaum1996). Within the empirical literature, most of the research falls into two camps (Marcus, Reference Marcus, Sears, Huddy and Jervis2003). First are dual-process models; these approaches treat emotion and reason as separate or opposing processes. Many projects relying on this concept of emotion choose to focus on how the reliance on emotive versus reasoned decision-making affects outcomes such as political attitudes, partisan attachment, or polarization (Arceneaux & Vander Wielen, Reference Arceneaux and Vander Wielen2017; Redlawsk, Reference Redlawsk2002; Redlawsk, Reference Redlawsk2006; Sears et al., Reference Sears, Lau, Tyler and Allen1980;). On the other side are discrete-process models. These approaches identify the effect of discrete emotions (disgust, envy, pride, hope) on behavior and decision-making. The classic study by Abelson et al. (Reference Abelson, Kinder, Peters and Fiske1982) investigated the emotions that individuals experience when viewing presidential candidates during an election (Abelson et al., Reference Abelson, Kinder, Peters and Fiske1982;). Similarly, research by Bucy focused on how the arousal, valence, and potency of political displays such as actions or statements during public debates impacts the perception of individual candidates among different partisan or ideological groups (Bucy, Reference Bucy2000; Bucy & Bradly, Reference Bucy and Bradley2004; Grabe & Bucy, Reference Grabe and Bucy2009).
While both are important, these previous approaches operationalize the relation between emotions and decision-making differently according to their research question. Building on more recent research in the cognitive science of emotion, the operationalization of emotion in this project is theoretically distinct and unrelated to these alternatives. We focus on explaining our approach, which is based on the theory of emotional coherence. For extensive discussions about the benefits and limitations of dual-process models and discrete approaches to emotion and politics, see Marcus (Reference Marcus, Sears, Huddy and Jervis2003), Marcus et al. (Reference Marcus, Neuman and MacKuen2000), and Cornelius (Reference Cornelius1996).
Current framework
Developed by cognitive scientist Paul Thagard, cognitive-affective mapping is a direct mental modeling approach for visually depicting the content of belief systems. The structure of a CAM is intended to approximate, but does not actually represent, the activity of neural networks within the human brain, where the activation of one concept leads to the activation of another according to a characteristic pattern (Thagard, Reference Thagard and McGregor2010). The products of this method—cognitive-affective maps (CAMs)—are models of an individual’s beliefs about a particular subject, for example, the introduction of the carbon tax (Homer-Dixon et al., Reference Homer-Dixon, Maynard, Mildenberger, Milkoreit, Mock, Quilley, Schröder and Thagard2013). The structure of CAMs is based upon the theory of emotional coherence, which maintains that (1) mental representations such as concepts and beliefs have evaluations (valences) attached, which can be broadly classified as positive, negative, or neutral; (2) the activation of one mental representation triggers the activation of others, whether the felt relationship between connected concepts is complementary or opposed; and (3) these interactions generate a pattern whereby the valence of an element is, to a large degree, related to the valence and acceptability of all the elements to which it is connected (Thagard, Reference Thagard2018, p. 249).Footnote 4 In other words, emotional concepts should tend to connect with other “emotionally” similar concepts.
At a theoretical level, each map is a visual representation of the connections between concepts within an individual’s neural network—a representation of how individuals think as well as feel about concepts and their relationships to one another (Findlay & Thagard, Reference Findlay and Thagard2014; Thagard, Reference Thagard and McGregor2010, Reference Thagard2011, Reference Thagard2012a, Reference Thagard and Sun2012b, Reference Thagard and Martinovski2014). An example is the concepts, good or bad, that individuals associate with the carbon tax. At a practical level, a CAM represents a belief system as a network, using shapes and colors to represent concepts and their associated emotions and lines to represent relationships between concepts (Thagard, Reference Thagard and Martinovski2014). It is our hope that CAM offers a means to operationalize coherence as a measurable property accessible to network analysis and other quantitative methods. Furthermore, we hope that coherence and other network properties contribute explanatory value to the study of political phenomena.
As argued by Thagard (Reference Thagard and Martinovski2014), cognitive maps are relevant to the study of politics because representing beliefs as sets of connected concepts allows one to recognize distinct patterns in decision-making and other kinds of inference. Furthermore, cognitive-affective maps provide a means to directly incorporate emotional values into the representation of beliefs (Findlay & Thagard, Reference Findlay and Thagard2014; Thagard, Reference Thagard and McGregor2010, Reference Thagard2011, Reference Thagard2012a, Reference Thagard and Sun2012b, Reference Thagard and Martinovski2014), which research shows to be indispensable to human perception, understanding, and decision-making (Damasio, Reference Damasio1994; Loewenstein et al., Reference Loewenstein, Weber, Hsee and Welch2001; Thagard, Reference Thagard2006; Vohs et al., Reference Vohs, Baumeister and Loewenstein2007). In other words, concepts, beliefs, and goals all come with emotional valences that are as important to cognition and decision-making as logical or computational reasoning (Damasio, Reference Damasio1994; Saver & Damasio, Reference Saver and Damasio1991; Sapolski, Reference Sapolsky2017). Therefore, steps must be taken to integrate these emotional valences into the study of political phenomena. Discussed further in our Method section, CAMs, like FCMs, have quantifiable structural properties (see Figure 1) that can be analyzed using network analysis (Faust, Reference Faust2006; Faust & Skvoretz, Reference Faust and Skvoretz2002; Kolaczyk & Csárdi, Reference Kolaczyk and Csárdi2014). A value of the CAM tool for research in political science is that it captures the significance of emotions to attitude, belief, and value structures in a way that is comparable between individuals.
Summary of basic CAM properties. The software drawing tool developed for this project is available at https://cognitiveaffectivemaps.herokuapp.com/.

Based on the theory of emotional coherence, the fundamental theory underlying CAM, the principal assumption of the project is that the structural relationships captured by the graphs (CAMs) should be indicative of how individuals think about a given political issue (Simon et al., Reference Simon, Stenstrom and Read2015; Thagard, Reference Thagard2000). Coherence is the central process for problem-solving or decision-making in a network of mental representations (Thagard, Reference Thagard2000, Reference Thagard2006).Footnote 5 For a belief system to remain stable, each activation in the cognitive-affective network must be logically and/or emotionally associated with the next in a pattern that maintains the system in an overall state of equilibrium. If it is not in equilibrium, the system will adjust until it is. If new information is introduced in the form of new concepts, new links between concepts, or changes to the valences attributed to existing concepts, additional changes will follow until the resulting network is again coherent. Attitudinal change, therefore, necessitates changes to several nodes and links simultaneously, restructuring the network in a manner that maintains coherence at the system level. This view of an updating and coherent emotional network is supported by physiological evidence collected by Simon et al. (Reference Simon, Stenstrom and Read2015). The takeaway for the study of politics is that the network properties of a CAM, especially coherence, should have a meaningful and predictive relationship to an individual’s attitudes or beliefs in a domain.
It is in this way that CAM can provide researchers a deeper understanding of a belief system: how it “feels” to a person holding it, and how it affects that person’s perception of the world. Using the properties of emotional coherence, CAM can show how an idea or symbolic attachment that may seem nonsensical to outsiders can be remarkably powerful and stable for those that possess it. CAM can also allow researchers to understand or explore how specific changes to that system—such as exposure to new concepts—may or may not impact an individual’s perspective. This ability to clarify how concepts are perceived differently by different actors, in their relational meaning as well as their level of importance, can offer insight into which aspects of belief systems are or are not open to change.
Limitations
A limitation of this approach is that someone constructing a CAM must start with a body of evidence from which inferences about the subject’s beliefs and emotions can be drawn—for example, a speech, an article, a historical document, or an inference extrapolated from behavior. The structure of the CAM, therefore, depends to a large degree on the initial target stimulus. However, the benefit of this method is that it allows for input from a variety of sources. CAMs could be drawn from an analysis of texts, from survey or interview data, even by subjects themselves, or through a combination of such sources.
The immediate benefit of this method is that it allows us to treat ideas as units of data that can be factored into rational (intentional) assessments of behavior as much as more measurable objects such as voting intention or issue preferences. The ability to visualize ideas as real and comprehensible thought processes enables researchers to make claims about the nature and function of belief that are testable against a body of empirical evidence—for example, support for or opposition to a specific political issue. Most significantly, CAMs can illustrate the centrality of emotion (positive or negative) to any decision process. While other approaches treat emotion and reasoning as oppositional processes, CAMs incorporate emotions directly into the network. The resulting depiction is a more accurate representation of how emotions contribute to decision-making than is maintained by the more common dual-process models (Marcus, Reference Marcus, Sears, Huddy and Jervis2003; Thagard, Reference Thagard2018).
A second concern is that the application of such a simple syntax to something as complex as a belief system leaves this method open to charges of reductionism. Breaking down mental representations into individual words or phrases vastly oversimplifies both their semantic content and the cognitive structures that support them. While CAMs are intended to approximate the pattern activity of neural networks, they do not literally represent the brain’s neural networks; each object in a CAM stands in itself for a complex network of processes (Thagard, Reference Thagard and McGregor2010). Attributing to each object only positive, negative, or neutral valence also obscures varied nuances of emotion. For reasons of parsimony, CAMs must represent emotion simply as either positive (pleasurable) or negative (unpleasant), neutral, or ambivalent for any given concept. Unlike in multifactor or discrete models of emotion, this method cannot draw out the vast and often significant differences between the positive emotions of, say, happiness, pride, exuberance, contentment, and arousal, or the negative emotions of anger, hate, jealousy, disgust, and frustration (Fontaine et al., Reference Fontaine, Scherer, Roesch and Ellsworth2007; Morgan & Heise, Reference Morgan and Heise1988; Rogers et al., Reference Rogers, Schröder and von Scheve2014; Scherer et al., Reference Scherer, Dan and Flykt2006). Given this limitation, for this project, we are interested in the value of structured thinking as captured by CAMs and not the extent to which CAMs are generalizable to actual networks within the brain.
Third, while CAMs are not a new methodological tool, this study is the first attempt to conduct an empirical analysis of the value of CAMs’ structural properties. As a result, we have no direct information about the relationship between structured thinking and issue agreement upon which to base formal hypotheses. Consequently, we leave hypothesis testing for future studies and structure this article around a series of exploratory questions.
Research objectives
This project has three objectives:
-
1. To evaluate the extent to which differences in network structures predict support for or opposition to the introduction of the carbon tax in Canada.
-
2. To evaluate the extent to which differences in network structures predict knowledge and sophistication about the introduced carbon tax.
-
3. To compare the predictive value of the emotional measures of overall CAM valence with traditional alternative survey measures: (1) party identification and (2) ideological orientation (self-report).
We selected the carbon tax for this exercise because it is a highly visible and emotive issue within Canadian public and political discourses. It is an issue that has only recently become polarizing along ideological and political party lines, and it is expected to continue to do so over the near future (Tasker, Reference Tasker2021; Vomiero, Reference Vomiero2019; see also Milkoreit, Reference Milkoreit2017). For the development of a CAM, the emotion and visibility around an issue are more important than the policy specifics (Thagard, Reference Thagard2019).
To structure our analysis, we report our results as responses to nine exploratory questions on the value of emotional and structural network properties to predict support for the carbon tax as well as political interest, issue sophistication, and issue familiarity. In studying the structural network properties, we focus on the properties of density and centrality, which previous studies indicated are significant predictors of individual connotation and experience (Mansell et al., Reference Mansell, Reuter, Rhea and Kiesel2021). To simplify our reporting, we focus on attitudes toward the carbon tax assessed on a 7-point Likert scale. Additional models using a discrete outcome (agree/disagree) are reported in the supplementary material online. The two approaches produce similar statistical trends.
Emotional network properties
The method of CAM construction used in this study delivers a snapshot of individuals’ attitudes about the introduction of the carbon tax. A drawback of this method is that it does not capture the dynamic process of updating and equilibrium that characterizes the property of emotional coherence as defined by Thagard (Reference Thagard2000, Reference Thagard2006). Consequently, we operationalize coherence as a network property by which the nodes of a given valence tend to share connections with similarly valenced nodes. For theoretical clarity, we refer to this proxy as the emotional dependence of the network.Footnote 6 We construct two primary measures of emotional dependence: (1) the extent to which the entire CAM is composed of similarly valenced (positive, negative, or neutral) nodes, and (2) the extent to which central nodes are connected to other nodes that share the same valence (see section Coherence and emotional network properties). In addition to emotional dependence, we consider a CAM’s overall valence, which is assessed using the percentages of positive, negative, and neutral nodes within the CAM as well as a measure of adjusted valence that incorporates the emotional strength of individual positive and negative nodes (+/–1 = weak, +/–2 = moderate, +/–3 = strong). A full description of these measures is included in the Data analysis section.
Using these measures, we investigate five questions about the relationship between emotion about and support for the introduction of the carbon tax:
Q1: Do higher levels of emotional dependence predict attitude strength toward the introduction of the carbon tax?
Q2: Does the emotional dependence of the networks correlate with support for the carbon tax?
Q3: Is unfamiliarity with the carbon tax correlated with lower levels of emotional dependence?
Q4: Is the emotional valence of the CAM correlated with support for the carbon tax?
Q5: How does emotional valence compare with party identification and self-reported ideology as a predictor of support for the carbon tax?
Discussed in the Analysis section, the relationship between emotional dependence and stronger attitudes toward the carbon tax (Q1) is assessed by recoding the 7-point scale question on support for or opposition to the carbon tax into a 4-point scale of attitudinal strength.
Structural network properties
We are also interested in the value of structural properties such as density and centrality for predicting support for or opposition to the carbon tax. There are several reasons to surmise that the properties of density and centrality could be meaningful for understanding political attitudes. However, the evidence in support of this premise is indirect. For example, generalizing from social networks in which low density is associated with fragility, low levels of density in CAMs could correlate with more unstable political attitudes, similar to those seen in people with low levels of political engagement or sophistication (Ward et al., Reference Ward, Stovel and Sacks2011; Wei et al., Reference Wei, Joseph, Liu and Carley2015). In the study of memory, memorization, retention, and recollection of concepts are strongly associated with network connectivity (Foster et al., Reference Foster, Roosa, Drago, Branch, Finney and Heilman2013; Hill et al., Reference Hill, Allen and McWhorter1991). In political science, memorization and recollection of facts are frequent predictors of preference, issue support, and sophistication (Druckman & Lupia, Reference Druckman and Lupia2000). Further, the premise that different attitudes reflect differences in structured thinking (analogical mental models) is consistent with research in public opinion (Delli Carpini & Keeter, Reference Delli Carpini and Keeter1996; Goren, Reference Goren2004; Luskin, Reference Luskin and Kuklinski2002; Sniderman et al., Reference Sniderman, Brody and Tetlock1993; Zaller, Reference Zaller1992), political behavior (Arceneaux & Vander Wielen, Reference Arceneaux and Vander Wielen2017), and ideology (Carney et al., Reference Carney, Jost, Gosling and Potter2008; Conway et al., Reference Conway, Gornick, Houck, Anderson, Stockert, Sessoms and McCue2016; Dodd et al., Reference Dodd, Balzer, Jacobs, Gruszczynski, Smith and Hibbing2012; Eidelman et al., Reference Eidelman, Crandall, Goodman and Blanchar2012; Hibbing et al., Reference Hibbing, Smith and Alford2014; Hinze et al., Reference Hinze, Doster and Joe1997; Jost et al., Reference Jost, Glaser, Kruglanski and Sulloway2003; Jost et al., Reference Jost, Kruglanski, Simon, Thompson, Levine and Messick1999; Kanai et al., Reference Kanai, Feilden, Firth and Rees2011; Schreiber et al., Reference Schreiber, Fonzo, Simmons, Dawes, Flagan, Fowler and Paulus2013; Talhelm et al., Reference Talhelm, Haidt, Oishi, Zhang, Miao and Chen2015; Tetlock, Reference Tetlock1984) demonstrating a correlation between how people think and what people think.
To understand the possible relationships between CAMs’ structural properties and political attitudes, we investigate the following questions:
Q6: Are network density and centrality correlated with political interest?
Q7: Are network density and centrality correlated with issue sophistication?
Q8: Are network structures correlated with familiarity with the carbon tax?
Q9: Are network density and centrality correlated with agreement with the carbon tax?
Descriptions of political interest and issue sophistication are provided in the Analysis section.
Method
Sample
We recruited a sample of (n = 140) Canadian participants over the age of 18 from the online research platform Prolific. The use of an online sample is a deviation from our original pre-analysis plan. The details of this deviation are provided in the supplementary material.
During data cleaning, we excluded 20 participants for incomplete responses and one participant for duplicate responses (n = 118). An additional seven participants were excluded for having fewer than three nodes or two links in their CAM, leaving a final sample of 111 participants. Sample size in this study was set by practical considerations about the availability of research funds provided by the grant. As the first empirical test of CAMs, we lacked prior statistics on the network properties (mean nodes and connections) with which to identify the required minimum number of observations. To determine whether sufficient power is available for each exploratory question, we administered a post hoc analysis in GPower 3.1 examining the significance of change in slope under a t distribution. Reported in the Table 120 of the supplementary material, the results indicate that most models are sufficiently powered (1 – β > 0.80); however, exceptions are observed for Questions 1, 3, and 8, where several results are underpowered. As a result, we caution readers when interpreting their significance.
Sample identification is 50.45% male and 49.55% female, the mean age is 33.1 years, and ethnicity is 64.86% white Caucasian. A total of 69.37% of the sample indicate that have at least a four-year college degree, the sample mean household income is $60,000–$75,000 in Canadian dollars, and 47.75% of participants identify religion as being very or somewhat important to their life. Sample ideological orientation based on a 7-point Likert scale is 67.57% liberal, 6.31% neither liberal nor conservative, and 26.13% conservative. Lastly, on the question assessing whether participants agree or disagree with the carbon tax on a 7-point Likert scale, 17.13% disagree, 8.11% neither agree nor disagree, and 74.78% agree.
Data collection
Data collection for this study occurred between January 11 and January 13, 2021. This data collection was divided into two sections. In Section 1, participants completed the CAM exercise and answered questions about their attitudes toward the introduction of the carbon tax. In Section 2, participants completed the remaining demographic questions and attitudinal measures. Section 1 took approximately 30 minutes to complete, while Section 2 took approximately 15 minutes. Participants were authorized to access Section 2 after completing Section 1. No more than a nine-hour delay separated the completion of Section 1 and the authorization for Section 2. The standardized currency of Prolific is British pounds (£). Participants were paid £3.75 for completing Section 1 and a further £4.25 for completing Section 2, a total payment of £8 ($13.84 in Canadian dollars). In total, 158 respondents logged into Section 1 of the study, a completion rate of 70%. This project obtained ethics approval #4227_e_2020 on May 11, 2020, from the Université du Québec à Montréal.
Section 1 (CAM Exercise). Prior to the CAM exercise in Section 1, participants completed a visual tutorial in the CAM application package that instructed participants on how to draw a CAM. This tutorial did not employ political concepts but demonstrated the method using a neutral life event, listing the costs and benefits of shopping at a farmers market. During the CAM exercise, participants were encouraged to refer to the visual tutorial and instructed to leave it open as a reference guide.
To assess participants’ attitudes toward the carbon tax, participants first read a short vignette from a well-known Canadian publication, Chatelaine Magazine, that described the carbon tax in neutral language (Table 1). After reading this vignette, participants were instructed to “draw a CAM of the ideas, thoughts, and feelings that you associate with the introduction of the federal carbon tax” (Table 2). After completing this exercise, participants answered a series of questions about climate change; these questions were taken from the 2008–2017 Climate Change in the American Mind national public opinion survey (Leiserowitz et al., Reference Leiserowitz, Maibach, Roser-Renouf, Rosenthal and Cutler2017). The wording of these questions was adjusted for a Canadian sample. The presentation order of these batteries was fully randomized.
Vignette.

CAM question.

Section 2 (Demographic and Survey Questions). In Section 2, after completing the CAM exercise, participants completed a series of demographic questions taken from the 2011 Canadian Election Study. Participants also completed measures of ideological orientation (self-report orientation and a modified Wilson-Pattern index), party identification, Big Five personality, the need for cognition, the need for affect, and a seven-item measure of issue sophistication. Except for the demographic questions (presented first), the presentation order of all batteries was fully randomized. Where applicable, the presentation order of questions within batteries was also randomized.
Data analysis
The structure of CAMs, a series of linked concepts (nodes) and connections (edges), naturally lends itself to quantitative assessment through network analysis. The primary aim of this study is to test the ability of CAMs to predict political attitudes. For this study, we consider individual CAMs to be undirected networks. We define CAM networks as distinct from Bayesian networks since we are not exploring the probabilistic aspects of the graph. This approach belongs to the latent space family of network models. The function of latent models is to evaluate how similarities between network structures relate to the domain of interest. Because we are interested in how network structures impact political attitudes, a latent approach is most appropriate.
To analyze the CAMs, we treat each CAM’s emotional (nodal) and structural properties as network properties, creating variables to represent the extent to which an individual’s CAM structure depends on these characteristics—for example, the extent to which a CAM depends on positive, negative, neutral, or ambivalent nodes. In total, we operationalize nine emotional network measures: (1) diversity, (2) emotional dependence of central node #1, (3) emotional dependence of central node #2, (4) CAM valence #1, (5) CAM valence #2, (6) percentage of positive nodes, (7) percentage of negative nodes, (8) percentage of neutral nodes, and (9) percentage of ambivalent nodes. The use of different coding for the emotional dependence of the central node and CAM valence reflects different treatments of ambivalent nodes containing both positive and negative valences. Coding 1 does not include ambivalent nodes, and Coding 2 treats them as neutral nodes; in this manner, they contribute to the average.Footnote 7
In addition to emotional measures, we operationalize 11 structural network measures: (1) density, (2) degree centrality, (3) eigenvector centrality, (4) betweenness centrality, (5) assortativity, (6) triadic closure, (7) diameter, (8) number of nodes, (9) number of edges, (10) number of dashed edges (links between concepts that are in emotional opposition to one another, positive/negative), and (11) number of solid edges (links between emotionally compatible concepts, positive/positive). The definitions of all variables are discussed later. The network variables were extracted using Python by applying the networkx (https://networkx.org/documentation/stable/citing.html), numpy (https://numpy.org/citing-numpy/), and scipy (https://www.scipy.org/citing.html) packages.
Coherence and emotional network properties
The analysis focuses on the explanatory value of CAMs’ emotional variables—specifically, the extent to which the emotional coherence of a CAM predicts an individual’s attitudes toward the carbon tax. As a proxy for emotional coherence, we construct a series of network measures capturing (in different ways) the extent to which a CAM depends on different patterns of emotional valence.
The first measure is diversity. Based on Simpson’s diversity index, this measure of diversity takes account of the number of species present (types of different nodes) as well as the relative abundance of each species. For the present study, this means that as the presence of nodes of differing valence as well as the evenness of their distribution increase, the diversity of the CAM increases.
The second measure is the emotional dependence of the central node. Like the measure of diversity, this measure considers the extent to which the central node of a CAM is connected to nodes of the same valences. To construct this measure, we define a central node as the node with the highest score on degree centrality. A simple counting measure of degree centrality is used to simplify the interpretation of this variable (it refers to the node with the highest number of edges).
As discussed, two codings of these measures are provided. In the first, we assign +1 to the emotional dependence score for each connected node (dashed or solid edge) with the same valence. We do not include valence strengths (i.e., strong positive > positive). We assign a value of –1 to the emotional dependence score for each connected node with a difference valence; that is, if the central node is positive and connected to a node of either negative, neutral, or ambivalent valence. In the second coding, dashed edges connecting two nodes of different valences are treated separately from solid edges connecting nodes of two different valences. We assign +1 to the emotional dependence score for each node with the same valence connected by a solid edge. If the nodes are connected by a dashed edge and have different valences, we also assign +1 to the emotional dependence score. Otherwise, we subtract 1 from the score. That is, if a positive central node is connected to a negative node by a dashed edge, we add +1 to the emotional dependence score. To normalize our results, scores are divided by the number of connections to the central node. The normalized measures can range from –1 to +1, with an emotionally incoherent graph resulting in a score of –1 and a completely coherent graph a score of +1.
The third measure, CAM valence, indicates the overall emotional orientation of a CAM, ranging from –2 (negative valence) to +2 (positive valence). This measure is based on the number of nodes and the strength of their respective valences (weak/strong). Depending on the node’s valence, positive (+) or negative (–), each node can have a value of weak (1), moderate (2), or strong (3). This estimation is normalized for the number of nodes in each CAM. Two codings of this measure are provided. In Coding 1, ambivalent nodes are excluded from the analysis. In Coding 2, ambivalent nodes are treated as neutral nodes, meaning that they do not contribute to positive or negative values but reduce the sum value of positive and negative nodes.
The final measures of emotional dependence are the percentages of positive, negative, and neutral nodes in a CAM. The percentage of ambivalent nodes is excluded from consideration, as only six participants in our sample utilized this valence; however, the number of ambivalent nodes is accounted for when calculating the percentages of positive, negative, and neutral nodes.
Structural network properties
In addition to emotional coherence, we are interested in the extent to which the structural network properties of network density and centrality predict individuals’ political interest, familiarity with carbon tax, and issue sophistication. As discussed previously, our interest concerns the relationship between cognitive complexity, memory, and attitude stability (see Mansell et al., Reference Mansell, Reuter, Rhea and Kiesel2021 for a discussion of this relationship)—for example, whether complex or interconnected networks may be indicative of greater issue salience, attitudinal stability, or attitude sophistication. To answer these questions, we operationalized the following series of network measures. An open-source code is available for each of these calculations at https://osf.io/pxnvz/.
Centrality is broadly defined as a measure of nodal importance. There are multiple measures of centrality, and each measure uniquely probes different network properties. Measures are typically selected according to an a priori definition of importance, such as the importance of local or global network properties to a given research question. As an a priori definition is not available for this study, we use three common measures of centrality: degree, betweenness, and eigenvector centrality. We define each of these measures next. (For a more detailed discussion, see Airoldi et al., Reference Airoldi, Blei, Fienberg, Goldenberg, Xing and Zheng2008; Crawford et al., Reference Crawford, Gera, House, Knuth, Miller, Cherifi, Gaito, Quattrociocchi and Sala2016; Ghali et al., Reference Ghali, Panda, Hassanien, Abraham, Snasel and Abraham2012; Kolaczyk, Reference Kolaczyk2009.)
Degree. The most basic measure of centrality is known as degree centrality. It is simply a counting measure of the degree of a node, where the definition of a degree comes from classical graph theory: the degree of a node is the number of adjacent edges. This measure gives a simple baseline calculation for the most important nodes. Studying the statistics of degree centrality allows for easy comparison between an ensemble of graphs and indicates the naive connectedness/complexity of the individual graphs. In other words, degree centrality identifies the most important nodes based on their numbers of connections. The higher the centrality score, the more a network is dependent on a small number of highly connected nodes.
Betweenness. Betweeness is a relatively straightforward measure of centrality, indicating how many times an individual node is on the shortest path between two other nodes. In calculating betweenness, we gain an understanding of which nodes have a greater influence on other nodes. This is particularly important when trying to pinpoint concepts considered authoritative in a graph. Higher levels of betweenness characterize a graph whose flow of information is dependent on a small number of nodes.
Eigenvector. Eigenvector centrality extends the idea of betweenness to the entire graph. In calculating the eigenvector measure, we determine which nodes affect the graph globally by exploring not only a single node’s connection but also its neighbors’ connections. Eigenvector centrality is traditionally applied to graphs; here, we apply it as a comparative measure of the extent to which different graphs are influenced by single nodes.
Density. A measure of the connectedness of a network, density is defined as the actual number of ties in a network, expressed as a proportion of the maximum possible number of ties. It is a number that varies between 0 and 1. When density is closer to 1, the network is said to be dense; otherwise, it is sparse. Density is a convenient initial measure of the interrelatedness of concepts in a mental model. The higher the density, the more individuals are relating their concepts to one another. A sparse network indicates that either a few key non-interconnected concepts are at the heart of an individual’s mental representation or the individuals conceive of the policy through subsets of concepts that are not directly connected.
Triadic closure. We also investigate the clustering of a network, which is a measure of network transitivity. According to Faust (Reference Faust2006), the transitivity of a network measures the likelihood of two nodes, i and j, being connected if they are both connected to a third node, k. Triadic closure is a common measure of clustering that measures the ratio of completed triangles within a graph over the number of all possible triplet pairs.
Diameter. A measure of the expansiveness, the diameter of a network is the longest shortest path from one point to another. If you take all the shortest paths between every node, the diameter is the longest of those.
Assortativity. Assortativity is a measure of network exclusivity, or the tendency of nodes in a graph to link to other nodes which display similar properties. Assortativity is an interesting measure for examining networks because it considers the global properties of the graphs (Estrada et al., Reference Estrada, Hatano and Gutierrez2008). A limitation of this measure is that it is a black-box calculation by the networkx package; therefore, we have no information about how this measure identifies or defines “similar” properties within networks. As a result, we place minimal emphasis on this measure in the analysis of results.
Analysis
The focus of our analysis is a comparison of structural properties among multiple networks of differing size. Comparing network statistics across networks is not straightforward, as the distribution of network statistics across networks can vary depending on the size and density of the network, causing the scale of the network statistic—and thus the meaning—to change from one network to another (Faust, Reference Faust2006). Before constructing our statistical models, we correct all network statistics for these using the previously described normalizing procedures developed by Faust and Skvoretz (Reference Faust and Skvoretz2002). Normalization procedures are implemented in Python using the Networkx and Gephi packages. Because each CAM is generated by a novel individual, issues of interdependence that often arise in network comparison studies are not present. Consequently, it is appropriate to use these covariates within a linear model.
We fit these operationalized network measures into a series of linear (OLS) regressions with robust confidence intervals and reported results based on two-tailed tests. Prior to the analysis, a Pearson’s test of normality is performed on all network measures. Logistic or hyperbolic-sine transformations were used to compensate for deviations from normality on the following variables: diversity, emotional dependence 1 and 2, node count, edge count, number of solid links, number of dashed links, percentage of negative nodes, percentage of neutral nodes. To allow for a meaningful comparison of effect sizes, all network variables were standardized prior to the statistical analysis.Footnote 8 For simplicity, we report the results of unconditioned models but list the results of conditioned models with controls for age, education, ethnicity, gender, income, religious importance in the supplementary material. These models display similar statistical trends with meaningful deviations discussed in the text.
In the analysis reported here, attitudes toward the introduction of the carbon tax are assessed on a 7-point Likert scale (strongly disagree–strongly agree). Additional results based on a discrete (agree/disagree) scale are reported as logistic models in the supplementary material. Attitude strength is assessed by recoding the 7-point measure of attitudes toward the carbon tax (strongly disagree–strongly agree) into a 4-point measure of attitude strength (neither agree nor disagree–strongly agree or disagree). In the analysis of structural network variables, political interest is measured on an 11-point continuous scale: “How interested are you in politics generally?” Familiarity with the carbon tax is assessed on a 5-point scale from “extremely familiar” to “not familiar at all.” Political sophistication is assessed as a composite measure using a series of seven multiple-choice knowledge questions about the carbon tax in Canada, for example, “Which of these provinces did not implement their own carbon regulation strategies? (Manitoba, Newfoundland and Labrador, Nova Scotia, Quebec, I don’t know).” When answering these questions, participants are explicitly told not to guess. Question responses are coded as incorrect (–1), don’t know (0), or correct (1). A full list of these questions is provided in the OSF repository at https://osf.io/qwpvd.
Network summary statistics
The mean number of nodes is 9.77 (SD = 4.47), with a range of 4–27. The mean number of edges is 13.44 (SD = 8.66), with a range of 3–63. The mean number of solid links is 11.06 (SD = 7.83), with a range of 0–47. The mean number of dashed links is 2.13 (SD = 2.38), with a range of 0–14. The mean density is 0.36 (SD = 0.17). Full summary statistics for the network properties are listed in the supplementary material.
Robustness check
To assess the robustness of our data collection, we consider the uniqueness of participants’ CAMs by calculating the probability of replicating a similar CAM randomly. For a given participant’s CAM, we create a probability distribution of the node and link valences. We then create 1,000 CAMs with the same number of nodes and links as the user’s CAM while sampling their valence randomly from the precalculated probability distributions. Additionally, we calculate the second emotional dependence variable for each of the 1,000 CAMs. We then tally the number of random CAMs with a similar emotional dependence score as the participant’s CAM. We define “similar” as being the same value when rounded to the hundredth place. We then apply a Bayesian Inference algorithm implemented in pymc3 to determine the likelihood of constructing a CAM with a similar emotional dependence score. We assume a uniform prior. Our results (see Figure 2) demonstrate a wide range of randomness scores; they vary from ˜16% to ˜90%, indicating the percentage of times that we can randomly reproduce a given graph. The mean randomness score is 58%.
Distribution of scores for the probability of randomly reproducing emotional dependence of each participant’s CAM.

Looking at Figure 2, the first bin in the histogram shows that for 10 CAMs. If we construct 1,000 random CAMs for each participant’s original using the prescription given earlier, approximately 20% of the random CAMs will have a similar emotional dependence value. This indicates that approximately 20% of the randomly generated CAMs are identical (in terms of the emotional dependence variable) to the CAM whose distribution of features served as a seed distribution for the randomly generated CAMs. Moreover, this indicates that the majority (80%) of the randomly generated CAMs do not have similar emotional dependence scores. We note that a considerable amount of users’ CAMs are reproduced by the randomly generated CAMs; however, these values are inflated since the properties of the randomly generated CAMs are pulled directly from a random distribution seeded by the true CAMs’ properties. Additionally, CAMs with simpler structures (fewer nodes) are more likely to be randomly reproduced by the simulation. This is an inherent limitation of this methodology. Given these constraints, we believe the range of randomness scores and the mean randomness score of 58% provide strong evidence that the CAMs constructed in this study reflect intentional decisions on the part of our participants.
Results
Q1: Do higher levels of emotional dependence predict attitude strength toward the introduction of the carbon tax?
To answer this question, we examine the extent to which two measures of emotional dependence, network diversity and the emotional dependence of the central node, correlate with strong support for or opposition to the carbon tax. According to the principles of emotional coherence, higher levels of diversity should be associated with weaker (less consistent) attitudes. The results are summarized in Tables 2 and 3 in the supplementary material. Consistent with expectations, we find a significant negative correlation between the measure of network diversity and attitude strength (coeff. = –0.177, p < .022). This indicates that as CAMs become more emotionally heterogenous, the strength of attitudes (strong support for or opposition to) toward the carbon tax decreases.Footnote 9
Looking at the emotional dependence of the central node, we find no significant relationships on either measure (ED1: coeff. = –0.106, p < .260; ED2: coeff. = –0.106, p < .251). However, we note that both measures show a negative correlation, which is consistent with the measure of network diversity, supporting the conclusion that emotionally heterogenous graphs are associated with weaker attitude positions.
Q2: Does the emotional dependence of the networks correlate with support for the carbon tax?
Question 2 examines the correlations between network diversity and the emotional dependence of the central node with agreement with the carbon tax. Unlike the measure of attitude strength, we do not expect to see significant correlation. This is because these network measures capture the extent to which a CAM depends on emotional structures independently of valence. In other words, the emotional dependence scores for the agree and disagree sides of the measure should, in principle, balance one another. The results are summarized in Table 2 in the supplementary material. Consistent with expectations, we find no significant relationship between the measure of diversity (coeff. = –0.193, p < .345) or the measures emotional dependence (ED1: coeff. = 0.172, p < .166; ED2: coeff. = 0.036, p < .819). This null finding is consistent with the principle of cognitive-affective mapping that agreement with the carbon tax should depend on CAM valence (positive or negative). We return to this issue in Question 4.
Q3: Is unfamiliarity with the carbon tax correlated with lower levels of emotional dependence?
Here, we examine whether network diversity, the emotional dependence of the central node, and the percentage of neutral nodes correlate with familiarity with the carbon tax. Once again, there is no expectation of a result; however, one possibility that is consistent with emotional coherence is that issue unfamiliarity will be correlated with higher levels of diversity or emotional dependence. As summarized in Table 3 in the supplementary material, we find no significant relationship between any of these measures and unfamiliarity with the carbon tax, with one exception. After controlling for demographic factors, the second coding of the variable for the emotion dependence of the central node reaches significance (ED2: coeff. = 0.152, p < .042). This indicates that as the emotional dependence (homogeneity) of the central node increases, unfamiliarity with the carbon tax increases. In other words, individuals who are unfamiliar with the carbon tax incorporate concepts with more diverse emotions into their CAM.
Summary of the independent correlations between structural network properties and carbon tax unfamiliarity.

† p < .100; ** p < .050; *** p < .001.
A limitation of this finding emerges from the distribution of ambivalent nodes, which are included in the second but not the first measure emotional dependence of the central node. To better understand the effect with the second measure, we look at the interaction between emotional dependence of the central node and the percentage of ambivalent nodes. Reported in Table 3 of the supplementary material, we find a significant and positive interaction, which indicates that as the emotional homogeneity of the central node and the number of ambivalent nodes increase, unfamiliarity with the carbon tax also increases. While this effect is consistent with principles of emotional coherence (greater ambivalence equals greater unfamiliarity), the problem is that only six participants in our study utilize ambivalent nodes, and for all six, ambivalent nodes compose 50% of the total nodes. Therefore, the inclusion of ambivalent nodes in the second emotional dependence measure has a disproportionate effect on the relationship between emotional dependence and issue familiarity. Consequently, caution is warranted when accepting the significance of this result, as the high number of ambivalent nodes within this small set of CAMs represents an outlier within our data set that biases the relationship between emotional dependence and unfamiliarity.
Q4: Is the emotional valence of the CAM correlated with support for the carbon tax?
To answer this question, we investigate the correlations between CAM valence and the percentages of different node types on agreement with the carbon tax. According to principles of emotional coherence, we should expect CAM valence and the number of positive nodes to be positively correlated with agreement with the carbon tax. Consistent with expectations, we find positive and significant relationships between both measures of CAM valence and agreement with the carbon tax (Val1: coeff. = 0.833, p < .0001; Val2: coeff. = 0.837, p < .0001). Reported in Table 4 in the supplementary material, this indicates that as individuals’ CAMs become more positive, they are more likely to agree with the introduction of the carbon tax. Second, the percentage of positive nodes is also positively correlated with carbon tax agreement, while the percentage of negative nodes is negatively correlated with carbon tax agreement (Positive: coeff. = 0.397, p < .008; Negative: coeff. = –0.553, p < .001). No significant relationship is observed for the percentage of neutral nodes (coeff. = 0.015, p < .934). Consideration of ambivalent nodes is omitted as only six participants utilize this valence.
Q5: How does emotional valence compare with party identification and self-reported ideology as a predictor of support for the carbon tax?
To answer this question, we consider whether party identification and self-reported ideology moderate the effect of emotional valence. The expectation from principles of coherence is that the emotional valence of a CAM should meaningfully contribute to our understanding of carbon tax agreement in addition to ideological orientation and party identification. The results are presented in Table 5 in the supplementary material. We find that ideological orientation and party identification are both significant predictors of carbon tax agreement. Furthermore, consistent with expectations, these variables do not moderate the relationship between emotional dependence and agreement with the carbon tax. Rather, both emotional and political variables significantly contribute to explaining attitude variation. Noteworthy, the combination of emotional valence and ideological orientation captures nearly 54% of the model variation. Furthermore, the inclusion of demographic controls only moderately increases this effect to 58% of model variation (for the full results, see Tables 32–40 in the supplementary material).
Q6: Are network density and centrality correlated with political interest?
The principles of emotional coherence offer no expectations about the relationship between any latent network structures and attitudes or beliefs. Looking at the correlation between density, degree centrality, eigenvector centrality, and betweenness centrality, we find no significant relationship between these measures and political interest. These results are reported in Table 6A in the supplementary material. In fact, we find no correlation between any structural network measures and political interest. One explanation for these null findings is that the relationship between structural network measures and political measures may depend on the interaction between both political interest and carbon tax familiarity. To answer this question, we consider the interaction between political interest and a reverse-coded measure of carbon tax familiarity (not at all familiar to extremely familiar). Reported in Table 6B in the supplementary material, we find that the interaction between political interest and issue familiarity is negative and significantly correlated with CAM density (coeff. = –0.085, p < .024) and degree centrality (coeff. = –0.088, p < .028). These results indicate that as political interest and familiarity with the carbon tax increase together, the interconnectedness of the CAM declines.
Q7: Are network density and centrality correlated with issue sophistication?
We find no significant relationship between density and issue sophistication, as shown in Table 7A in the supplementary material. Looking at the centrality measures, a significant effect is observed for eigenvector centrality (coeff. = –0.448, p < .002). This indicates that as graphs become more globally dependent on a single node, the level of issue sophistication decreases. Meaningful to the interpretation of this effect is that 71 of the 111 participants in this study included in their central node some reference to the phrase “carbon tax.”Footnote 10 Table 7B in the supplementary material shows that individuals who referenced the carbon tax in their central node have significantly higher scores on eigenvector centrality (coeff. = 0.717, p < .0001). In other words, their central nodes have a much larger impact on their CAM’s structure than those whose central node contained other information. A marginal effect is also observed on the measure of degree centrality (coeff. = –0.288, p < .084); however, after controlling for demographic factors, this effect fails to reach significance. No effect is observed on the measure of betweenness centrality. Positive and significant correlations are also observed on the measure of number of nodes (coeff. = 0.359, p < .025) and edges (coeff. = 0.386, p < .007), as well as assortativity (coeff. = 0.278, p < .034). The full results are reported in Tables 49–51 in the supplementary material.
As with the measure of political interest, we also investigated the possibility that the relationship between structural network measures and issue sophistication depends on an interaction with issue familiarity. Again, we used the reverse-recoded version of issue familiarity (not at all familiar to extremely familiar). Looking at the results in Table 7C in the supplementary material, we find a significant positive interaction between sophistication and familiarity on eigenvector centrality (coeff. = 0.153, p < .012). This indicates that as sophistication and familiarity increase the graphs become more globally dependent on a single node. We also find a significant negative interaction between sophistication and familiarity on network assortativity (coeff. = –0.163, p < .048). This indicates that as sophistication and familiarity increase, CAMs show a decreased tendency for their nodes to connect to other nodes which display “similar” characteristics. A marginal negative interaction is also observed on triadic closure (coeff. = –0.158, p < .80). Unfortunately, as assortativity is a black-box function, we are unable to definitively identify these “similar” characteristics. However, the Pearson’s correlation between assortativity and eigenvector centrality is negative and significant (coeff. = –0.703, p < .001) (see Network Properties in the supplementary material). Eigenvector centrality is also negatively and significantly correlated with triadic closure, a measure of network clustering (coeff. = –0.358, p < .001). Given the correlation of sophistication and familiarity with eigenvector centrality, one possibility is that as these values increase, participants are more likely to connect nodes of heterogeneous valences to a single centralized node such as the carbon tax. This possibility is illustrated in Figure 3.
An example CAM demonstrating high eigenvector centrality. The image is of an actual study participant’s CAM. This participant scored above the mean on political interest, issue sophistication, and eigenvector centrality.

Q8: Are network structures correlated with the familiarity with the carbon tax?
Based on the previously observed interaction effects, we decided to investigate the relationship between structural network measures and familiarity with the carbon tax. Summarized in Table 3, we find significant correlations between issue unfamiliarity and the structural variables: (1) edge count, (2) density, (3) triadic closure, (4) eigenvector centrality, (5) betweenness centrality, and (6) number of solid links. Looking at Table 3, the results suggest that structural measures capturing the interconnectedness of the network are negatively correlated with issue unfamiliarity, while measures capturing the centralization of the network (dependence on a single node) are positively correlated. In other words, participants unfamiliar with the carbon tax tended to produce networks which are dominated by centralized concepts, while individuals familiar with the tax produced more generalized networks whose structure depends on multiple interconnected concepts. The full results are summarized in Table 8 in the supplementary material.
Q9: Are network density and centrality correlated with agreement with the carbon tax?
Looking at the measure of density and centrality, we find no association between these measures and agreement with the carbon tax (see Table 9 in the supplementary material). Furthermore, no associations with the carbon tax are observed on any of the remaining structural measures (see Table 9 in the supplementary material).
Deviations from original pre-analysis plan
This article contains several deviations from the original pre-analysis plan, which are summarized here. First, in the original design, we intended to recruit participants from the Canadian cities of Kitchener-Waterloo and London. However, after several failed attempts to recruit a suitable sample, we recruited an online sample from Prolific. Second, following Faust and Skvoretz (Reference Faust and Skvoretz2002), we planned to conduct a correspondence analysis to evaluate how clusters of latent network properties could contribute to explained variation in participants attitudes toward the carbon tax. However, as none of the latent measures correlate with attitudes toward the carbon tax, it is not appropriate to conduct this analysis. Third, in the original pre-analysis plan, we intended to report the results using both traditional linear and logistic regressions. Because of the smaller than anticipated sample size, we focus on the results obtained using linear regression. Fourth, Question 8 was not in the original pre-analysis plan but emerged organically from our analysis. A detailed summary of the deviations from the pre-analysis plan is reported in the supplementary material.
Discussion
This study developed and tested a network-based approach to implement and analyze cognitive-affective mapping as a tool to study political attitudes. Using the Canadian carbon tax as a case study, we asked participants to draw a CAM of the ideas, thoughts, and feelings that they associate with the introduction of the federal tax. We treated these maps as undirected networks to examine how their emotional (node level) and structural properties correlate with individuals’ attitudes about the carbon tax as well as several secondary measures. Overall, we find several significant findings with implications for the broader study and understanding of political differences.
An important limitation of the current study is the small percentage of participants who disagree with the introduction of the carbon tax (n = 19, 17.13%). In our view, the low sample variation is unlikely to affect the result for the emotional network measures as the effects are robust to several control covariates. Nevertheless, future studies looking to explore more nuanced questions will wish to obtain more distributed samples.
Consistent with theoretical work by Thagard, we find that the emotional dependence (coherence) of a CAM is positively correlated with attitude strength but not direction. We also find that CAM valence is a significant predictor of attitudes toward the tax. Furthermore, we find that CAM valence explains a significant proportion of attitudinal variation and remains a significant predictor after controlling for ideological orientation, party identification, and demographic factors.
While we find no direct relationship between CAMs’ structural properties and attitudes toward the carbon tax, we find several meaningful relationships between these properties and measures of political interest, issues familiarity, and issue sophistication. Of significance, we find that the interaction between political interest and the reverse-coded issue familiarity is negative and significantly correlated with both network density and degree centrality. This indicates that as people become more interested in politics and more familiar with the carbon tax, the interconnectedness of their CAM decreases.
Similarly, on the measure of issue sophistication, we find a negative correlation with eigenvector centrality and positive correlations with the number of nodes, edges, and assortativity. These relationships suggest that as issue sophistication increases, CAMs become more interconnected and less globally dependent on single ideas, thoughts, or concepts. Less clear-cut, we find that the interaction between issue sophistication and familiarity results in the opposite trend. Here, we observe a positive correlation with eigenvector centrality and negative correlations with assortativity and triadic closure, both of which measure CAM interconnectedness. One explanation for this observed effect is that individuals high on both measures may be more likely to connect heterogenous concepts to a single globally important node. This assertion is partially collaborated by the finding that CAMs with central nodes that reference the carbon tax had high mean eigenvector centrality scores.
We find clear and consistent evidence that as unfamiliarity with the carbon tax increases network connectedness decreases and network centralization increases. In other words, individuals less familiar with the carbon tax are more likely to rely on a single or small number of concepts when reflecting on their thoughts and feelings about the carbon tax. This result may be significant to research using online or receive-accept-sample models, which argue that ideological thinking among nonsophisticates tends to be less directed or consistent than their sophisticated counterparts (Druckman & Lupia, Reference Druckman and Lupia2000; Zaller, Reference Zaller1992).
Finally, as the first study to empirically investigate the utility of CAM for the study of political attitudes, we did not test any formal hypothesis but structured the analyses around a series of nine exploratory questions. However, using these preliminary results, future studies are well placed to engage in hypothesis testing about the relationships between CAM emotional coherence and valence and individual attitudes. Studies are also well positioned to further explore the links between structural network properties and various measures of political engagement.
Conclusion
Overall, we believe the results of this study are significant to future research on attitudes. Compared with structured survey measures, we see utility in the openness and flexibility offered by the CAM method for comparative research on ideological content and structure. Furthermore, as demonstrated by these early results, we believe that the quantifiable characteristics of CAMs will also be beneficial for research on political engagement. In particular, we see potential explanatory power in network properties such as centrality, density, and clustering for topics such as democratic participation, voter turnout, self-interest, issue preference, and comparative studies on public opinion. Consequently, by demonstrating the efficacy of the CAM method, we believe this study makes a modest yet important contribution to future research in political science.
Acknowledgments
The authors acknowledge financial support from the Association for Politics and the Life Sciences and Ideological Conflict Project at the Balsillie School of International Affairs.
Supplementary Materials
To view supplementary material for this article, please visit http://dx.doi.org/10.1017/pls.2021.16.