


1. Introduction
The sea-ice zone is one of the most responsive components of the cryosphere with respect to global climate change. Given the projected amplification of a global temperature rise in the polar regions, the extent and thickness of the sea-ice cover in the Arctic and Antarctic may become major yardsticks in monitoring environmental change (Reference Mitchell, Manabe, Meleshko, Tokioka., Houghton, Jenkins. and EphraumsMitchell and others, 1990). Through the ice-albedo feed-back and owing to its importance for ocean–atmosphere interaction, sea ice not only records but also drives climate variability. While it is well established that ice extent and ice-thickness distribution are key variables in this context, the role of snow in determining the growth and decay of a sea-ice cover has received much less attention.
In the Antarctic, where snow depths on sea ice may attain a third or a half of the ice thickness and where accumulation rates are highly variable m time and space, one would expect pronounced snow-cover effects. In this study we assess how and to what degree a snow cover affects seasonal and inter-annual variability in thickness, extent and properties of sea ice. First, data on the distribution of snow on sea ice in the Weddell Sea are presented and important processes in the interaction between snow and ice are identified. Based on these results, thermodynamic growth of an ice cover with different snow-accumulation rates is studied with the aid of a one-dimensional sea-ice model developed from the work of Reference Maykut and Untersteiner.Maykut and Untersteiner (1971) and Reference Cox and Weeks.Cox and Weeks (1988). Finally, the large-scale pack-ice behaviour under the influence of varying snow-accumulation rates is assessed for the Weddell Sea with a dynamic–thermodynamic mixed-layer sea-ice model (Reference Fischer., Lemke., Johannessen, Muench and Overland.Fischer and Lemke, 1994). In a synthesis of these three lines of investigation, the quantitative impact of snow on the evolution of ice thickness, extent and properties will be deduced and its importance in modulating the response of sea ice to global climatic change will be evaluated.
2. Deducing Snow-Cover Effects From Field Measurements and Ice-Core Studies
The distribution of snow on sea ice and its contribution to the total ice mass in the Weddell Sea have been derived from measurements and ice-core analysis carried out during a number of field studies on board the ice-breaker Polarstern. Here, data collected during the winter Weddell Gyre study (WWGS), traversing the entire Weddell Gyre in 1989 and 1992 (Fig. 1; for details on expeditious and sampling techniques, see Reference Eicken, Lange., Hubberten and Wadhams.Eicken and others, 1994), and the European Polarstern study (EPOS) in 1988 are presented. Table 1 shows mean values of snow depth z s, ice thickness z i and freeboard z fb determined through thickness drilling along profiles of 50–100 m length (1 or 2 m spacing) with over 5000 individual measurements. The results show that snow depth mostly amounts to roughly one-quarter of the ice thickness, with an extreme value of close to one-half for second-year ice sampled during WWGS 89.
Polarstern cruise tracks during WWGS in 1989 and 1992 and EPOS in 1988. The shaded box marks the approximate location of the boundary between predominantly second-year ice in the west and first-year ice in the east as determined during the WWGS cruises.

Mean values of snow depth zs, ice thickness zi and freeboard zfb for first- and second-year ice in the Weddell Sea

The ice surviving summer in the perennially ice-covered western branch of the Weddell Gyre (Fig. 1) and entering its second year of growth is characterized by a disproportionate increase in snow depth over ice thickness as compared to first-year ice. Apart from snow accumulating during summer, this is a result of the thermal insulation a snow cover provides. Since its thermal conductivity is an order of magnitude less than that of sea ice (for an average snow density of 290 kg m−3 measured during WWGS 89, its thermal conductivity amounts to roughly 0.2 W m−1 K−1 according to standard models, as compared to values at or above 2 W m−1 K−1 for sea ice), conductive heat flux and hence ice-growth rate are greatly reduced below a snow blanket. This is also seen in individual thickness-drilling profiles through level ice, where snow depth displays a strong negative correlation with ice thickness (Reference Eicken, Lange., Hubberten and Wadhams.Eicken and others, 1994).
Trapping of snow within pressure-ridge zones may increase snow depth by a factor of two to five over mean values in adjacent level areas. Areas where the snow cover exceeds a critical threshold or where deformation processes locally offset the isostatic balance such that the floe surface is depressed below sea level, are prone to flooding. Provided that hydraulic pathways such as cracks or extended vertical channels exist, sea water and brine seep into the snow cover and may eventually congeal into snow ice, consisting of a marine (mostly sea-water) and a meteoric (snow) component. Field measurements show that negative freeboard as a prerequisite to snow-ice formation is exceedingly common in the Weddell Sea, with z fb < 0 for 15%, 40% and 8% of all EPOS, WWGS 89 and WWGS 92 measurements, respectively. Similar observations have been made in other sectors of the Antarctic, such as the Bellingshausen and Amundsen Seas (Reference Jeffries, Shaw., Morris, Veazey and Krouse.Jeffries and others, 1994).
The fraction of meteoric ice hidden in the solid ice cover can be retrieved from stable-isotope measurements of sea-ice cores (Reference Lange, Schlosser, Ackley., Wadhams and Dieckmann.Lange and others, 1990; Reference Eicken, Lange., Hubberten and Wadhams.Eicken and others, 1994). The fraction of the heavy isotope 18O in sea water greatly exceeds that in snow, since the light isotope is enriched in precipitation during evolution of the source vapour. Hence, the fraction of snow (i.e. meteoric ice) in a given sea-ice sample can be derived from the mass-continuity equations for salt and 18O (for details, see Reference Eicken, Lange., Hubberten and Wadhams.Eicken and others, 1994). The contribution of meteoric ice to the total mass of ice and snow in the Weddell Sea deduced from WWGS 89 cores is shown in Table 2. Note in particular that the meteoric-ice fraction as well as the snow fraction is significantly larger for second-year than for first-year ice (this difference would increase when accounting for brine drainage from second-year ice, which results in an underestimate of the meteoric-ice fraction). Comparison with data from the winter Weddell Sea project 1986 indicates that the distribution of snow and meteoric ice varies both regionally and inter-annually (Reference Eicken, Lange., Hubberten and Wadhams.Eicken and others, 1994). This is in part explained by variable accumulation rates, but model results presented below indicate that the timing of the ice-edge advance during autumn and winter also plays an important role, since snow accumulation only has an effect once a platform for deposition has been established. Given the complexity of the ocean–ice–atmosphere system and the comparatively small snow and sea-ice data base, the effects of changes in the boundary conditions driving growth and decay of ice are best assessed through numerical simulation, as attempted in the following sections.
Fraction of snow fs and meteoric ice fm of the total thickness zt of snow and ice in the Weddell Sea (WWGS 89, n = 21)

3. Results From A One-Dimensional Thermodynamic Ice-Growth/Salinity Model
Thermodynamic growth of an ice cover subjected to variable snow-accumulation rates and allowing for snow-ice formation has been numerically simulated, based on the one-dimensional model formulated by Maykut and Untersteiner (1971; abbreviated as M & U). Despite ice thicknesses in the range of 0.5–1.5 m which would still justify the assumption of linear temperature profiles in the ice, the M & U model, which allows for non-linear profiles by solution of the heat-conduction equation, is preferred in order to correctly capture thermal evolution of the ice under deeper snow cover and during snow-ice formation.
In short (for a detailed description see M & U; refer to Reference Eicken.Eicken (1992) for modifications made with respect to Weddell Sea climate), the surface temperature is derived in the model from the surface-energy balance given by

with surface albedo α, incoming long-wave and short-wave fluxes F l and F r (of which I 0 enter the deeper ice layers; see M & U for details), outgoing long-wave flux F↑, sensible and latent heat fluxes F s and F e, conductive flux F c, and heat loss due to melting of snow and ice F m . Heat conduction for a temperature distribution T with depth z is described by

with thermal conductivity k, density ρ and specific heat c (here and below, the subscripts i and s denote variables referring to the ice and snow columns, respectively). The absorption of short-wave solar energy in the ice is also accounted for with an absorption coefficient κ i . Thermal conduction in the snow is described in analogue, ignoring short-wave absorption due to the strong attenuation in the upper snow layers. Snow thermal conductivity is taken as 0.23 W m−1 Κ−1 for a density of 290 kg m−3 according to the model of Reference AndersonAnderson (1976). At the ice bottom (i.e. at depth h s + h i) heat conduction is balanced against oceanic heat flux F w and release of latent heat of freezing L:

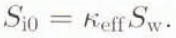
In situ temperature T i and salinity S i control the volume of liquid brine within the ice, which in turn strongly influences thermal conductivity k i and specific heat capacity c i , In our modified M & U model, these terms are prognostic variables depending on S i and T i as formulated by Reference Ono.Ono (1975) and M & U. The salinity evolution of the ice is derived from a semi-empirical simulation scheme by (Reference Cox and Weeks.Cox and Weeks 1988; abbreviated as C & W). In C & W the initial salinity of a newly grown ice layer S 10 is determined by a growth-rate-dependent effective-distribution coefficient k eff and the sea-water salinity S w:
Desalination of ice layers is accounted for as brine expulsion due to differential decrease in ice-brine volume V b with cooling from T 1 to T 2:

where S is salinity, and ρ density of brine (subscript b) and ice. For V b, ≥ 50‰, gravity drainage reduces ice salinity by replacement of cold, saline brine with salt solution of lesser density:

Details of the salinity model can be found in C & W and Reference Eicken.Eicken (1992). To assess the evolution of snow-ice layers a simple flooding scheme has been incorporated into the model. The density ρ(T, S) of the ice cover is computed from C & W and ice freeboard determined according to

with z as thickness of ice and snow cover, and ρ as density of ice, snow and sea water (subscript w).
When flooding the snow cover up to a height of –z fb for z fb, < 0, the boundary conditions of the model are modified such that (1) the temperature of the infiltrating water and the snow matrix is set to the freezing point of sea water, (2) the density of the infiltrated snow laver is increased by a factor of 1.5 due to settling of the snow-grains (in accordance with field observations on wet and flooded snow), (3) the thickness of the overlying snow column is reduced correspondingly, and (4) until complete freezing of the flooded layer, which thermally decouples the ice bottom from the surface, no net accretion/ablation is allowed at the ice bottom. While natural conditions are not fully represented in such a simplified scheme, the results presented below demonstrate that the conclusions about the importance of snow-ice formation are nevertheless valid. The model has been programmed on a microcomputer; the heat conduction equations have been solved with an explicit finite-difference scheme for layer thicknesses of 0.01 m (snow) and 0.02 m (ice).
Computation of the salinity evolution is nested between time steps of 290 s for heat conduction. The model is driven by climatological data from the central and eastern Weddell Sea (see Reference Eicken.Eicken (1992) for details). Apart from model validation carried out by C & W and Reference Eicken.Eicken (1992), simulated thicknesses have been compared with data and model results from Neumayer Station in the Antarctic (Reference Kipfstuhl.Kipfstuhl, 1991).
Results from standard model runs for different accumulation rates, not accounting for snow-ice formation, are shown in Figure 2. In accordance with the ice-edge advance in the Weddell Sea (as seen in the satellite data of Reference Gloersen, Campbell., Cavalieri, Comiso., Parkinson and Zwally.Gloersen and others (1992) and in Figure 5 below for the large-scale model) ice growth is initiated on 1 May (Julian day 121). Shortly after melting sets in, simulations are terminated because, at present, salt fluxes in melting ice are inadequately represented. The oceanic heat flux F w is set to 4 W m−2 to match results of the large-scale model (see below). Accumulation rates are given as water equivalent such that they have to be divided by the snow-density to yield snow-accumulation raies. In the model, snow depth increases linearly with every time step. Based on accumulation data from overwintering stations and glacial-ice cores from the Weddell Sea region, the best estimate for accumulation rates ranges between 0.2 and 0.35 m a−1 (Reference Eicken, Lange., Hubberten and Wadhams.Eicken and others, 1994). Snow depths measured on sea ice point towards a best estimate of 0.2 m a−1 (i.e. snow depth of 0.34 m on Julian day 300 in Figure 2). Field data as listed in Table 1 range below this number, mostly because (1) field measurements were carried out before day 300 and include ice formed after day 121, (2) snow is removed by wind action, and (3) snow-ice formation decreases snow depth (Reference Eicken, Lange., Hubberten and Wadhams.Eicken and others, 1994).
Evolution of ice thickness zi from simulations with varying accumulation rates (w.e.), without snow-ice formation. Starting date of ice formation 1 May; oceanic heat flux Fw = 4 W m−2. Note how maximum ice thickness is attained earlier for increasing accumulation rates. The lower set of curves shows time series of freeboard zfb relative to sea level, with negative freeboard for accumulation rates 0.35 and 0.5 m a−1, potentially inducing flooding and snow-ice formation during the latter half of the growth season.

Time series of total sea-ice volume in the Weddell Sea for different accumulation rates (w.e.) as computed with the large-scale sea-ice model.

The results shown in Figure 2 and all Other runs with different boundary conditions (date of ice formation 15 March–1 August; 0 ≤ F w 20 ≤ W m−2) indicate that the net effect of increasing snow-accumulation rates dz s/dt on sea ice is a pronounced decrease in maximum thickness z i,max attained through thermodynamic growth. Furthermore, the higher dz s/dt, the earlier z i,max is attained and melting sets in (Fig. 2; Table 3). As compared to the zero-accumulation run (z i,max = 1.59 m on day 290), z i,max is reduced by a factor of 0.6 (z i,max = 0.98 m on day 278) and 0.4 (z i,max = 0.65 m on day 251) for accumulation values of 0.2 and 0.5 m a−1, respectively. In the simulations, snow also enhances the sensitivity of the ice cover to oceanic heat flux F w. As compared to an accumulation of 0.2 m a−1 with F w =4 W m−2, an increase in F w to 10 W m−2 results in a decrease of z i,max by a factor of 0.8. Attainment of z i,max sets in 38 d earlier.
Maximum annual thickness zi,max or volume Vi,max of sea ice and day of attainment dmax for different accumulation rates (w.e.) from one-dimensional thermodynamic and large-scale sea-ice models

Accumulation of snow on the ice surface affects not only the thickness of the ice cover but also its properties, namely salinity and brine volume. The upper layers in bare sea ice cool down to values approaching the air temperature; consequently brine volumes are comparatively low (Fig. 3). Thermal insulation by a snow cover causes ice temperatures to increase which in turn results in brine volumes exceeding 80‰ in the upper layers for accumulation rates above 0.35 m a−1 (Fig. 3). By damping ice-growth rates, a snow cover also diminishes initial salinities of newly accreted layers, yet, as Figure 3 demonstrates, this cannot compensate for the temperature effect (see also Reference Eicken.Eicken, 1992). With increasing snow-accumulation rates, ice strength, which scales with ice thickness and inversely with brine volume (Reference Mellor. and UntersteinerMellor, 1986), is greatly reduced. As discussed below, such a “softening” effect has significant implications for the large-scale behaviour of the ice pack.
Profiles of fractional brine volume for simulations shown in Figure 2 on Julian day 250, i.e. close to attainment of maximum ice thickness (for legend, see Fig. 2). Note the increase in brine volume for increasing snow-accumulation rates due to higher temperatures in the upper ice layers.

The potential for flooding of the ice surface and the formation of snow ice is expressed in the time-series plot of freeboard z fb in Figure 2. On day 300, z fb = 0.17, 0.00, −0.09 and −0.17 m for accumulation rates of 0, 0.2, 0.35 and 0.5 m a−1, respectively. Thus, for the boundary conditions of the simulation, no snow ice forms for accumulation rates ≤ 0.2 m a−1, and no substantial negative freeboard is reached for higher values of dz s/dt before day 250. A further prerequisite for flooding to occur is the presence of a hydraulic pathway (e.g. cracks) between the ocean and the depressed ice surface. Flooding over wider areas of level ice is achieved only if the ice cover is sufficiently permeable to allow sea water to enter from below. Laboratory studies (see C & W) and field experiments (unpublished information from Eicken and Haas, 1992) indicate that sea ice is effectively impermeable for brine volumes below 50–70‰. Hence, a low-porosity layer within an ice floe may prevent flooding despite negative freeboard. An indication that this permeability criterion may be of importance and requires further attention is given in Figure 4, which shows that the critical threshold of 50‰ is surpassed after day 230–250 for the most realistic accumulation raies, Generally, it appears that mid-winter ice temperatures are too low, even with higher snow loads, to allow flooding (excluding thin new ice). This is corroborated by field observations from WWGS 89 and 92 where surface flooding before day 250–270 was much less common, despite wide occurrence of negative freeboard, than during EPOS after day 290. The evidence that ice permeability is indeed a limiting factor in snow-ice formation implies that the complexity of an ice cover’s response to different snow-accumulation rates is greater than suggested by a simple flooding criterion as derived in Equation (7).
Time series of minimum brine volume Vb,min in ice-growth simulations shown in Figure 2 (for legend, see Fig. 2). Note how critical permeability threshold of Vb,min > 50–70‰ is surpassed only during the later part of the growth season.

The evolution of the freeboard layer determines the sustainable growth of snow ice (Fig. 2; bottom). For an accumulation rate of 0.5 m a−1, for example, z fb amounts to −0.10 m, i.e. 15% of z i,max on day 250. Results from the ice-growth/salinity model indicate, however, that snow-ice congelation is limited to smaller amounts due to energetic constraints. The dividing line between complete and incomplete congelation of a flooded snow layer is evident from the data shown in Table 4. For accumulation rates ≥ 0.5 m a−1, only part of the flooded freeboard layer congeals, if flooding takes place after day 230. Flooding after day 250 results in incomplete congelation for all simulated accumulation rates. Only for ice growth starting very early in the season or for high oceanic heat fluxes is the ice surface depressed farther below sea level with z fb ranging between −0.1 and −0.3 m (see Table 4). While a detailed assessment of snow-ice formation requires additional data on the prerequisites and the salt flux associated with flooding and snow-ice formation, it appears that the amount of snow ice formed due to flooding under a snow load cannot nearly compensate the decrease in ice thickness due to enhanced thermal insulation (Fig. 2; Tables 3 and 4). At best, snow-ice formation counterbalances decreases in z i,max for 0.1 m a−1 accumulation-rate increments.
Freeboard zfb, before flooding and thickness of congealed snow ice zsi for different accumulation rates (w.e.) and dates of ice formation di,s and start of snow-ice congelation dsi,s

The role of snow in modulating the response of sea ice to climate change extends through to the period of summer melt. To date, ablation processes in Antarctic sea ice are not well enough understood to extend the one-dimensional model far into the melt season. Field data indicate that the situation is different from the Arctic Ocean, where the entire snow cover melts away at the surface of multi-year ice. Nevertheless, an important result of the work of Reference Maykut and Untersteiner.Maykut and Untersteiner (1971) also applies to the Southern Ocean. They found that an increase in accumulation on multi-year ice beyond approximately 0.6 m a−1 of snow induced an increase in equilibrium ice thickness (i.e. steady state achieved for a balance between surface summer melt and bottom freezing in winter). Thus, a thick snow cover persisting year-round protects the underlying ice from downward-directed heat fluxes and increases its chance of surviving summer melt. Even though Antarctic climate differs from that of the Arctic, there is evidence that such “snow shielding” occurs in some perennially ice-covered areas, such as the western Weddell Sea (Table 1), today. In the Bellingshausen and Amundsen Seas, where accumulation rates exceed those of the Weddell region by more than a factor of two (Reference Eicken, Lange., Hubberten and Wadhams.Eicken and others, 1994, Reference Jeffries, Shaw., Morris, Veazey and Krouse.Jeffries and others, 1994), snow may also prevent complete melting of the ice cover during summer.
4. Results From A Large-Scale Sea-Ice Model
The large-scale dynamic–thermodynamic sea-ice model, based on work by Reference HiblerHibler (1979), is coupled to a one-dimensional oceanic mixed-layer model which determines the oceanic heat flux prognostically (Reference Lemke, Owens and Hibler.Lemke and others, 1990). Similar to Reference Owens and LemkeOwens and Lemke (1990), a snow layer is included in the model. Through continuity equations, ice thickness, ice compactness and snow depth are prognostically calculated variables, composed of thermo-dynamic and dynamic terms. From the momentum equation, an ice velocity is determined, allowing for spatial and temporal variability of ice thickness, ice compactness and snow depth through advection and diffusion. Additionally, internal ice stresses are considered, based on a viscous-plastic ice rheology (Hibler, 1979).
The heat-budget calculations are based on formulations of Reference Parkinson and Washington.Parkinson and Washington (1979). A linear temperature profile is assumed in the snow and ice layers according to Reference SemtnerSemtner (1976). A scheme for snow/ice conversion, which considers flooding of ice floes due to snow loading (Reference LeppäramaLeppäranta, 1983), is added to the thermodynamic part of the model. The large-scale model domain represents the South Atlantic region from 60° W to 60° E and from 80° to 47.5° S. A polar stereographic grid is used with a spatial resolution of 2.5° × 2.5°. The model is integrated in daily time steps to obtain updates of sea-ice conditions. After 6 years of integration with the 1986 atmospheric forcing, the model reached an equilibrium seasonal cycle with respect to ice volume. Using the ice conditions of the last day in 1986, a transient run for 1987 is started and used in these analyses. The daily forcing data originate from the European Centre for Medium Range Weather Forecasts (ECMWF) and include the wind components, air temperature, relative humidity and air pressure for 1986 and 1987. The forcing terms are the same as those used by Reference Fischer., Lemke., Johannessen, Muench and Overland.Fischer and Lemke (1994).
Model results of ice volume for a complete annual cycle are shown in Figure 5 for different accumulation rates. Maximum ice volumes are in all cases attained around Julian day 282 (9 October). Compared to the one-dimensional model (Fig. 2; Table 3), ice volume does not decrease as drastically with increasing accumulation rates, and is reduced at most by 21% when comparing 0 and 0.35 m a−1 accumulation scenarios. This reduction of the insulation effect is due to the fact that new ice growth along the advancing ice edge contributes significantly to the rise in ice volume during the growth season. On young ice, snow-cover effects do not play as important a role as in a one-dimensional scenario, where only one ice-thickness class is monitored. Analysis of model runs furthermore indicates that neither oceanic heat flux nor the amount of ice deformation are significantly affected by varying accumulation rates.
For accumulation rates of 0.35 and 0.5 m a−1 differences in ice volume are negligible, while accumulation rates > 0.5 m a−1 induce an increase in ice volume due to the growing contribution of snow ice. This is demonstrated in Figure 6, with negligible snow-ice formation for rates ≤ 0.2 m a−1 and a distinct increase for values ≥ 0.5 m a−1. In the latter case, meteoric ice accounts for more than 10% of the total ice volume, an estimate which may have to be revised when taking into account the thermodynamic constraints and the prerequisites for flooding discussed above. Besides the correspondence with respect to a critical accumulation threshold slightly below 0.35 m a−1, the temporal evolution of meteoric-ice formation rates compares well with the results from the one-dimensional model. Both indicate that the period between Julian days 220 and 280, i.e. the latter part of the ice-growth season, is critical for flooding and congelation which is partly explained by the freeboard evolution (Fig. 2). The large-scale model is furthermore able to reproduce the regional distribution pattern of snow and meteoric ice with a distinct maximum in the western Weddell Sea with prevailing second-year ice. In contrast with the ice-volume curves shown in Figure 5, the ice extent does not vary notably between simulations, i.e. with accumulation rates ranging between 0.0 and 0.65 m a−1.
Formation rates of meteoric ice from computations with the large-scale sea-ice model. Note how formation rates increase towards the end of the ice-growth season.

5. Discussion and Conclusions
In discussing the effects of snow on the Antarctic sea-ice cover, a distinction has to be made between local, “point” effects and the response of the entire Weddell Sea pack. The former have been studied in field measurements and a one-dimensional sea-ice growth model, indicating that increasing snow accumulation result in a net thinning of the ice cover due to enhanced thermal insulation from the atmosphere. The reduction in short-wave fluxes due to higher surface albedo does not come into play, with fluxes being low during most of the ice-growth season. Rising ice temperatures that accompany increases in snow depth have important consequences for ice properties. Simulations of the salt and temperature distribution within the ice indicate that fractional brine volumes rise drastically as accumulation rates increase from 0 to 0.5 m a−1 or more. In combination with the decrease in ice thickness, this implies that regions of high snow accumulation develop an ice cover of significantly reduced strength. It still needs to be established, however, how such decrease in macroscopic ice strength affects large-scale ice deformation. Given the prevalence of dynamic ice-growth processes in the Antarctic, enhanced dynamic thickening may well counterbalance some of the thermo-dynamically induced thinning.
As brought out by the field data and confirmed by both models, snow contributes directly to sea-ice mass through congelation of snow ice. The one-dimensional model demonstrates, however, that flooding and snow-ice formation are critically affected by several intertwining processes. Among other factors, the timing of snow accumulation, the permeability of the underlying ice and the heat flux sustained at the surface combine to induce a highly non-linear response of the ice cover to changes in boundary conditions. This is confirmed by comparing meteoric-ice and freeboard data collected in different years from different sectors of the Weddell Sea (Reference Eicken, Lange., Hubberten and Wadhams.Eicken and others, 1994). Both models indicate that snow-ice formation may buffer some of the reduction in ice thickness with increasing accumulation rates; it does not suffice however, to increase ice volumes to values achieved for ice with thin or no snow cover.
How does the snow cover modulate the response of Antarctic sea ice to climate change, such as a projected atmospheric warming due to anthropogenic greenhouse gas emissions? While it is not quite clear how accumulation rates in the Antarctic sea-ice zone will respond to a doubling of carbon-dioxide atmospheric concentrations (Reference Mitchell, Manabe, Meleshko, Tokioka., Houghton, Jenkins. and EphraumsMitchell and others, 1990), GCM simulations by Reference Budd, Simmonds., Weller, Wilson and SeverinBudd and Simmonds (1991) derived an increase in net accumulation (precipitation minus evaporation) ranging between 10% and 40%. According to the large-scale sea-ice model, such changes would diminish ice volume only by smaller amounts with no alteration in ice extent. Precipitation and accumulation of snow are far from being spatially and temporally homogeneous processes as assumed in the model, however, and hence local effects can be much more pronounced. An increase in accumulation early in the season or near the advancing ice-edge zone would decrease ice-growth rates and result in enhanced snow-ice formation due to snow loading on comparatively thin ice (Fig. 2; Table 4; see also Reference Eicken, Lange., Hubberten and Wadhams.Eicken and others, 1994).
More importantly, the decrease in conductive heat flux F c under a thicker snow cover enhances the sensitivity of thermodynamic ice growth to oceanic heat flux F w as discussed above (see Equation (3)). At present the thickness of the Weddell Sea ice cover is closely cheeked by the balance between F c and F w (Reference Gordon and Huber.Gordon and Huber, 1990), which may imply that events driven by changes of (F c – F w), such as a Weddell polynya, are likely to occur more frequently for increasing snow accumulation in the area.
While the snow cover enhances “bottom” sensitivity of sea ice, “top” sensitivity is decreased at the same time. First, snow acts as a buffer during the melting season, since the albedo does not decrease as drastically while meltwater may percolate downward within the snow column. As long as the ice surface remains unexposed and no melt puddles form, surface ablation progresses comparatively slowly. The perennial persistence of sea ice in regions of thicker snow cover, such as the western Weddell and the Bellingshausen Sea (Reference Eicken, Lange., Hubberten and Wadhams.Eicken and others, 1994; Reference Jeffries, Shaw., Morris, Veazey and Krouse.Jeffries and others, 1994) may be due to this “snow-shielding” effect. In the Arctic, where oceanic heat fluxes are smaller, an increase in annual accumulation beyond 1.2 m a−1 of snow indures an increase of equilibrium ice thickness to values exceeding 6 m (Maykut and Untersteiner, 1971). Clearly, these processes require further study, in particular since they may also buffer increasing summer air temperatures due to atmospheric warming.
A second important process in this context is snow-ice formation after flooding of the ice surface. The models employed in this study indicate that the process of snow-ice formation itself is correctly captured, yet that more detailed studies of the prerequisites and boundary conditions of flooding and congelation of snow ice are required. Models and field data indicate that, at present, meteoric ice represents a comparatively small, though significant, term in the sea-ice mass balance. For larger accumulation rates this contribution is likely to increase (Figs 5 and 6). With a best estimate of present-day accumulation rates between 0.2 and 0.35 m a−1, the Antarctic regime may well be on the brink of enhanced snow-ice formation. Field results demonstrate that in exceptional locations or years, snow (in the form of meteoric ice) contributes more than 25% to the total mass of sea ice even now (Reference Eicken, Lange., Hubberten and Wadhams.Eicken and others, 1994). The consequences are far from evident at present, yet they are potentially of great importance for an assessment of sea-ice response to enhanced accumulation rates. Thus, it could be argued that in regions where circulation patterns allow multi-year ice to develop, such a perennial ice cover would be stabilised through snow accumulation (even for rates > 1 m a−1 w.e.). Snow-ice formation takes place in the freeboard layer, where maximum conductive heat fluxes are sustained and congelation is decoupled from the ocean by the underlying ice. As long as the ice surface is not exposed during summer melting, a stationary state comparable to Arctic multi-year cycling (Maykut and Untersteiner, 1971), yet mostly or entirely driven by snow-ice congelation, could be attained.
Issues requiring further attention are indicated by the shortcomings of this study. First, the snow cover is represented in a simplistic fashion in the simulations. While this suffices for an assessment of general patterns in snow–ice interaction, further studies would probably require a more sophisticated snow model, such as the one developed by Reference Loth, Graf and Oberhuber.Loth and others (1993). Similarly, snow-ice formation in the large-scale model may have to be revised to take into account energetic constraints (i.e. strict conservation of both mass and energy) for the congelation of a flooded snow layer. Most important of all, the “snow-shielding effect” needs to be studied in more detail both in the field and through numerical modelling, as it may be the most important mechanism in modulating the response of an ice cover to enhanced atmospheric warming during the melting season.



