


1. INTRODUCTION
Plasma jets containing high energy ions are a ubiquitous feature of laser-target interaction. In the interaction of 250 ps long laser pulses with solid copper targets, the ablation of the material readily gives rise to plasma jets due to hydrodynamic expansion of the laser-heated material, as seen by Kasperczuk et al. (Reference Kasperczuk, Pisarczyk, Nicolai, Stenz, Tikhonchuk, Kalal, Ullschmied, Krousky, Masek, Pfeifer, Rohlena, Skala, Klir, Kravarik, Kubes and Pisarczyk2009a, Reference Kasperczuk, Pisarczyk, Demchenko, Gus'kov, Yu., Kalal, Ullschmied, Krousky, Masek, Pfeifer, Rohlena, Skala and Pisarczyk2009b, Reference Kasperczuk, Pisarczyk, Badziak, Borodziuk, Chodukowski, Parys, Ullschmied, Krousky, Masek, Pfeifer, Rohlena, Skala and Pisarczyk2010), and with even longer (14 ns) pulses and a teflon target (Schaumann et al., Reference Schaumann, Schollmeier, Rodriguez-Prieto, Blazevic, Brambrink, Geissel, Korostiy, Pirzadeh, Roth, Rosmej, Faenov, Pikuz, Tsigutkin, Maron, Tahir and Hoffmann2005).
Laser technology now makes it possible to generate extremely short (femtosecond) and intense (>1022 W/cm2) laser pulses (Mourou et al., Reference Mourou, Tajima and Bulanov2006; Borghesi et al., Reference Borghesi, Kar, Romagnani, Toncian, Antici, Audebert, Brambrink, Ceccherini, Cecchetti, Fuchs, Galimberti, Gizzi, Grismayer, Lyseikina, Jung, Macchi, Mora, Osterholtz, Schiavi and Willi2007). In particular, considerable attention has been given in recent years to the problem of thin foil targets irradiated by high intensity laser pulses. Under these conditions, a solid foil target transforms very rapidly, in a few cycles of the light wave, into plasma. During the short duration of the laser pulse, the laser beam interacts directly with plasma with density on the order of the density of the solid. If the intensity of the wave is sufficiently high to make the oscillation of the electrons relativistic, interesting interactions between the wave and the surface of the plasma take place (see references in Robinson et al., Reference Robinson, Gibbon, Zepf, Kar, Evans and Bellei2009, Reference Robinson, Zepf, Kar, Evans and Bellei2008; Liseykina et al., Reference Liseykina, Borghesi, Macchi and Tuveri2008; Klimo et al., Reference Klimo, Psikal, Limpouch and Tikhonchuk2008; Kar et al., Reference Kar, Borghesi, Bulanov, Key, Lyseikina, Macchi, Mackinnon, Patel, Romagnani, Schiavi and O. Willi2008; Schlegel et al., Reference Schlegel, Naumova, Tikhonchuk, Labaune, Sokolov and Mourou2009). The interaction of such pulses with matter introduces new phenomena that have shown promising applications in a variety of areas in physics, medicine, and more recently in ion-driven fast ignition (Fernandez et al., Reference Fernandez, Honrubia, Albright, Flippo, Gautier, Hegelich, Schmitt, Temporal and Yin2009).
In this paper, we present numerical simulations to study the case of a one-demensional (1D) model where a circularly polarized laser beam is normally incident on the surface of a target (oblique incidence and two-dimensional effects as recently reported for instance in Yang et al., Reference Yang, Ma, Shao, Xu, Yu, Gu, Yu, Yin, Tian and Kawata2010 and Liu et al., Reference Liu, Zhang, Fu, Gu, Zhang, Liu, Xie, Liu and He2010, are beyond the scope of the present work). We consider the case when the free space wavelength of the wave λ0 is much greater than the scale length of the ramp in the plasma density at the target plasma edge L edge (λ0 ≫ L edge), and the plasma density is such that n/n cr ≫ 1, where the critical density n cr = 1.1 × 10²¹ λ0−2 cm−3 (λ0 is the laser wavelength expressed in microns). In the case of circular polarization of the laser wave, there is a constant radiation pressure maintained at the plasma surface by the incident laser wave (Shoucri et al., Reference Shoucri, Afeyan and Charbonneau-Lefort2008; Shoucri & Afeyan, Reference Shoucri and Afeyan2010). In this case, the incident high intensity laser radiation pushes the electrons at the plasma surface through the ponderomotive pressure, producing a sharp density gradient at the target plasma surface. There is a build-up of the electron density at this surface that creates a large space-charge, giving rise to a strong longitudinal electric field. The presence of this electric field at the wave-front plasma-edge interface (which will be denoted by WFPEI in the remaining of the paper) produces a rapid build up of the ion density at the edge and an important acceleration of the ions in the forward direction. There is a ponderomotive steepening of the density profiles at the edge, with the formation of a double layer-like structure supported by the radiation pressure. It has been suggested by Albright et al. (Reference Albright, Yin, Boers, Hegelich, Flippo, Kwan and Fernandez2007) that the acceleration in the initial phase could possibly be associated with Buneman instability (Buneman, Reference Buneman1959). A beam-plasma instability was mentioned as another possibility by Mendonça et al. (Reference Mendonça, Norreys, Bingham and Davies2005a, Reference Mendonça, Norreys, Bingham and Davies2005b). This result is in agreement with recent simulations, which show that the ion acceleration process during the interaction of an intense circularly polarized wave with a target takes place on the front side of the target (Macchi et al., Reference Macchi, Cattani, Liseykina and Cornolti2005; Klimo et al., Reference Klimo, Psikal, Limpouch and Tikhonchuk2008; Robinson et al., Reference Robinson, Zepf, Kar, Evans and Bellei2008; Schlegel et al., Reference Schlegel, Naumova, Tikhonchuk, Labaune, Sokolov and Mourou2009). In the acceleration process, the accelerated ions at the edge (accelerated in the forward direction) reach a free-streaming expansion phase and are transported through the plasma of the target, and the electrons neutralize the charge of these expanding ions. This produces neutral plasma ejected in the forward direction. This compact bunch of quasineutral plasma expands in the forward direction (Shoucri et al., Reference Shoucri, Afeyan and Charbonneau-Lefort2008, 2010; Shoucri & Afeyan, Reference Shoucri and Afeyan2010). The propagation of this plasma jet in the forward direction is associated with the formation of shock-like structures, which agrees with the observation of steep density gradients at the periphery of the plasma jet recently reported by Kar et al. (Reference Kar, Borghesi, Bulanov, Key, Lyseikina, Macchi, Mackinnon, Patel, Romagnani, Schiavi and O. Willi2008) for instance.
In the present work, we study these questions numerically and compare results obtained using an Eulerian Vlasov code and a particle-in-cell (PIC) code. We attempt to compare quantitatively the Eulerian Vlasov code results and the PIC code results using the same set of parameters in the study of ion acceleration and the formation of plasma jets when a circularly polarized laser beam is normally incident on the surface of overdense plasma. It is important to compare different simulation approaches since numerical simulations are the only way to study kinetic effects in these highly relativistic and nonlinear problems. These kinetic effects and the self-consistent field structures are generally simulated numerically using PIC codes, as recently applied to study short-pulse laser plasma interactions in a number of publications (Liseykina et al., Reference Liseykina, Borghesi, Macchi and Tuveri2008; Klimo et al., Reference Klimo, Psikal, Limpouch and Tikhonchuk2008; Robinson et al., Reference Robinson, Zepf, Kar, Evans and Bellei2008; Schlegel et al., Reference Schlegel, Naumova, Tikhonchuk, Labaune, Sokolov and Mourou2009). However, because of statistical noise, PIC simulations can in some cases give unphysical results if the spatial resolution or the number of macroparticles per cell is insufficient (Cormier-Michel et al., Reference Cormier-Michel, Shadwick, Geddes, Esarey, Schroeder and Leemans2008). Therefore, comparing PIC code simulations with Vlasov simulations, which are noiseless but much more intensive numerically, is of interest for this reason too.
Two cases will be studied, in a situation of a high-intensity laser beam and a strongly overdense plasma. In the first case, the laser intensity rises gradually and then remains constant, in order to study the laser-plasma interaction under constant laser amplitude. In the second case, we use a laser beam with a Gaussian-shaped pulse. To facilitate the comparison between the two cases, the gradual rise of the pulse in the first case is a half-Gaussian, identical to the rising part of the second case. While the Gaussian pulse is more usual, we considered it of interest to also study the effect of a constant intensity. Pulses of arbitrary shape, for example, nearly square ones of limited duration, can be produced using phase filtering (Verluise et al., Reference Verluise, Laude, Cheng, Spielmann and Tournois2000; Weiner et al., Reference Weiner, Oudin, Leaird and Reitze1993). We have not, however, included this phase distorsion of the pulse in our simulation because a recent exploration of the effects of chirping on harmonic generation and laser energy absorption has shown that the essential effects are due to the shape of the pulse envelope, and not to the frequency chirp per se (Lavocat-Dubuis et al., Reference Lavocat-Dubuis, Vidal, Matte, Popovici, Ozaki and Kieffer2011). In both cases studied, we will analyze the role of the radiation pressure of the laser beam in the acceleration of the ions and in the plasma jet formation processes. It is interesting to note that in these two cases, the resulting phase-space structures of the electrons and of the ions are quite different. The results obtained with the two codes show good quantitative agreement between the macroscopic quantities. The low noise level of the Eulerian Vlasov code allows a more detailed representation of the phase-space structures associated with this system, especially in the low density regions of the phase-space, unless a prohibitively large number of particles are used in the PIC code simulations.
2. THE RELEVANT EQUATIONS OF THE EULERIAN VLASOV CODE
The relevant equations of the Eulerian Vlasov approach are those previously presented (Shoucri et al., Reference Shoucri, Afeyan and Charbonneau-Lefort2008; Shoucri, Reference Shoucri and Shoucri2010; Shoucri & Afeyan, Reference Shoucri and Afeyan2010). We present here these equations in order to fix the notation. Time t is normalized to the inverse laser wave frequency ω−1, length is normalized to l 0 = cω−1, velocity and momentum are normalized, respectively, to the velocity of light c and to M ec, where M e is the electron mass, and c is the velocity of light. The general form of the Vlasov equation in the four-dimensional phase-space for the electron distribution function F e(x,p xe, p ye, p ze, t) and the ion distribution function F i(x, p xi, p yi, p zi, t) (one spatial dimension) are written in a dimensionless form as follows:

with

(the upper sign in Eq. (1) is for the electron equation and the lower sign for the ion equation, and subscripts e or i denote electrons or ions, respectively). In our normalized units μe = 1 and  is the ratio of ion to electron masses.
In the 1D model, the normalized canonical momentum  (where
 is the normalized vector potential), is conserved in the normal direction and has been chosen to be 0, we obtain
 . The four-dimensional distribution function
 is thus reduced to a two-dimensional distribution function f e,i(x, p xe,i, t):

Therefore, we have the following Vlasov equations for the electrons and the ions:

where γe,i = (1 + (p xe,i /μ e,i)2 + (a ⊥ /μe,i)2)1/2.

and φ is given by Poisson's equation, which is given here by:

The transverse electromagnetic fields E y, B z and E z, B y for the circularly polarized wave obey Maxwell's equations. Defining E ± = E y ± B z and F ± = E z ± B y, we have:

From the previous equations, we see that E + and F − are forward propagating waves along their vacuum characteristic x = t, and E − and F + are backward propagating waves.
These equations are integrated along their vacuum characteristic x=t. In our normalized units we have the following expressions for the normal current densities:

The longitudinal electric field is calculated from Ampère's equation: 
where

Test runs were made in which Poisson's equation was used instead of Ampère's to obtain the longitudinal electric field, with identitical results.
The Eulerian Vlasov code we use to solve Eq. (4) was recently applied (Shoucri et al., Reference Shoucri, Afeyan and Charbonneau-Lefort2008; Shoucri, Reference Shoucri and Shoucri2010; Shoucri & Afeyan, Reference Shoucri and Afeyan2010). The associated numerical methods are presented (Shoucri, Reference Shoucri2008a, Reference Shoucri2008b, Reference Shoucri2008c; Reference Shoucri and Colombo2009; Shoucri et al., Reference Shoucri, Afeyan and Charbonneau-Lefort2008). Interest in Eulerian grid-based solvers associated with the method of characteristics for the numerical solution of the Vlasov equation arises from the very low noise level associated with these codes, which allows the study of the low density regions of the phase-space where particles are accelerated. The Eulerian Vlasov code was executed on an AMD Opteron 2218 processor (CPU 2.6 GHz).
PIC codes are more widely known and their basic algorithms will not be discussed here. For a general reference on PIC codes, see Birdsall and Langdon (Reference Birdsall and Langdon1981). The PIC code we used is the relativistic 1D code BOPS (Gibbon & Bell, Reference Gibbon and Bell1992). For the present application, only a 1D normal incidence was considered. The code assumes a pre-ionized medium. The PIC code was run on an AMD Opteron 248 processor (cpu 2.19 GHz).
3. A CIRCULARLY POLARIZED LASER BEAM NORMALLY INCIDENT ON AN OVERDENSE PLASMA (N/NCR = 100): ION ACCELERATION AND PLASMA JET FORMATION
We use a fine resolution in the phase-space, with N = 10000 grid points in space for both codes, and 2200 grid points in momentum space for the electrons and the ions for the Eulerian Vlasov code (extrema of the electron momentum are ±5, and ±210 for the ion momentum). This fine resolution of the phase-space guarantees accurate results. 500,000 particles were used for the electrons and the ions in the PIC code, which necessitated about 35 hr on the Opteron 248. The Eulerian Vlasov code necessitated about 4 weeks on the Opteron 2218 (parallelization would of course enhance these performances, but has not been implemented yet).
A characteristic parameter of high power laser beams is the normalized vector potential or quiver momentum  , where
 is the vector potential of the wave. We chose for the amplitude of the vector potential
 . For the circularly polarized wave 2a 02 = I λ02/1.368 × 1018, I being the intensity in W/cm2, and λ0 the laser wavelength in microns. In our case ω = 0.1ωpe, where ω is the laser frequency and ωpe is the plasma frequency, which corresponds to n/n cr = 100, where n cr is the critical density. The Lorentz factor for the transverse oscillation of an electron in the field of the wave is
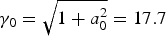 . Deuterium ions are used with M i /M e = 2 × 1836, where M i is the deuterium mass. The initial distribution functions for electrons and ions are Maxwellians with temperatures T e = 1 keV for the electrons and T i = 0.1 keV for the deuterons. The length of the system is L = 20 in units of c/ω. From the parameters presented, we have a grid spacing Δx = 0.002, and we used a time step Δt = Δx in both codes. The initial configuration is presented in Figure 1a. We have a vacuum region of length L vac = 7.85 on each side of the plasma slab. The steep ramp in density at the plasma edge on each side of the flat top density of the slab target has a length of L edge = 0.3. The length of the central plasma slab, with flat top density of 1 (normalized to 100n cr), is L p = 3.7. In free space ω = k for the electromagnetic wave, and as λ0 = 2π the condition that λ0 ≫ L edge is very well satisfied.
Electron (full curves) and ion (dashed curves) density profiles obtained from the Eulerian Vlasov code.

The forward propagating circularly polarized laser wave enters the system at the left boundary (x = 0), where the forward propagating fields are E + = 2E 0P r(t)cos(τ) and F − = −2E 0P r(t) sin(τ), as defined in Eq. (7). In these expressions, τ = t −1.5t p and t p = 12 is the pulse duration at full width at half maximum of the beam intensity. In our normalized units E 0 = a 0. For Gaussian time dependence, the shape factor P r(t) is given by:

Two cases will be considered. In the first case, P r(t) is given by Eq. (10) for t < 1.5t p and P r (t) = 1 for t > 1.5t p. In this case, we keep the amplitude at x = 0 of the forward propagating field constant when it reaches its maximum value, to allow a study of the laser-plasma interaction under a constant laser amplitude. In the second case, P r (t) is allowed to vary according to Eq. (10) for all time t, so that the forward propagating laser beam behaves as a Gaussian pulse.
3.1. Case 1: Constant Amplitude Laser
In this case, we keep the amplitude of the forward propagating field constant when it reaches its maximum value, i.e., the shape factor P r (t) = 1 for t > 1.5t p. We first present in Figure 1 some of the results obtained with the Eulerian Vlasov code for the density profiles against distance. The electron and ion density profiles at times t = 0, 20, 25.2, 30, and 55 (in units of ω−1) are given in Figures 1a–1e, respectively. In Figure 1b, electrons are accelerated at the WFPEI under the effect of the radiation pressure and form a steep density spike. An electric field is formed at the edge (see Fig. 2), which accelerates the ions at the edge, as shown in Figure 1c. From Figures 1c–1e we see a solitary-like structure at the WFPEI propagating to the right under the effect of the ponderomotive pressure. At the right of this solitary-like structure we see in Figure 1e expanding neutral plasma with the formation of a shock-like structure in the forward direction (see Fig. 2f for details).
Density profiles at the edge of the plasma for the electrons (full curves), the ions (dashed curves) and the electric field (dashed-dotted curve) reduced by a factor of 10, obtained from the Eulerian Vlasov code. The inset in Figure 2(e) is a zoom near the edge.

The sequence of the very rapid acceleration of the ions at the WFPEI, and a rapid build-up of an ion solitary-like structure in the ion density profile at the target surface under the combined effects of the edge electric field and the ponderomotive pressure is shown in more detail in Figure 2, where we concentrate the plots at the WFPEI. This ion acceleration driven at the target surface has been discussed in previous publications (Macchi et al., Reference Macchi, Cattani, Liseykina and Cornolti2005; Klimo et al., Reference Klimo, Psikal, Limpouch and Tikhonchuk2008; Robinson et al., Reference Robinson, Zepf, Kar, Evans and Bellei2008; Schlegel et al., Reference Schlegel, Naumova, Tikhonchuk, Labaune, Sokolov and Mourou2009; Shoucri et al., Reference Shoucri, Afeyan and Charbonneau-Lefort2008; Shoucri & Afeyan, Reference Shoucri and Afeyan2010; Shoucri, Reference Shoucri and Shoucri2010). In Figure 2a, at t = 20, we see a build-up of the electron density at the edge under the effect of the ponderomotive pressure of the laser beam. The ion density shows little distorsion, and a longitudinal electric field is formed at the plasma edge due to the net charge resulting from the difference between the electron and ion density profiles (we plot E x/10 to use the same scale). One can see in Figures 2b and 2c that the solitary-like structure of the ions, at t = 24.4 and t = 25.2, respectively, is building up very rapidly, and the peak ion density at the edge is reaching the peak value of 18 at t = 25.2. Robinson et al. (Reference Robinson, Gibbon, Zepf, Kar, Evans and Bellei2009) made the analogy that the ponderomotive pressure acts like a piston, and defined a dimensionless “pistoning parameter” Ξ = I/(ρc 3). In their simulations, this parameter was much larger than in ours (0.02 or higher, vs. 0.00042 here), which is why they saw a stronger charge separation than we. In our case, the radiation pressure exerted on the electrons pushes them very effectively, but, contrary to Robinson et al. (Reference Robinson, Gibbon, Zepf, Kar, Evans and Bellei2009) the electron Mach number is not sufficient to produce a narrow spike in the electron density. For the ions, however, the “piston” picture is incomplete and, as noted by Robinson et al. (Reference Robinson, Gibbon, Zepf, Kar, Evans and Bellei2009), the finite time that it takes for the electrostatic field to accelerate them explains the ion density spike, which we see particularly well in the inset of Figure 2e. Now, in this figure, we do note that the peak of the ion density is to the left of the maximum of the electron density, while these coincided in the more weakly driven simulations of Macchi et al. (Reference Macchi, Cattani, Liseykina and Cornolti2005) and Shoucri et al. (Reference Shoucri, Afeyan and Charbonneau-Lefort2008), where the parameter Ξ was about two times lower (0.0002). A similar association of the electric field with a rapid build-up of the ion density at the WFPEI was attributed to Buneman instability (Buneman, Reference Buneman1959) by Albright et al. (Reference Albright, Yin, Boers, Hegelich, Flippo, Kwan and Fernandez2007). We note that from Eq. (10) the laser intensity reaches a peak at 3t p/2 = 18 at the boundary x = 0. This peak has to travel a distance of about x = 8 to reach the target surface (see for instance Fig. 1a). So the maximum laser intensity will reach the target surface at about t ≈ 26, i.e., about the time where we see the strong acceleration of the ions at the target surface in Figures 1c and 2c. The penetration of the electric field in the plasma at the plasma edge can be evaluated from Figure 2 to be on the order of 0.1, and since in the present calculation ω = 0.1ωpe, so the penetration is on the order of c/ωpe, i.e., on the order of the skin depth. The subsequent evolution of the system is shown in Figures 2d–2f, with a zoom close-up of the WFPEI as an inset in Figure 2e. The solitary-like structure for the ions is maintaining a very stable profile at the WFPEI and moves forward at constant speed. The incident light, having reached constant amplitude, is applying a constant ponderomotive pressure at the WFPEI. To the right of this peak the accelerated high velocity ion population is now free streaming toward the right (see the ion phase-space in Fig. 4). The shape of a small shock-like structure with a steepening process at the right edge of the expanding ions is developping in Figure 2e at the right of the main peak, with two shock-like peak structures appearing in Figures 2e–2f. Similar features were seen by Macchi et al. (Reference Macchi, Cattani, Liseykina and Cornolti2005) in their thicker (2 λL) target simulations, but not in their very thin (0.1 λL) ones, and are due to secondary ion bunches created at the right of the main shock. Note how in this expansion region, the electron density appears to be exactly compensating the ion density, so that in fact it is a neutral plasma jet that is expanding, with no electric field in this expansion region. The charge separation, which creates the longitudinal electric field, appears to be concentrated only at the WFPEI, and penetrates the plasma in a layer on the order of the skin depth, as we previously mentioned. Note also the presence of a small ion population accelerated in the backward direction (which is not the case for the electrons which show a sharp edge at the wave front, under the effect of the ponderomotive pressure).
The corresponding results obtained from the PIC code are presented in Figure 3. At t = 20, Figure 3a shows a result close to what we see in Figure 2a for the Eulerian Vlasov code, although the electron density peak in Figure 3a is slightly smaller than the corresponding peak we see in Figure 2a. Figures 3b and 3c, corresponding to t = 25.2 and t = 25.6, respectively, show that the growth of the ion peak is slower with the PIC code, if we compare with the result at t = 25.2 in Figure 2c. Then a rapid growth is taking place at t = 26 as shown in Figure 3d. So the same rapid growth as previously observed with the Eulerian Vlasov code is taking place with some delay. Figure 3e, at t = 30, is close to what we see in Figure 2d, although the electron peak is smaller in Figure 3e. Figure 3f, at t = 40, is also close to what we see in Figure 2e, although the electron density peak remains slightly smaller with respect to the one in Figure 2e. However the expansion of neutral plasma at the right of the ion peak, where the electron density compensates almost exactly the ion density, is similar to that in Figure 2e. Also the thickness of the non-neutral plasma layer at the WFPEI, with a longitudinal electric field penetrating the plasma for a thickness of the order of the skin depth, is very close in Figure 3f for the PIC code and Figure 2e for the Vlasov code.
Density profiles at the edge of the plasma for the electrons (full curve), the ions (dashed curve) and the electric field (dashed-dotted curve) reduced by a factor of 10, obtained from the PIC code.

The electric field at the WFPEI at t = 20 and t = 25.2 during the rise of the laser intensity (Figs. 2a and 2c, and in Figs. 3a and 3b) is shown in Figures 13a and 13b below. There is also a nice agreement in the intensity of the electric field between the two codes. The neutrality of the freely expanding region to the right is observed, with the electron density profile nicely compensating the ion density profile, resulting in essentially zero electric field in the free expansion region. Note that the structure of the longitudinal electric field peaks at the WFPEI and decays very rapidly inside the plasma, and also that it changes very little in time, as seen in Figures 2a–f2 and 3a–3f (the decay of the electric field in Fig. 13 for t > 25.2 corresponds to the Gaussian pulse shape to be presented in Case 2 below). The features that we noted in Figures 1 and 2 with the Vlasov simulation are also seen here with the PIC simulation, i.e., a solitary-like shape at the target surface propagating to the right under the effect of the ponderomotive pressure, and a plasma jet further to the right.
The position of the WFPEI and the solitary-like structure of the ions in Figures 2 and 3 are essentially the same (the solitary ion peak in Fig. 2e is at x = 8.64 and in Fig. 3f at x = 8.7). This interface is traveling at a constant speed for t > 26 under the constant ponderomotive pressure of the incident laser beam. This constant speed is calculated from the numerical results by following the interface in Figure 2 calculated from the Vlasov code or in Figure 3 calculated from the PIC code, and has a value of 0.024. The velocity of the front pushed by the ponderomotive pressure was calculated in (Denavit, Reference Denavit1992) by balancing the electromagnetic pressure at the absorber surface with the rate of increase in ion momentum, and the following expression for the velocity of the surface of discontinuity was obtained:

Using  , n/n c = 100, and M e/M i = 0.5/1836, we obtain u i = 0.029 (normalized to the velocity of light). This value is close to the value of 0.024 calculated by the Eulerian Vlasov and the PIC codes. We note however that a more accurate agreement with Eq. (11) was obtained for the slightly smaller values of a 0 used in Shoucri and Afeyan (Reference Shoucri and Afeyan2010) and Shoucri (Reference Shoucri and Shoucri2010) but where hydrogen at the same density was used, which resulted in a slightly higher velocity (0.033), as the “pistonlike parameter” Ξ was slightly larger: 0.00054 vs. 0.00042 here. (We note that the relativistic correction to Eq. (11) as reported by Schlegel et al. (Reference Schlegel, Naumova, Tikhonchuk, Labaune, Sokolov and Mourou2009) and Robinson et al. (Reference Robinson, Gibbon, Zepf, Kar, Evans and Bellei2009) is small in our case and reduces the velocity calculated in Eq. (11) from 0.029 to 0.028).
At the right of the ion peak in Figures 2d–2f and 3e–3f we have a neutral plasma jet with a shock-like structure expanding to the right with an average speed of about 0.052, calculated by dividing the distance traveled by the neutral plasma edge by the corresponding time difference. This entire structure is stable as it propagates and expands to the right. The value of the free streaming edge at the right can also be calculated for the Eulerian Vlasov code from Figures 6d and 6e below for instance, where we see the free streaming deuterium ions having a normalized momentum around 180. Hence, M iυ/M ec ≈ 180 or υ/c ≈ 180/(2 × 1836) = 0.05. This corresponds to energy of the deuterium ions of M iυ2/2 = M ic 2(υ/c)2/2 ≈ 938 × 0.0025 = 2.345 MeV. The value obtained from the PIC code (Fig. 9c below) is slightly higher: we have M iυ/M ec ≈ 200, or υ/c ≈ 200/(2 × 1836) = 0.054.
Figure 4a presents the forward propagating wave E + (full curve) and the backward reflected wave E − (dashed curve) at t = 40 for the calculation done with the Eulerian Vlasov code. Figure 4b presents the corresponding results for the forward propagating wave F − (full curve) and the backward propagating wave F + (dashed-curve). The same quantities obtained from the PIC code are presented in Figures 5a and 5b. The agreement between the two codes for the phase and amplitude of the incident and reflected waves is excellent. The electromagnetic wave damps in the plasma over a distance on the order of the skin depth c/ωpe. The strong increase of the ion and electron densities at the WFPEI makes the plasma more opaque, with the steep plasma edge acting as a moving mirror for the incident light. Note that when E + is at a peak value, F − is zero and vice-versa, so the wave is always maintaining a pressure on the surface of the plasma. The frequency of the backward reflected wave is slightly down-shifted by the moving reflecting plasma surface. We can check that in Figures 4a and 5a, the reflected waves (dashed curves) in vacuum have a wavelength (and a period) slightly bigger than the corresponding ones for the incident wave (full curve). In Guérin et al. (Reference Guérin, Mora, Adam, Héron and Laval1996), the following analytical expressions were derived for the reflected wavenumber k r and the reflected frequency ωr of the laser wave due to the Doppler shift by the moving reflecting surface:

where in our units βF = u i = 0.024 is the normalized velocity of the discontinuity surface. We have β = ω/k= 1 for the incident wave, since ω = k = 1 for the incident laser wave in free space. Hence:

Incident waves E+ (a) and F− (b) (full curves) and reflected waves E− (a) and F+ (b) (dashed curves) obtained from the Eulerian Vlasov code.

Incident waves E+ (a) and F+ (b) (full curves) and reflected waves E− (a) and F− (b) (dashed curves) obtained from the PIC code.

From Eq. (12), we get for the reflected wave in free space ωr = k r = 0.953. This is confirmed if we follow the peaks of the reflected wave in Figures 4 and 5 (dashed-curves). We find a wavelength for the reflected wave of 6.562, which corresponds to k r ≈ 0.957, in close agreement to what is calculated from Eq. (12).
Figure 6 presents the phase-space contour plots for the ion distribution function calculated from the Eulerian Vlasov code. Figure 6a shows the ion phase-space during the initial phase of ion acceleration at the edge of the target at t = 20, corresponding to Figure 2a. Figure 6b corresponds to the rapid acceleration phase of the ions shown in Figure 2b at t = 24.4. We concentrate the plot in Figures 6c–6e on the region of the edge. The loops appearing at the top in Figures 6d–6e correspond to the free streaming ions, escaping the front edge region. These loops in phase space appear because slower ions (lower part of the loop), which were accelerated by the shock during the rise of the laser pulse, are caught up by faster ones (upper part of the loop), which were accelerated by the shock when it was at its maximum and constant intensity. The right-most parts of these loops (x = 9.0 at t = 40 and x = 9.7 at t = 55) correspond to the beginning of the effective shock acceleration, and they coincide with peaks in density seen in Figures 2e and 2f. These loops are close to what has been presented by Klimo et al. (Reference Klimo, Psikal, Limpouch and Tikhonchuk2008) using PIC codes, and by Macchi et al. (Reference Macchi, Cattani, Liseykina and Cornolti2005). See also the recent results (Shoucri et al., Reference Shoucri, Afeyan and Charbonneau-Lefort2008; Shoucri & Afeyan, Reference Shoucri and Afeyan2010; Shoucri, Reference Shoucri and Shoucri2010). Note in Figures 6c-e that the accelerated ions are reaching approximately the same critical velocity after which they go to the free-streaming phase.
(Color online) Phase-space plots of the ion distribution function obtained from the Eulerian Vlasov code.

Figure 7 presents the phase-space contour plots of the electron distribution function calculated from the Eulerian Vlasov code. The steep edge at the left is due to the effect of the ponderomotive pressure pushing the electrons. Note the sharp profile at the WFPEI, and the electronic population being ejected forward. In particular, in the initial phase, Figure 7a shows a picture close to what has been reported (Bergmann & Mulser, Reference Bergmann and Mulser1993) in the study of wave breaking and electron acceleration using a Vlasov code. Figure 8 presents a closer look to the results in Figure 7d at t = 55, concentrating on the structures appearing between x = 9 and x = 10 in the electron phase-space. We see in Figure 8 in more details the structures around the solitary peak at the WFPEI, and around the two small peaks appearing in Figure 2f close to x = 9.2 and x = 9.5.
(Color online) Phase-space plots of the electron distribution function obtained from the Eulerian Vlasov code.

(Color online) Phase-space plot of the electron distribution function, concentrating on the edge region (zoom on Fig. 7d).

Figure 9 presents the position of the ions in the phase-space, calculated from the PIC code. Figure 9a shows at t = 20 an initial ion acceleration very close to what we see in Figure 6a. In Figure 9b, at t =30, the general behavior is still close to Figure 6c. In Figure 9c, at t = 40, we see the ions accelerated more with respect to Figure 6d for the Eulerian Vlasov code, and the loop at the top is slightly different. Also the result in Figure 6d gives more details about the distribution of the ions than the result in Figure 9c for the PIC code, which appears sketchier. Figure 10 presents the position of the electrons in the phase space, calculated from the PIC code. Figure 10a and Figure 10b show a more important heating than what we see in Figure 7b and Figure 7c for the Eulerian Vlasov code that might be due to numerical diffusion.
Phase-space plots of the ion distribution function obtained from the PIC code.

Phase-space plots of the electron distribution function obtained from the PIC code.

3.2. Case 2: Gaussian Pulse
In this case, the laser pulse is Gaussian according to Eq. (10). The initial phase during the growth of the input pulse at x = 0 until t = 1.5t p is of course identical to what has been presented in Case 1. For t > 1.5t p, the pulse penetrating at x = 0 is decreasing. This decrease reflects itself at the target edge with a delay since the wave has to travel about x ≈ 8. to reach the WFPEI.
Figure 11 shows the results obtained using the Eulerian Vlasov code. Figure 11a, at t = 30 (the pulse intensity is starting its decay at the plasma edge), shows little difference compared to the result in Figure 2d. However, in Figures 11b and 11c there is a slow decrease in the density peaks, while the plasma is still expanding to the right (this will be discussed in the phase-space plots below in Figure 16), with the electron density essentially compensating the ion density and providing a neutral plasma expanding to the right. In Figures 11d and 11e, at t = 50 and t = 57.5, respectively, we see that the target edge is not moving anymore (the laser intensity is very small and there is no radiation pressure), but still the solitary-structure keeps propagating and the decay of the density peaks is becoming very slow. Some of the electrons are moving to the left, in the backward direction. Figure 12 presents the corresponding results obtained from the PIC code, which are close to Figure 11. (Fig. 12e shows an expansion to the right slightly higher than in Fig. 11e, due to the fact that the PIC code shows a slightly higher ion velocity, as can be seen in Fig. 17 below.) We present in Figure 13a the electric field (divided by a factor of 10 to be on the same scale as in Figures 11 and 12 at the WFPEI) obtained from the Eulerian Vlasov code. One observes an initial increase in the peak during the rise of the pulse at t = 20 and t = 25.2 (the same as in Case 1), followed by a decay of the edge electric field as the incident laser pulse amplitude decreases. The corresponding curves from the PIC code are presented in Figure 13b, which is similar to Figure 13a.
Density profiles at the edge of the plasma for the electrons (full curves), the ions (dashed curves) and the electric field (dashed-dotted curves) obtained from the Eulerian Vlasov code.

Density profiles at the edge of the plasma for the electrons (full curves), the ions (dashed curves) and the electric field (dashed-dotted curves) obtained from the Eulerian Vlasov code.

Electric field at the WFPEI, at times t = 20 (dashed), 25.2, (full) 30 (dotted), 35.2 (dash-dotted).

Figure 14 presents the ion phase-space at t = 30, 42.6, 50, and 57.5 obtained fron the Eulerian Vlasov code, concentrating on the WFPEI in Figures 14b–14d. Note the difference between Figures 6d–6e, obtained in the previous case of a constant amplitude laser, and Figures 14b–14d, obtained for the present case of a Gaussian laser pulse, where the ion acceleration is taking place over a broader energy spectrum. We have pushed the calculation with the Eulerian Vlasov code until t = 57.5 (see Fig. 14d). As mentioned for Figure 11e, the ions are expanding to the right in the neutral plasma in what appears to be essentially a ballistic propagation of the previously formed phase space structure, as there is no more ponderomotive pressure applied at the WFPEI. The electron phase-space calculated from the Eulerian Vlasov code is presented in Figures 15a–15d. Figures 16a and 16b show the same result in as in Figures 15c and 15d, respectively, concentrating on the region of the expanding plasma. We see that the electrons in the neutrally expanding plasma region are forming vorticity structures in the phase-space. Note the difference in the phase-space structure with respect to the phase-space structure shown in Figure 8. Note also a small population of electrons going in the backward direction (to the left). The solitary-like structure at the plasma edge is still present, decaying very slowly. The phase-space plots for the ions from the PIC code are presented in Figure 17. Figure 17a compares well with Figure 14a. Figures 17b–17d are more sketchy compared to Figures 14b–14d, and show that a slightly higher velocity value for the ions is reached. The electron phase-space is presented at times t = 42.6 and 57.5 in Figures 18a and 18b, repectively. Note, once again, more heating of the electrons appearing in Figure 18 than in Figure 16. Finally, we present in Figures 19a and 19b at t = 42.6 the laser wave fields, which has now decayed at the WFPEI as a consequence of the decrease of the Gaussian pulse. Both the Eulerian Vlasov code and the PIC code show the same results (as we previously mentioned regarding Figs. 4 and 5). So there is now no ponderomotive pressure on the plasma edge because of the decay of the laser pulse, and the edge now remains at essentially the same position as we can verify from Figures 11c, 12c, 11e, and 12e, while on the other side the neutral plasma is expanding.
(Color online) Phase-space plots of the ion distribution function obtained from the Eulerian Vlasov code.

(Color online) Phase-space plot of the electron distribution function obtained from the Eulerian Vlasov code.

(Color online) Phase-space plot of the electron distribution function near the WFPEI. Zooms of Figures 15c and 15d.

Phase-space plots of the ion distribution function obtained from the PIC code.

Phase-space plot of the electron distribution function obtained from the PIC code.

Incident waves E+ (a) and F+ (b) (full curves) and reflected waves E− (a) and F− (b) (dashed curves) obtained from the PIC code at t = 42.6.

4. CONCLUSION
Laser-driven ion beams have properties that differ in several aspects from beams of comparable energy obtained from conventional acceleration techniques, and have the potential to be applied in a number of innovative applications in the scientific, technological and medical areas (Liseykina et al., Reference Liseykina, Borghesi, Macchi and Tuveri2008; Robson et al., Reference Robson, Simpson, Clarke, Ledingham, Lindau, Lundh, McCanny, Mora, Neely, Wahlström, Zepf and McKenna2007; Schlegel et al., Reference Schlegel, Naumova, Tikhonchuk, Labaune, Sokolov and Mourou2009) and for ion-driven fast ignition (Fernandez et al., Reference Fernandez, Honrubia, Albright, Flippo, Gautier, Hegelich, Schmitt, Temporal and Yin2009). They also play a fundamental role in a number of physical situations where plasma jets of high speed are observed, and are believed to emulate the main acceleration mechanism for cosmic rays at the front of collisionless shock waves generated during supernova explosions (Berezinskii et al., Reference Berezinskii, Bulanov, Dogiel, Ginzburg and Ptuskin1990).
In the present paper, we have used an Eulerian Vlasov code and a PIC code for the numerical solution of the 1D relativistic Vlasov-Maxwell equations to study the interactions at the surface of overdense plasma under the effect of a high-intensity normally incident circularly polarized laser beam. We used in the present simulations the conditions λ0 ≫ L edge, where λ0 is the laser beam wavelength, and n/n cr ≫ 1. At the WFPEI, the electrons are pushed by the ponderomotive pressure, forming a steep gradient at the target surface. This generates a charge separation and an electric field at the plasma edge which accelerates the ions. A solitary-type structure at the WFPEI is formed.
The moving steep plasma edge acts as a moving mirror reflecting the incident wave. Following the acceleration phase of the ions, there is a fraction of the ions that reach a free streaming expansion state in the forward direction, with the electrons compensating the charge of the expanding ions. There is a neutral plasma jet containing high energy ions which forms and propagates in the forward direction (Schaumann et al., Reference Schaumann, Schollmeier, Rodriguez-Prieto, Blazevic, Brambrink, Geissel, Korostiy, Pirzadeh, Roth, Rosmej, Faenov, Pikuz, Tsigutkin, Maron, Tahir and Hoffmann2005; Kar et al., Reference Kar, Borghesi, Bulanov, Key, Lyseikina, Macchi, Mackinnon, Patel, Romagnani, Schiavi and O. Willi2008). The planar free expansion phase of a neutral plasma bunch at the right of the target surface is associated also with the formation of shock-like structure and sharp ion front with ion peaks or spikes (called bunching) in the local ion density (Figs. 2e and 2f).
Two cases were investigated: (Case 1) a constant laser intensity and (Case 2) a Gaussian laser pulse. Substantial differences in the phase-space plots of the ion and electron distribution functions were observed between the two cases. In Case 1, the ion distribution function shows loops (Figs. 6d and 6e) that are likely associated to ions accelerated at different stages of the development of the shock-like structure while those loops are absent in Case 2 likely because of transient nature of the shock (Fig. 14). In the latter case, we are left after the decay of the pulse with a solitary-like structure at the plasma edge of the target surface which appears to be decaying slowly, while the neutral plasma expanding at the right is continuing its expansion (Fig. 11). In addition, in Case 2, the electron distribution function shows more complex vorticity-like structures in the phase-space (Fig. 16) compared to Case 1. The origin of those structures is not clear yet but is likely related to the streaming instability.
The Eulerian Vlasov code and PIC code show good general agreement between the macroscopic quantities calculated by the two codes, in describing the ponderomotively accelerated ions at the WFPEI, and the formation of a neutral plasma jet ejected in the forward direction. This is an interesting result since a substantial number of simulations in this field are usually done using PIC codes. Some differences between the two codes could be observed however: (1) a delay in the appearance of the ion peak in Case 1, and (2) a higher electron temperature observed in both Cases 1 and 2. A possible explanation is numerical diffusion in PIC simulations, although energy conservation was verified with good accuracy. The low noise level of the Eulerian Vlasov code allows a far more detailed representation of the phase-space structures associated with this system, especially in the low density regions of the phase-space.
ACKNOWLEDGMENTS
M. Shoucri acknowledges the constant support and encouragement of Dr. André Besner and Dr. Réjean Girard and is also grateful to the Centre de calcul scientifique de l'IREQ (CASIR) for computer time used to do part of this work. We also thank Mr. Philippe Lassonde for useful information on the issue of the pulse shape.



