


In the United Kingdom, a country with a long history of homophobia curtailed by a recent and rapid period of transformation, is sexual orientation and gender identity a factor at election time?Footnote 1 The transformation of British law in the area of gay rights has been pronounced. Homosexuality was illegal prior to 1967 in England and Wales and was not fully decriminalized in other regions until 1981. But the Age of Consent was equalized in 2000 and marriage equality was introduced in 2013. However, homophobia remains. A 2013 YouGov report for Stonewall, Gay in Britain, found that the vast majority of LGBT people expected to be treated worse than straight people by the police, to face barriers if they wanted to adopt or foster a child, and expected their child to be bullied in school. Pernicious legal discrimination has left a legacy in many social realms, and in some regions—most notably Northern Ireland—legal discrimination remains. The question of the impact of sexual orientation on election outcomes is important not only to explore the evolution of gay rights, but also more broadly to understand the relationship of descriptive representation to rapid social change.
ARE SEXUAL, GENDER, AND ETHNIC MINORITIES PENALIZED AT THE BALLOT BOX?
There are few quantitative studies on LGBT candidates, mostly focused on the US (Haider-Markel Reference Haider-Markel2010). A larger literature on minority candidates has analyzed the mechanisms through which gender and ethnic identities influence voters’ decisions. Candidate demographic traits provide informational shortcuts based on group stereotypes (Huddy and Terkilsen Reference Huddy and Terkilsen1993; McDermott Reference McDermott1997; Sanbonmatsu Reference Sanbonmatsu2002). Both female and ethnic minority candidates in the US are perceived as more liberal than male or white candidates, and this perceived ideological position interacts with partisanship to affect electoral performance (Koch Reference Koch2000; see also Lawless Reference Lawless2004).
We believe that sexual orientation can also work as a cueing mechanism, inasmuch as voters attach characteristics to LGBT candidates based on stereotypes about LGBT people. Historically, these characteristics have been negative. Gay men have often been a convenient target for the conservative and religious right because of their portrayed stereotypical lifestyle based on sexual promiscuity and the association with the AIDS epidemic. As a result, gay men often elicited more disgust than any other outgroup (Cottrell and Neuberg Reference Cottrell and Neuberg2005). In 1981 43% of Britons and in 1990 42% believed that homosexuality was never justified, while respondents who always justified homosexuality declined from 7% in 1981 to 4% in 1990 (EVS 1981, 1990).
DECREASING HOMOPHOBIA AND EMERGENCE OF LGBT CANDIDATES
Over time, attitudes toward homosexuality have become far more positive in the west (Andersen and Fetner Reference Andersen and Fetner2008). This change has led to greater support for LGBT rights, with rapidly evolving opinions on same-sex marriage and limited backlash following the advance in gay rights (Bishin et al. Reference Bishin, Hayes, Incantalupo and Smith2016). In Britain, the social and political shift on gay rights has been seismic. By 2013, 76% of Britons said homosexuality should be accepted (Pew Research Center Reference Park, Bryson, Clery, Curtice and Phillips2013). In 2015, all the main British political parties were committed to the recently enacted marriage equality and antidiscrimination legislation. Political parties have also become more willing to select LGBT candidates. There were 155 out LGBT candidates in May 2015 and 159 in June 2017.
Part of the explanation for the more positive attitudes toward gay rights lies in citizens’ greater exposure to the lives of LGBT people, through either direct personal contact or greater visibility in the media (Ayoub and Garretson Reference Ayoub and Garretson2017). Because of the more positive feelings toward LGBT people and increased exposure to LGBT candidates, we expect voters to be less likely to withhold their support for candidates based on their LGBT identity. Furthermore, we expect LGBT candidates to signal positive voting cues to growing sectors of the electorate. Studying gender, McDermott explains that voters can make “reasonable assumptions about the ideology of a candidate based on associations with salient political or social groups” (McDermott Reference McDermott1997, 271). We believe that LGBT candidates are more likely to be perceived as liberal than their straight counterparts. In the US, LGBT individuals have generally been to the left of the voting population, even on questions where sexual orientation was far from being the central issue (Egan, Edelman, and Sherrill Reference Egan, Edelman and Sherrill2008). Hence, we anticipate that LGBT candidates will enjoy relatively greater support in more center-left environments.
2015 ELECTION: LGBT CANDIDATES AND MPS
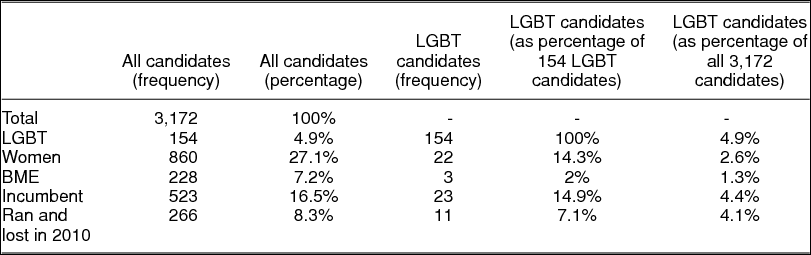
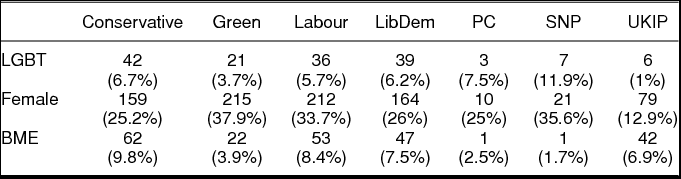
There were 155 LGBT candidates in the UK in 2015, including one in Northern Ireland (Table 1). The Conservative Party put up more openly gay candidates than any other: 39 men and three women. Of their thirteen incumbent out members of parliament (MPs), twelve stood for re-election, and only one lost. His loss, however, was made up for by the election of one new Tory MP, and five other LGB-identifying Tory MPs—three of them cabinet Ministers—came out over the following eighteen months. Labour only gained ten seats from the Tories in 2015, but three of them were won by gay or bisexual candidates. The nine incumbent Labour lesbian and gay MPs held on comfortably. After the election, one more Labour MP came out. All four gay and bisexual Liberal Democrat MPs were ousted, but they were swept away on a tide that arguably had little or nothing to do with their work as constituency MPs. The Scottish National Party sent shock waves through British politics in May 2015, and on that wave rode in seven new LGB-identifying MPs (see Table 2). That number was increased when one more Scottish National Party (SNP) MP came out in February 2016. Overall, by May 2017, 39 (6%) UK MPs identified as LGB.
Candidates at the 2015 Election.Footnote 2

BME stands for “black and minority ethnic.”
Northern Ireland is not part of this analysis.
Candidate Sexual Orientation, Gender, and Ethnic Identity by Party (Percentages Based on Total Number of Candidates by Party).

DATA AND VARIABLES
We explore the impact of self-proclaimed sexual orientation on electoral results in the 2015 election.Footnote 3 We exclude the eighteen Northern Ireland and the Speaker's districts, and focus on the 631 single-member plurality constituencies in England, Scotland, and Wales. Our dependent variable is party vote share at the constituency level. We include all of the 3,172 candidates running for the major parties: Conservative, Green, Labour, Liberal-Democrat, Plaid Cymru, Scottish National Party (SNP), and United Kingdom Independence Party (UKIP).
Our regressors comprise both candidate-level and contextual variables. Among individual-level indicators, the main variable of interest is sexual and gender identity (LGBT), which is coded zero for candidates identifying as straight and one for candidates identifying as lesbian, gay, bisexual, or transgender. 154 candidates from 140 constituencies identify as LGBT; of these, 22 are women, four transgender, and three non-white.Footnote 4 We control for gender and ethnic identity, which is captured, but not disaggregated, by BME (“black and minority ethnic”).Footnote 5 We also consider incumbency status to account for name recognition and political experience. Finally, we control for party vote share in the district in the 2010 election to observe how the traits of the 2015 candidates affected change in results.Footnote 6
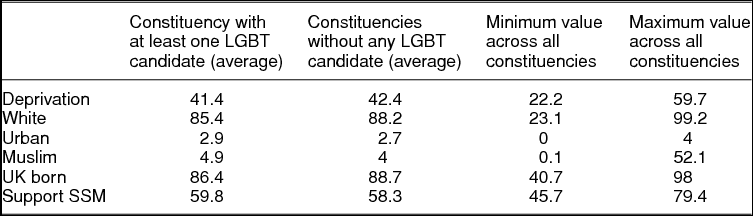
Constituency-level variables include Deprivation, which is a measure of the socioeconomic well-being;Footnote 7 Urban, a five-category variable ranging from “mainly rural” to “entirely urban”; Muslim, which captures the percentage of Muslim residents;Footnote 8 UK born, the share of individuals born in the UK; and White, which measures the percentage of white residents.Footnote 9 We also control for the percentage of residents in favor of same-sex marriage at the constituency level (Hanretty, Lauderdale, and Vivyan Reference Hanretty, Lauderdale and Vivyan2017). Finally, we include the average change in party vote share at the regional level between 2010 and 2015, which accounts for the general trend of the party that presumably affects the electoral success of specific candidates. Table 3 shows that constituency indicators do not vary substantially between districts with and without LGBT candidates. LGBT candidates, therefore, did not run under more favorable conditions.
Constituency Sociodemographic Characteristics.

MODELS AND RESULTS
Since our dependent variable is party vote share in a multiparty election, we have compositional data—with non-independent vote shares of different parties in the same district—and the dependent variable is bounded between zero and one. We follow Tomz, Tucker, and Wittenberg (Reference Tomz, Tucker and Wittenberg2002)Footnote 10 and adopt a strategy that is based on seemingly unrelated regressions (SURs) and that converts party vote shares into the logistic transformation of vote share ratios. In each model, we select a party as the reference and, for our dependent variables, we calculate the natural log of the vote share ratio between the reference party and each of the other parties in the district. While this solution allows us to address the issues mentioned above that make ordinary least squares (OLS) regression a less appropriate strategy, it also has an important limitation. This strategy requires us to run separate analyses based on patterns of contestation. With seven parties, this becomes problematic because some patterns of contestation present a very low number of observations. Hence, we proceed in two steps. We first present the analysis based on SURs with log ratio transformations for the 501 districts in England with full contestation. We then turn to multilevel models that—despite the limitations previously described—allow us to consider all the electoral districts, including those in Scotland and Wales.
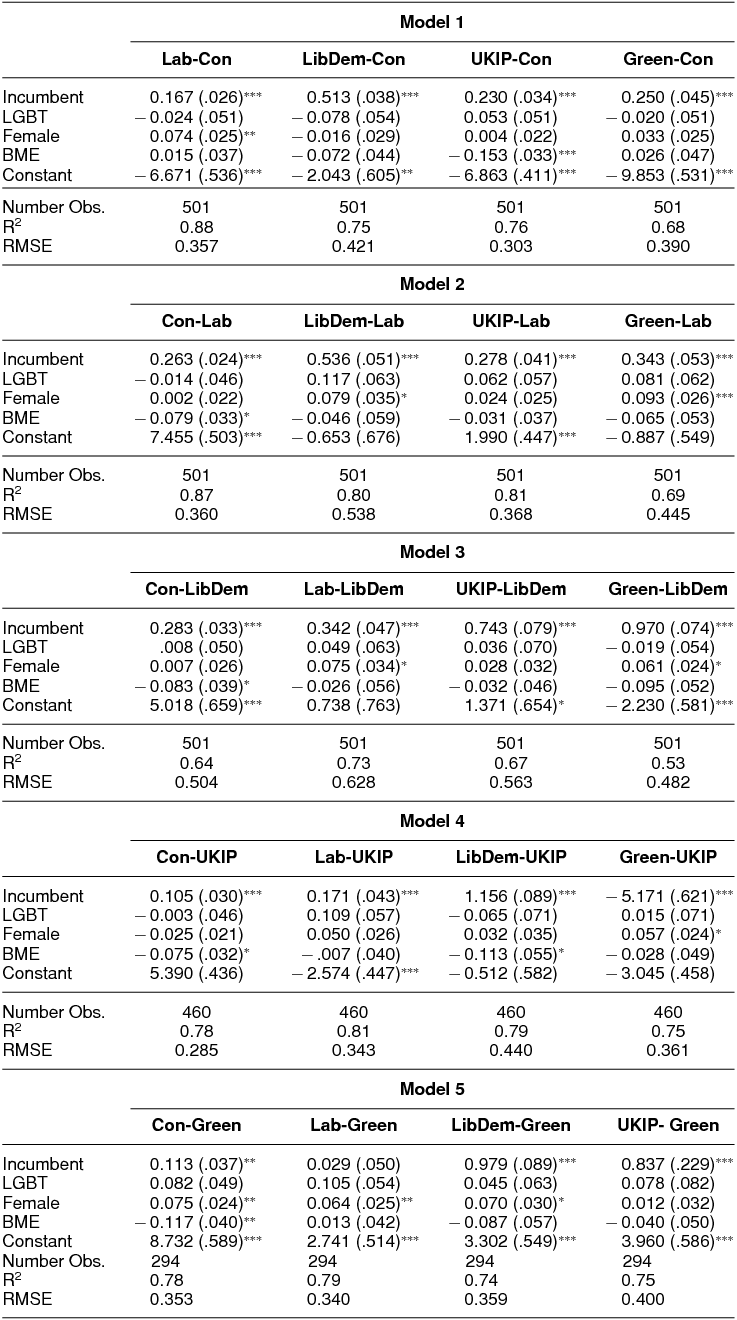
In the SUR models, all the individual variables are coded one when the modeled party has an LGBT (or female or BME or incumbent) candidate and the reference party does not; zero when neither, or both, the modeled and the reference parties have LGBT candidates; and −1 when the reference party has an LGBT candidate and the modeled party does not. Hence, a positive coefficient sign indicates a positive impact of the candidate characteristic on vote share. All of the models include the individual and contextual controls previously described. Given space constraints, we present individual-level variables and report the full models with controls in the Online Appendix.
Table 4 shows that sexual orientation does not have a negative impact on party vote share. This suggests, therefore, that the electorate did not punish LGBT candidates because of their sexual orientation. The nonsignificance of the coefficient is in itself an important finding. Indeed, at a time when parties may still be reluctant to field openly gay and lesbian candidates because of uncertainty about voters’ attitudes, this result shows that those fears are unfounded. This contrasts with the results for ethnic minority candidates, who appear to decrease party vote share in several races, especially when Conservatives and UKIP are considered.Footnote 11 On the contrary, female candidates boost party vote share when Labour, Green, and, to some extent, Liberal Democrats are considered.
Candidate Election Results (SURs)

Al the models include the following controls: Deprivation, Urban, White, Muslim, UK born, Support for Same Sex Marriage; ratio of vote share of modeled and reference party in 2010; regional average change in party vote share between 2010 and 2015. Excluding regional change in party vote share does not change the results. The number of observations is smaller when UKIP and Green are the reference parties because they competed in fewer districts in 2010.
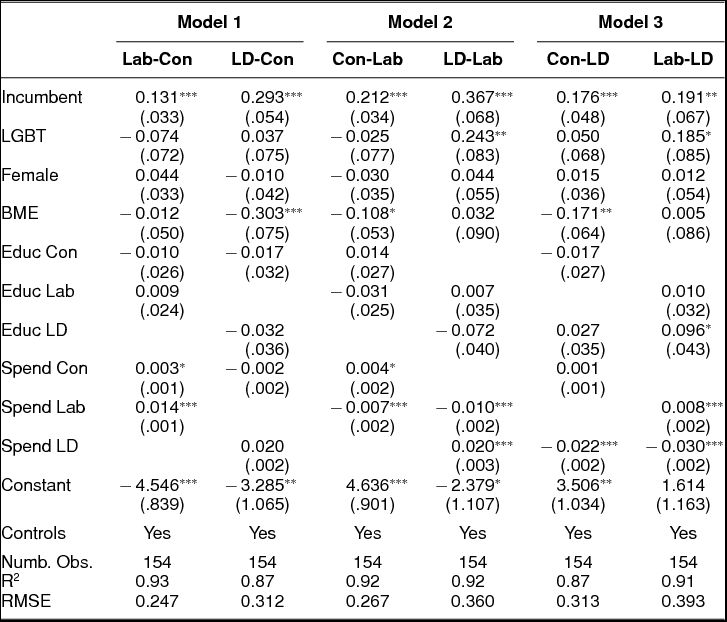
One may wonder whether the lack of negative impact of LGBT candidates on party vote share is partially driven by the fact that such candidates are, on average, candidates of higher quality or have more resources. Research on the impact of female candidates argues that a gender-based quality gap exists and drives the sometimes illusory gender parity (Pearson and Mcghee Reference Pearson and McGhee2013). To control for candidate quality and resources, we consider two further variables measuring candidate education and campaign spending. LGBT candidates are not significantly more educated or funded at higher levels. On a scale from one to five, where four is “any undergraduate degree,” the average level of education is 4.1 for both LGBT and straight candidates; 19.2% of LGBT candidates attended either Oxford or Cambridge, compared to 18.8% of straight ones. LGBT candidates spent on average £19,360 during the campaign, while straight ones spent £19,193. We now add candidate education and campaign spending in the models presented above.Footnote 12 Since these variables are not available for all candidates and our SUR strategy proceeds by listwise deletion of the districts in which any characteristic of any candidate is missing, we need to limit this analysis to the three largest parties for which more information is available. The multilevel model below, then, allows us to consider all the parties.
Table 5 shows that sexual orientation does not reduce the vote share of any of the three largest parties even when we control for candidate education and campaign spending. If anything, LGBT candidates perform better than their straight counterparts in races where more socially liberal parties are considered, i.e., Labour and Liberal Democrats. This, again, contrasts with the results for ethnic minority candidates, who appear to have a negative effect when the Conservatives are the reference in the model.
Candidate Election Results: Candidate Education and Campaign Spending (SURs)

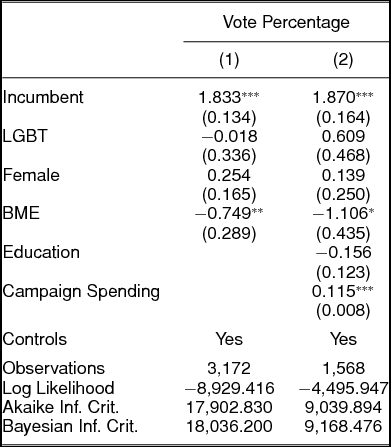
We now move to a model that considers all the electoral districts, including those in Scotland and Wales. Our units of analysis are the 3,172 candidates running for the House of Commons in 631 single-member districts. Given the hierarchical structure of the data, we adopt a multilevel model with varying intercepts in which candidates are grouped by constituency. We report the coefficients of the individual-level variables in Table 6 and show the models with the full contextual controls in the Online Appendix. The multilevel models again confirm that LGBT candidates do not have a negative impact on party results, even after controlling for education and campaign spending. Similarly to sexual orientation, gender does not decrease party vote share, while results are negative for ethnic identity.
Candidate Election Results (Multilevel Models)

Note: *p < 0.05; **p < 0.01; ***p < 0.001
To provide further support to the claim that the lack of statistical significance of the LGBT coefficient is evidence for a negligible effect, we follow the “two one-sided tests” approach and evaluate whether meaningful effects are possible (Rainey Reference Rainey2014). To define a meaningful effect, we consider both the median margin of victory in 2015 and the median difference in party vote share between 2010 and 2015. In 2015, the median difference in vote share between the winner and the second-best candidate at the constituency level was 24.4 percentage points. The median difference in party vote share in absolute value between 2010 and 2015 at the constituency level was 5.3 percentage points. We then calculate the 90% confidence interval around the LGBT coefficient estimated in Model 1, which corresponds to [–0.57, +0.53]. Since the confidence interval reveals that effects as small as 0.6 percentage points are implausible, we can more confidently state that sexual orientation did not have a substantially meaningful effect on party vote share. Indeed, the margin of victory was smaller than 0.6 percentage points in only five out of 631 constituencies. There were no LGBT candidates in any of these five constituencies (City of Chester, Derby North, Gower, Croydon Central, Ealing Central, and Acton).
We now explore whether LGBT candidates are penalized in more conservative districts. We interact candidate sexual orientation with the following constituency characteristics: support for same-sex marriage (SSM), urban/rural, share of Muslim residents, and share of white residents. We run the analysis with both SURs with log ratio transformation and multilevel modeling, including the individual and contextual controls previously described.Footnote 13
The SUR models return partial significance only when LGBT identity is interacted with support for same-sex marriage. The interaction goes in the expected direction, with LGBT candidates performing better in constituencies with more favorable attitudes toward SSM, but this finding is limited to races where more conservative parties are involved (when UKIP is modeled with LibDem and Conservative is modeled with UKIP). On the other hand, the interaction between sexual orientation and other district characteristics is not significant. This lack of significance suggests that LGBT candidates do not depress party vote share even in contexts that may be thought of as less favorable.
This non-negative effect is replicated by the multilevel models. The only significant interactions in the base multilevel models are those between LGBT, on the one hand, and Urban and Muslim on the other. The significance of Urban, however, disappears when we control for candidate education and campaign spending. Muslim remains significant, but the impact of LGBT candidates does not become negative until the Muslim percentage of the population is greater than 21%, which occurs only in 24 of the 631 constituencies. Hence, even in more conservative environments, LGBT candidates generally performed at least as well as their straight counterparts.
CONCLUSIONS
The reduction of homophobia in British voting behavior is striking. Until recently, LGBT people were reticent about running as out candidates based on the well-grounded fear that they would experience homophobia and electoral defeat (Elgot Reference Elgot2017). Up until 1967, homosexuality was illegal, and until 2017, LGBT Britons had reduced legal rights. A plethora of surveys showed discriminatory public attitudes. In 1983, two-thirds of voters opposed same-sex relationships because they believed they were morally “wrong.” Bias against homosexuals actually increased during the 1980s. The number of people saying homosexuality was “wrong” still outweighed those saying it was “not wrong” as late as 2010 (Park et al. Reference Park, Bryson, Clery, Curtice and Phillips2013).
Our results on the impact of candidate sexual orientation in the 2015 UK election offer a telling contrast with the United States. One of the factors explaining the stalled progress of out LGBT people in US electoral politics— as opposed to law—may be the reluctance of the Republican Party to embrace gay rights and gay candidates. Conversely, in Britain, as in Western Europe and parts of Latin America, the Conservative embrace of gay rights and gay politicians has taken much of the partisan sting out of gay rights issues. This may help explain why candidate sexual orientation is no longer detrimental in Britain.
The results of the 2017 election appear to confirm our findings. Forty-five (7%) out LGBT MPs were elected, a net gain of six over dissolution, including five new gay Labour MPs and three new Conservatives. The Tories only made eight gains outside of Scotland, and two of them were by LGBT candidates. LGBT Labour candidates made four gains (12.5% of the party's total gains). Nationally, the Labour vote was up by 9.5% and the Tories by 5.5%, while the 42 LGBT Labour candidates increased their party's vote by 10.9% and the 42 LGBT Conservatives by 6.3%. The 10 LGBT Scottish Nationalist Party candidates outperformed their 46 straight colleagues by 1.2%.
SUPPLEMENTARY MATERIAL
To view supplementary material for this article, please visit https://doi.org/10.1017/S0003055418000102.
Replication materials can be found on Dataverse at: https://doi.org/10.7910/DVN/CTZNJV.




Comments
No Comments have been published for this article.