Introduction
Subjective memory impairment (SMI), typically defined by subjective memory complaints and cognitive performance within the normal adjusted range (Jessen et al., Reference Jessen2014), is common among elderly people. Evidence suggests that SMI is a risk factor for future cognitive decline, as well as for mild cognitive impairment (MCI) and dementia (Glodzik-Sobanska et al., Reference Glodzik-Sobanska2007; Jessen et al., Reference Jessen2010). In addition, biomarker studies have reported increased prevalence of Alzheimer's disease (AD)-type pathology in individuals with SMI (Visser et al., Reference Visser2009; Peter et al., Reference Peter2014). Taken together, these findings suggest that SMI may be a symptomatic indicator of preclinical AD (Jessen et al., Reference Jessen2014). However, the biological basis of SMI is not comprehensively understood.
Medial temporal lobe (MTL) structures, including the hippocampus and entorhinal cortex, are affected in the early stages of AD (Braak and Braak, Reference Braak and Braak1991). A number of studies have investigated MTL structures in SMI patients, reporting reduced volumes in the hippocampus and entorhinal cortex, and thinning of the entorhinal cortex (van der Flier et al., Reference van der Flier2004; Jessen et al., Reference Jessen2006; Striepens et al., Reference Striepens2010; Meiberth et al., Reference Meiberth2015; Schultz et al., Reference Schultz2015). However, few studies have examined brain microstructural alterations in SMI (Selnes et al., Reference Selnes2012; Wang et al., Reference Wang2012). In addition, to our knowledge, no prior studies have specifically investigated both volumetric changes and microstructural alterations of MTL structures in SMI.
Current study investigated gray matter (GM) volume (measured with structural MRI) and microstructural alterations (measured with diffusion tensor imaging; DTI) of hippocampal and entorhinal regions in patients with SMI, compared with elderly controls without memory complaints, to better understand the relationship between GM volume and microstructural alterations in MTL structures.
Material and methods
Participants
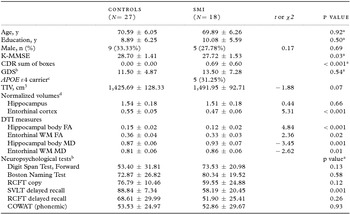
A total of 45 individuals (mean age: 70.31 ± 6.07 years) participated in this study, including 18 individuals with SMI and 27 healthy elderly controls. Individuals with SMI were enrolled from the memory clinic at our institution, after they were referred to the clinic for memory complaints. Elderly controls were recruited from the general population via advertisements. All participants provided a detailed medical history and underwent physical and neurological examinations, a neuropsychological test, laboratory tests, and a brain MRI scan. Demographic characteristics are given in Table 1.
Demographic data, clinical characteristics, and brain measures of the participants

Values represent mean ± SD or number (percentage).
Two-sample t (or Mann–Whitney U) and χ2 tests for comparisons between two groups were performed on continuous variables and categorical variables, respectively. Significant at p < 0.05.
a Mann–Whitney U tests.
b Regarding GDS and neuropsychological tests, data from 19 participants in the control group were missing.
c APOE genotyping was performed for 16 SMI patients.
d Normalized regional volumes were calculated with (raw volume/TIV) × 103
Neuropsychological test scores are percentile scores adjusted for age and education.
SMI = subjective memory impairment; K-MMSE = Korean version of Mini-Mental State Examination; CDR = Clinical Dementia Rating; GDS = Geriatric Depression Scale; APOE: apolipoprotein E; TIV = total intracranial volume; DTI = diffusion tensor imaging; FA = fractional anisotropy; WM = white matter; MD = mean diffusivity; RCFT = Rey Complex Figure Test; SVLT = Seoul Verbal Learning Test; COWAT = Controlled Oral Word Association Test.
SMI was defined as complaints of memory decline despite normal performance on tests of cognitive abilities, including memory (above −1.5 SD of age- and education-adjusted norms). Elderly controls without memory complaints were assessed using a questionnaire of the 28 illnesses proposed by Christensen et al. (Reference Christensen, Moye, Armson and Kern1992). Elderly controls did not report any concerns regarding decline in memory capacity and had normal cognitive performance on tests of cognitive tests (above −1.5 SD of age- and education-adjusted norms). Mini-Mental State Examination (MMSE) scores of all participants were above −1.5 SD of age- and education-adjusted norms.
Participants were excluded if they had major neurological or medial illnesses that could cause cognitive impairment, current, or past major psychiatric disorders (e.g. schizophrenia, major depression, or bipolar disorder), history of alcohol or substance abuse, significant MRI abnormalities (e.g. severe white matter (WM) hyperintensities, multiple lacunes, intracranial hemorrhage, brain tumor, or other focal lesions), or abnormal laboratory findings (e.g. abnormal thyroid function, low vitamin B12, or low folate, positive syphilis serology). In addition, any subjects taking psychoactive medications that could possibly affect cognitive function (e.g. antidepressants, neuroleptics, chronic anxiolytics or sedative hypnotics, etc.) were excluded.
The study was approved by the Institutional Review Board of our institution. All participants provided informed consent.
Neuropsychological tests
All participants received the Korean version of the MMSE (K-MMSE) (Kang et al., Reference Kang, Na and Hahn1997) for assessing global cognitive functions and the Clinical Dementia Rating (CDR) (Morris, Reference Morris1997) and completed detailed neuropsychological tests (Kang and Na, Reference Kang and Na2003). Neuropsychological tests included tests for attention, confrontational naming, visuospatial function, verbal and visual memory function, and frontal executive function. In addition, depressive symptoms were assessed using the Korean version of the Geriatric Depression Scale (GDS) (Bae and Cho, Reference Bae and Cho2004), which includes 30 items. Scores on this scale range from 0 to 30, and higher scores indicate stronger depressive symptoms. A score of ≥ 18 on the GDS is considered to indicate depression (Bae and Cho, Reference Bae and Cho2004).
MRI acquisition
MRI scanning was performed using a 1.5-Tesla scanner (Signa Excite 11.0, GE Medical Systems, Milwaukee, WI, USA), including DTI and T1-weighted three-dimensional (3D) volumetric images. DTI was obtained using single-shot, spin-echo, echo-planar imaging: repetition time (TR) = 10,000 ms, echo time (TE) = 83.3 ms, 25 directions at b = 1,000 s/mm2 with one volume at b = 0 s/mm2, 4-mm slice thickness, 33 axial slices, acquisition matrix = 128 × 128, field of view (FOV) = 260 × 260 mm2, number of excitations (NEX) = 1. T1-weighted 3D volumetric brain MR images were acquired using spoiled gradient recalled echo sequence with TR/TE = 22/6 ms, 1.2-mm slice thickness with no gap, flip angle = 30°, FOV = 260 × 260 mm2, and NEX = 1.
DTI processing and analysis
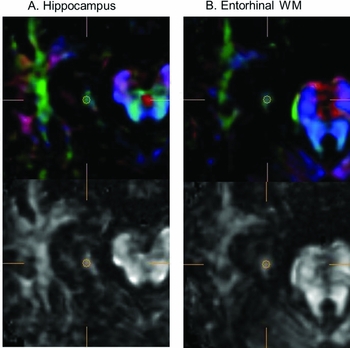
DTI data were processed using the diffusion tensor visualizer (dTVII) free software package (http://www.medimg.info.hiroshima-cu.ac.jp/dTV.II.15g/index.html) (Masutani et al., Reference Masutani, Aoki, Abe, Hayashi and Otomo2003). Fractional anisotropy (FA) and mean diffusivity (MD) values were measured using the region-of-interest (ROI) method in the bilateral hippocampi and entorhinal regions (Figure 1). Regarding FA and MD (i.e. the two most common DTI parameters), decreased FA and elevated MD are thought to reflect a loss of WM integrity including disruption of axonal structure or myelin loss in aging, MCI, and AD (Chua et al., Reference Chua, Wen, Slavin and Sachdev2008). Each ROI was a 3D voxel of interest with a size of 19 mm3. Spherical ROIs were drawn comparing the various images in various planes (coronal, axial, and sagittal planes) and based on the identification of WM on color-coded maps. The hippocampal ROIs were placed over the hippocampal bodies to exclude perihippocampal cerebrospinal fluid (CSF) spaces, using a previously described protocol (Hong et al., Reference Hong2013). The entorhinal ROI was placed over WM underlying the entorhinal cortex of the axial slice where the midbrain was visible, corresponding to the coronal slice of the midbrain level where the hippocampal body and entorhinal cortex appear together. Anatomical landmarks according to Bernasconi et al. (Reference Bernasconi, Bernasconi, Caramanos, Antel, Andermann and Arnold2003) were used for hippocampal and entorhinal ROIs. Illustrations of the hippocampal and entorhinal ROI are displayed in Figure 1.
Illustration of the region of interest (ROI) selection.

To determine DTI data reliability, two raters measured hippocampal FA and MD values on ten randomly selected participants (five individuals with SMI and five elderly controls), blinded to the diagnosis. Inter-rater reliabilities expressed as intraclass correlation coefficients (ICCs) were 0.92 for hippocampal FA and 0.89 for hippocampal MD, respectively. Each ROI was then manually drawn by one rater blinded to the clinical information. The FA and MD values for each ROI were measured three times, and the mean value was obtained. DTI measures for each hippocampal and entorhinal ROI were averaged across hemispheres. Intra-rater reliabilities expressed as ICCs for the hippocampal body and entorhinal WM ROI placement ranged from 0.76 to 0.93.
3D T1-weighted imaging processing and volumetric measures
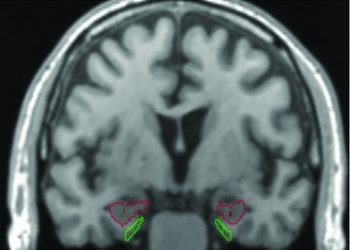
3D-MRI data were used for volumetric assessment. We measured the volumes of the bilateral hippocampi and entorhinal cortices in all participants. The analyze software package (ver. 10.0; Mayo Clinic Foundation, Rochester, MN, USA) was used for manual measurements of the volumes of the hippocampus and entorhinal cortex on each side. The DICOM files of the MRI data were converted to analyze files, which were reformatted to cubic volume (3D) with a resliced thickness of 0.97 mm. The anatomical boundaries of the hippocampus and entorhinal cortex were based on the previously described methods (Pruessner et al., Reference Pruessner2000; Pruessner et al., Reference Pruessner2002). Figure 2 shows sample tracings of the hippocampal and entorhinal ROIs. Hippocampal and entorhinal cortical volumes were normalized to total intracranial volume (TIV) to account for individual differences in brain size. Volumetric measures for each hippocampal and entorhinal ROI were averaged across hemispheres. The hippocampus and entorhinal cortex were manually drawn by one rater blinded to the clinical information. The intra-rater reliabilities expressed as ICCs for hippocampal and entorhinal cortical volumes exceeded 0.93.
Example of regions of interest illustrating the boundaries of the hippocampus (red) and entorhinal cortex (green) in the coronal plane.

Statistical analyses
Group differences were assessed with two-sample t-tests (or Mann-Whitney U tests) for continuous variables and χ2 tests for categorical variables. Analysis of covariance was conducted to compare brain measures between two groups while controlling for demographic variables (i.e. age, education, and sex). Spearman's correlations were calculated between brain measures and cognitive measures. The power of DTI and entorhinal cortical volume measures for correctly classifying individuals with SMI and elderly controls were estimated based on logistic regressions, and the sensitivity and specificity of the classifications were expressed in a receiver operator characteristics (ROC) analysis as the area under the curve (AUC). The AUC results were interpreted that an AUC value greater than 0.9 has high accuracy, whereas 0.7–0.9 indicates moderate accuracy, 0.5–0.7 low accuracy, and 0.5 a chance result (Swets, Reference Swets1988). Statistics were calculated using JMP pro 11.0.0 (SAS Inc., Cary, NC) and the SPSS software package version 19.0 (SPSS Inc., Chicago, IL, USA). ROC analysis was performed using R software (version 3.2.3) (Robin et al., Reference Robin2011). Values of p < 0.05 were considered significant.
Results
The demographic and clinical characteristics of participants are presented in Table 1. There were no significant differences in age, education, and sex between individuals with SMI and elderly controls. However, individuals with SMI had significantly lower K-MMSE scores (U = 149.5, p = 0.03, effect size r = 0.33) and higher CDR sum of boxes (U = 67.5, p < 0.001, r = 0.76) compared with elderly controls. Neuropsychological tests revealed that the SMI group had lower verbal memory scores (Seoul Verbal Learning Test delayed recall) than elderly controls (18 SMI patients vs. eight controls due to missing data; U = 13.0, p = 0.001, r = 0.64; Table 1). Unfortunately, neuropsychological data from 19 participants in the control group were missing, so this finding remains to be inconclusive. Although individuals with SMI performed numerically poorer on the verbal memory measure, verbal memory performance of the SMI group is still considered within the normal range.
The SMI group had lower entorhinal cortical volumes than the control group (p < 0.001, Cohen's d = 1.45). However, there was no difference in hippocampal volume between the two groups. DTI measures of the hippocampal body revealed significantly lower FA (p < 0.001, d = 1.5) and higher MD values (p = 0.001, d = 0.92) in the SMI group compared with the control group. In addition, the SMI group exhibited significantly lower FA (p = 0.02, d = 0.85) and higher MD values (p =0.01, d = 0.83) in entorhinal WM compared with the control group (Table 1). The results for hippocampal (t = 0.88, p = 0.39) and entorhinal cortical volumes (t = 5.07, p < 0.001) and FA values in hippocampal body (t = 4.96, p < 0.001) and entorhinal WM (t = 2.14, p = 0.04) between two groups remained unchanged after adjustments for age, education, and sex. There were no significant groups by age, education, and sex's interactions on MRI measures.
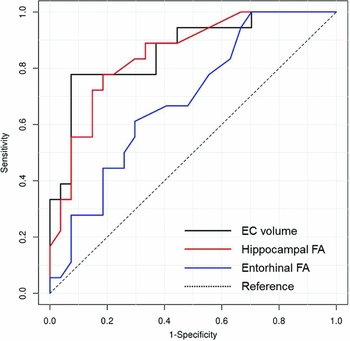
We performed ROC analyses using brain measures that were significantly different between SMI and elderly controls (i.e. entorhinal cortex volume and DTI indices (FA) of hippocampal and entorhinal ROIs). The corresponding ROC curves of entorhinal cortical volume (AUC 0.86, 95% confidence interval (CI) 0.75–0.98) and hippocampal (AUC 0.85, 95% CI 0.74–0.96) and entorhinal (AUC 0.69, 95% CI 0.53–0.84) FA for group classification are shown in Figure 3. Entorhinal cortical volume and hippocampal body FA exhibited appropriate AUC values for group classification and were used to correctly classify SMI and controls. The results of a logistic regression analysis and an ROC analysis for these parameters are summarized in Table 2. Entorhinal cortical volume alone separated reliably SMI individuals from controls (p < 0.001), yielding 77.8% sensitivity and 92.6% specificity with a cut-off value of 0.50. In addition, hippocampal body FA alone separated reliably SMI patients from controls (p < 0.001), yielding 66.7% sensitivity, and 85.2% specificity with a cut-off value of 0.13. Classification accuracy of SMI and control participants based on entorhinal cortical volume (p < 0.001) or hippocampal body FA (p = 0.001) alone remained significant after adjustments for age, education, and sex. Combining entorhinal cortical volume and hippocampal body FA improved classification, increasing accuracy to 91.10% and sensitivity to 88.90% with an increased AUC of 0.959 (Table 2).
Receiver-operating characteristic curves of classifications between SMI and controls for EC volume and hippocampal and entorhinal FA. SMI = subjective memory impairment; EC = entorhinal cortex; FA = fractional anisotropy.

Group classificationFootnote a by entorhinal cortical volume and hippocampal body FA

a Subjective memory impairment versus elderly control groups.
b From logistic regression.
FA = fractional anisotropy; EC = entorhinal cortex; AUC = area under a receiver operating characteristic curve.
For cognitive performance, neither entorhinal cortical volume nor hippocampal body FA was associated with K-MMSE scores or cognitive measures in SMI participants.
Discussion
In the present study, GM volumes and DTI measures of entorhinal and hippocampal regions were examined in SMI and control groups. The results revealed lower entorhinal cortical volumes in individuals with SMI, without hippocampal volumetric changes. In addition, we found DTI changes (lower FA and higher MD values compared with controls) in the hippocampal body and entorhinal WM in individuals with SMI. These findings suggest that entorhinal regions exhibit macrostructural and microstructural changes in people with SMI, whereas the hippocampus exhibits only microstructural alterations. Among the various measures of MTL structures we tested, entorhinal cortical volume and hippocampal body FA were superior for distinguishing SMI and control participants. Moreover, combining entorhinal cortical volume and hippocampal body FA improved classification accuracy for group comparisons.
In the current study, GM volumes measured with structural MRI revealed reduced entorhinal cortical volumes in SMI individuals, consistent with prior reports (Jessen et al., Reference Jessen2006; Striepens et al., Reference Striepens2010). In contrast, we found no differences in hippocampal volumes between SMI and control groups, in accord with several previous studies (Jessen et al., Reference Jessen2006; Saykin et al., Reference Saykin2006; Selnes et al., Reference Selnes2012; Schultz et al., Reference Schultz2015). However, some previous studies of hippocampal volume in SMI have revealed conflicting results (van der Flier et al., Reference van der Flier2004; Saykin et al., Reference Saykin2006; Striepens et al., Reference Striepens2010). These discrepancies in the literature may relate to the different study populations and methodologies.
Few previous studies have used DTI measures to evaluate microstructural changes in individuals with SMI (Selnes et al., Reference Selnes2012; Wang et al., Reference Wang2012). One DTI study of MTL structures reported that a cognitive complaint group demonstrated intermediate DTI diffusivity values in parahippocampal WM falling between an MCI group and a healthy control group (Wang et al., Reference Wang2012). Another study demonstrated that subjective cognitive impairment was associated with DTI changes in the parahippocampal region, but no change in the entorhinal region (Selnes et al., Reference Selnes2012). The current results revealed DTI changes in hippocampal and entorhinal regions in individuals with SMI. These inconsistencies may be related to the methodological variability between studies, different populations, and variability in ROI definitions. Given the small number of DTI studies in SMI individuals, it would be helpful for future studies to provide further validation with larger populations.
The current study examined MTL structures in individuals with SMI, finding entorhinal cortical volume changes without hippocampal volume changes, as well as detecting microstructural alterations in both hippocampal and entorhinal regions. This discrepancy in the hippocampal region may be related to the characteristic pattern of neurofibrillary pathology of AD, in which the transentorhinal stages I–II (the earliest stage of AD) are characterized by more involvement in the transentorhinal and entorhinal regions, with only mild effects in the hippocampus (Braak and Braak, Reference Braak and Braak1991). There is an increasing interest in the identification of patients in the earliest stages of AD to enable effective early intervention. Structural brain MRI and DTI may be useful in clinical practice for detection of patients with an increased risk of developing clinical AD. The current results revealed DTI changes in the hippocampal region in SMI patients, but no macrostructual volume changes. In addition, among brain measures in MTL structures, entorhinal cortical volume and hippocampal body FA were found to have relatively good classification accuracy, which was further improved by combining both entorhinal cortical volume and hippocampal body FA. The current results thus suggest that combined volumetric and DTI assessment may be helpful for detecting patients at risk and characterizing microstructural alterations of MTL structures in people with SMI. However, it is inconclusive with this study about how these MRI measures relate to cognitive decline in SMI patients. There have been few studies about relationships between MRI measures and cognitive decline in individuals with SMI. It has been reported that AD-like GM pattern in individuals with SMI or DTI measures in SMI and MCI patients was associated with cognitive decline (Selnes et al., Reference Selnes2013; Peter et al., Reference Peter2014). More longitudinal studies are needed in a larger population to determine how baseline MRI measures relate to future cognitive decline in SMI.
In addition, regarding the DTI indices of MTL structures examined in current study, hippocampal body FA showed superior classification accuracy, compared with entorhinal WM FA, despite the absence of significant hippocampal volume differences between individuals with SMI and elderly controls. This finding may be related to the complex architecture of the entorhinal WM ROI. The entorhinal WM region includes the perforant pathway, which relays multimodal sensory information from the entorhinal cortex to the hippomcampus (Van Hoesen, Reference Van Hoesen1995). The perforant pathway is the largest cortical association pathway in the temporal lobe, and partial volume effects resulting from crossing fibers are thought to be common (Solodkin et al., Reference Solodkin2013). Therefore, DTI metrics may not be able to capture DTI changes in the entorhinal WM ROI, due to the complex composition of the entorhinal WM region compared with the hippocampal region.
The current study has several limitations that should be considered. This was a cross-sectional study with a relatively small sample size. In addition, SMI is a heterogeneous condition observed in a wide range of situations, from normal aging to AD-spectrum disorder (Jessen et al., Reference Jessen2014). The lack of biomarker information for the underlying pathology of SMI, such as CSF or amyloid positron emission tomography biomarkers, represents another limitation of the current study. In future, larger, longitudinal studies with biomarkers of AD-type pathology will be important to confirm these results and determine their long-term clinical significance.
Conclusions
The current study compared GM volume and DTI measures in hippocampal and entorhinal regions between individuals with SMI and controls. The results indicated that individuals with SMI exhibited both macrostructural and microstructural changes in entorhinal regions, whereas the hippocampus exhibited microstructural alterations without macrostructural changes. These findings suggest that in addition to volumetric assessment, the evaluation of DTI measures may be useful for characterizing microstructural alterations in the MTL structures of individuals with SMI.
Acknowledgments
The authors wish to acknowledge the financial support by a grant of the Bukwang Pharmaceutical Co., Ltd. and the Korea Healthcare Technology R and D Project, Ministry of Health and Welfare, Republic of Korea (HI10C2020).
Conflict of interest
None.
Description of authors’ roles
D. W. Yang designed the study, contributed to the concept of the paper, and obtained funding. J. H. Cho performed manual volumetry analysis. E. Y. Lim conducted DTI analysis. S. Y. Ryu was responsible for statistical analyses, performed interpretation of data, and wrote the first draft of the paper. S. Y. Ryu, E. Y. Lim, S. Na, Y. S. Shim, J. H. Cho, B. Yoon, Y. J. Hong, and D. W. Yang contributed to revising the manuscript for content and approved the final version.