Introduction
The Norwegian Fjord horse originated in Norway and is noted for its unique and uniform appearance, resulting from selective breeding and an emphasis on genetic purity (Prichard, Reference Prichard2010). Norwegian Fjords were originally used for agricultural purposes and have more recently become popular as sport or leisure mounts. The Norwegian Fjord was introduced in North America in 1900; however, most foundation stock was imported in the 1950s and 1960s. In 1983, the Norwegian Fjord Horse Registry (NFHR) was formed to oversee registration, breeding and promotion of Fjords in North America (Prichard, Reference Prichard2010). The formation of this registry has also facilitated increased importation, implementation of reproductive techniques such as artificial insemination, and the advent of formal evaluation processes for breeding animals.
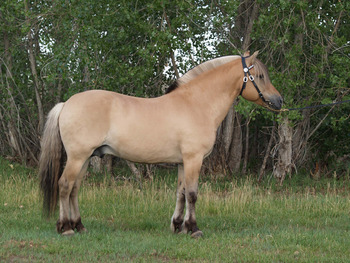
Norwegian Fjords are marked by their consistent coat colour and similar morphological type and conformation as shown in Figure 1 (Bowling and Ruvinsky, Reference Bowling, Ruvinsky, Bowling and Ruvinsky2000). Because the goal of the registry is to maintain this phenotype, strict rules are enforced to ensure genetic purity by prohibiting crossbreeding with animals outside the breed (Norwegian Fjord Horse Registry, 2010). However, because the Norwegian Fjord population in North America is small, continued selection from such a narrow gene pool could result in high inbreeding levels and reduced genetic variability, especially if less related bloodlines are not regularly introduced to the population (Falconer and Mackay, Reference Falconer and Mackay1996).
A stallion from the Fleitner N-97 line exhibiting the desired type and conformation of Norwegian Fjord horses. Photo by Sandy North, used with permission.

An inbreeding coefficient of 3.0 percent for Norwegian Fjord horses was reported using microsatellite data in the Norwegian population (Bjørnstad, Gunby and Røed, Reference Bjørnstad, Gunby and Røed2000). However, the level of inbreeding and genetic variability for the Norwegian Fjord population in North America is unknown. This information would aid the registry's assessment of current breeding practices to sufficiently avoid deleterious effects of inbreeding and reduced genetic variability. Therefore, the objective of this study was to evaluate current levels and historic trends of inbreeding and evaluate the number and contributions of founders and ancestors for the Norwegian Fjord Horse population in North America.
Materials and methods
Data used in this study were provided by the Norwegian Fjord Horse Registry (Webster, NY) and included animal, sire, dam, sex and year of birth. Horses of the current generation (born 2000–2009) were defined as the reference population (n = 1 659), and pedigrees of these animals were traced back to earliest known ancestors. The total pedigree dataset consisted of 6 406 animals, with the earliest recorded ancestor born in 1874. Population summary statistics were calculated using PROC FREQ of SAS 9.2 (SAS Inst., Cary, NC). Pedigree completeness, number of generation intervals, inbreeding coefficients, and effective numbers of founders, ancestors and founder genomes were calculated using PEDIG software (Boichard, Reference Boichard2002).
Pedigree completeness was evaluated by determining percentage of ancestors known in each generation in both reference and total populations. Number of equivalent complete generations (g e) was calculated as

where n i is the number of known ancestors in generation i and g is the number of known generations for each individual (Boichard, Maignel and Verrier, Reference Boichard, Maignel and Verrier1997). Generation intervals were calculated for stallion-daughter, stallion-son, mare-daughter and mare-son pathways, as well as the average generation interval over the four pathways.
Level of inbreeding is measured using an inbreeding coefficient (F), which is the probability that an individual carries two genes identical by descent as a result of matings between related individuals (Falconer and Mackay, Reference Falconer and Mackay1996). F was calculated using Van Raden's (Reference Van Raden1992) methods considering five and all available generations in the pedigree. Analysing only five generations of pedigree information emphasizes effects of recent versus historic inbreeding as well as evaluating the pedigree before completeness begins to decline. Effective population size (N e) was calculated using the change in inbreeding (ΔF) between the reference population and the parents of those individuals (N e = [1/2]ΔF) (Falconer and Mackay, Reference Falconer and Mackay1996).
Founder animals were defined as ancestors with two unknown parents. If an animal had one unknown parent, that parent was also considered a founder. Total number of founders may not accurately describe the genetic diversity of a population because it does not account for uneven contributions of particular founders. Therefore, Lacy (1989) introduced the concept of effective number of founders (f e) to highlight whether certain founders contributed more to the gene pool than others. Effective number of founders is defined as the number of equally contributing founders expected to produce the same genetic diversity as the population under study. Effective number of founders was calculated as
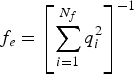
where N f is the number of founders and q i is the genetic contribution of the ith founder.
While f e accounts for the contribution of the founder population, it ignores loss of genetic diversity that occurs after the foundation of a population and thus may overestimate genetic diversity. Therefore, the calculation of effective number of ancestors (f a) was proposed by Boichard, Maignel and Verrier (Reference Boichard, Maignel and Verrier1997) to measure loss in diversity because of the foundation population. Effective number of ancestors is defined as the minimum number of ancestors explaining the complete genetic diversity of the reference population. Based on the 100 most influential ancestors, it is calculated as
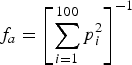
where p i is the marginal genetic contribution of the ith ancestor. In an iterative process, the ancestor with the highest contribution is chosen and contributions of all other animals are calculated relative to the contribution of the chosen ancestor. Then the ancestor with the next highest contribution is chosen, and this process continues. Marginal contributions account for the contributions of animals already considered in the recursive process and eliminate redundancies in identification of influential ancestors (Boichard, Maignel and Verrier, Reference Boichard, Maignel and Verrier1997). The ratio of f e/f a indicates occurrence of bottleneck events in the history of the breed.
Effective number of founders and ancestors still may not entirely demonstrate the effect of random genetic drift in a population. Therefore, Lacy (Reference Lacy1989) proposed calculation of effective number of founder genomes (f g), or the number of founder genomes present in the current population. This parameter accounts for both unequal use of founders and loss of alleles because of bottlenecks and random segregation. The effective number of founder genomes is calculated as
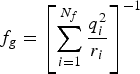
where the genetic contribution of the ith founder (q i) is considered relative to the proportion of the founder's genes that remain in the reference population (r i). Contributions of founder sire lines were determined by tracing the paternal lineages of all animals born at ten-year intervals from 1939 to 2009.
Results
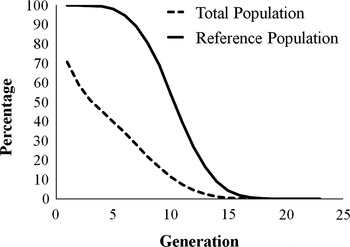
When analysing the total population, pedigree completeness is approximately 70 percent in the first generation and then steadily decreases (Figure 2). For the reference population, the completeness level is close to 100 percent and does not begin to decline until generation 6. The average complete generation equivalents were 3.9 for the total population and 9.8 for the reference population. Because inbreeding coefficients and other measures of genetic variability are dependent on pedigree depth, only the reference population was used to calculate these parameters. The average generation interval was not significantly different among the four analysed pathways, ranging from 9.0 to 9.3, with a mean of 9.1.
Average percent of pedigree completeness for the total and reference populations.

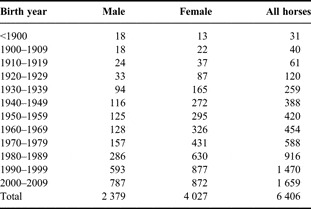
Population size increased per year of birth in the 1940s and again in the 1980s (Table 1). While there are similar numbers for each sex in the reference population, previous years show a higher number of female animals.
Number of Norwegian Fjord Horses in dataset by year of birth and sex.1

1 Reference population.
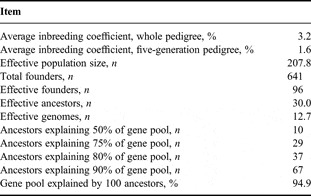
Average inbreeding coefficients were 3.2 and 1.6 percent considering all available and five generations, respectively (Table 2). The average inbreeding coefficient for the reference population was 4.3 percent. Non-zero inbreeding coefficients were found for 78.3 percent of the animals, and average inbreeding coefficient of those individuals was 4.1 percent. The maximum inbreeding coefficient was 38.4 percent, but few individuals demonstrated very high levels of inbreeding. The majority (77.2 percent) of individuals had inbreeding coefficients less than or equal to 15 percent.
Summary of pedigree analysis of Norwegian Fjord Horse reference population.

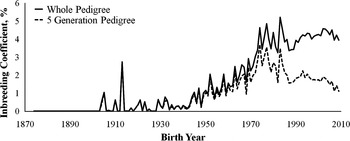
Figure 3 illustrates change in inbreeding by birth year for both sexes using either total known pedigree of the reference population or five-generation pedigrees. Inbreeding levels were close to 0 until around 1950, at which point they increased until the early 1980s, with the sharpest increase occurring between 1970 and 1980. After a drop from 1983 to 1997, level of inbreeding remained relatively constant until 2009. From around 1975 onward, inbreeding levels calculated using only a five-generation pedigree were lower than those calculated using the entire pedigree.
Average inbreeding coefficients by year of birth when tracing five generations or when using the entire available pedigree of the reference population.

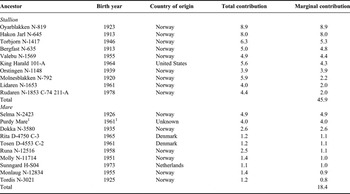
The effective population size was 207.8 for the reference population, and the total number of founders was 641 (Table 2). The ratio of effective number of founders to effective number of ancestors, used to detect bottlenecks or other events causing loss of genetic diversity, was 3.2. The 100 most influential ancestors explained 94.9 percent of the gene pool, but only 10 ancestors were required to explain 50 percent of the gene pool. The effective number of founder genomes remaining in the population was small, less than half the effective number of ancestors and only 13 percent of the effective number of founders. Table 3 lists the ten most influential male and female ancestors along with their country of origin and respective marginal and total contributions to the reference population.
Total and marginal genetic contribution (percent) for the ten male and female ancestors with largest contributions to Norwegian Fjord Horse reference population.

1Accuracy of progeny reporting and year of birth for this individual is uncertain, see discussion for more detail.
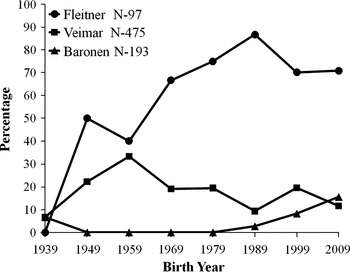
Nineteen terminal sires were found by tracing paternal lineages, however only three sires are responsible for about 98 percent of all current paternal lineages (Figure 4). Fleitner N-97 is responsible for 70.9 percent of paternal lineages for horses born in 2009. Across all studied birth years, 69.2 percent of individuals trace to the founder stallion Fleitner N-97, 15.3 percent to Veimar N-475 and 7.0 percent to Baronen N-193. All other terminal sires were responsible for less than 1 percent of paternal lineages.
Contributions of male founders to sire lines found by tracing paternal lineages of the entire population at ten-year intervals.

Discussion
The change in population demographics over time highlights some of the known history of Norwegian Fjord horses in North America. Numbers were low and then increased starting around the 1940s. Most foundation breeding stock were imported in the 1950s and 1960s, and many of these horses were potentially born in the 1940s. Additionally, the increase in the 1980s coincides with importation of 40 young horses from Norway to North America in 1988, referred to as “The Big Lift” (Prichard, Reference Prichard2010). These horses were selected to augment bloodlines in the current gene pool. Further increase in numbers can be attributed to foundation of the Norwegian Fjord Horse Registry and more intensive breed promotion along with a general increase in importation. It is important to note that because the dataset was formed by tracing ancestors of the reference population, only breeding animals are included. Therefore, unequal male-to-female ratios are likely owing to individual stallions covering multiple mares. Also, if non-breeding males were included, ratios should be closer to unity.
These same historical events may also explain changes in inbreeding levels. Mating among related members of foundation stock imported in the 1950s and 1960s resulted in the sharp increase in inbreeding coefficients for horses born between 1970 and 1980. Introgression of breeding stock in the late 1980s allowed inbreeding coefficients to decline. Additionally, the registry's 1986 rule prohibiting matings between parent-offspring, full-sibs and half-sibs could account for the recent drop and stabilization in inbreeding levels (Norwegian Fjord Horse Registry, 2010). Lower inbreeding coefficients based on five-generation also provide support for this hypothesis. Using five-generation pedigrees highlights recent inbreeding levels, and inbreeding coefficients from five-generation pedigrees are much lower, implying historic inbreeding was more substantial.
Heavy use of imported horses in breeding is also evident in the most influential ancestors shown in Table 3. Of the top ten male and female ancestors, only the Purdy Mare has unknown parents and could be considered a founder. However, this mare may not be a single individual but instead originates from a group of mares belonging to a single owner, and many of his breeding records were lost. Therefore her pedigree is unclear. Most major ancestors were born after 1940 and were likely part of the stock imported in the 1950s and 1960s. All but one sire originated in Norway, while there were two Danish and one Dutch mare. Currently, no North American born horse has provided considerable influence to the gene pool. Only 1 North American born horse ranks in the top 10 ancestors (King Harald) and 4 others are present in the top 100, each with less than 1 percent marginal contribution. This is not particularly surprising because the breed is relatively young in North America and importation remains fairly common.
Pedigree depth and completeness can affect inbreeding coefficients as increased depth will most likely increase inbreeding coefficients by identifying common ancestors further back in the pedigree (MacCluer et al., Reference MacCluer, Boyce, Dyke, Weitkamp, Pfenning and Parsons1983). In this study, pedigree depth and completeness was similar to that found in other populations (Valera et al., Reference Valera, Molina, Gutiérrez, Gómez and Goyache2005; Hamann and Distl, Reference Hamann and Distl2008). Although pedigree depth (measured by g e) was less than that of Lipizzan horses (15.2; Zechner et al., Reference Zechner, Sölkner, Bodo, Druml, Baumung, Achmann, Marti, Habe and Brem2002), it was higher than several other studies, including Spanish Arabs (2.97; Cervantes et al., Reference Cervantes, Molina, Goyache, Gutiérrez and Valera2008) and Asturcón ponies (5.7; Royo et al., Reference Royo, Álvarez, Gutiérrez, Fernández and Goyache2007). Therefore, pedigree depth should be sufficient to accurately calculate inbreeding in this population. Generation interval calculated here was also similar, although slightly shorter, than that reported in other breeds (Moreaux et al., 1996; Sevinga et al., Reference Sevinga, Vrijenhoek, Hesselink, Barkema and Groen2004; Hamann and Distl, Reference Hamann and Distl2008). Populations with longer generation intervals generally have extensive evaluation procedures that have only recently been introduced in North America for the Norwegian Fjord.
Bjørnstad, Gunby and Røed (Reference Bjørnstad, Gunby and Røed2000) found an inbreeding coefficient of 3.0 percent in Norwegian Fjords born in Norway using microsatellite data. The inbreeding coefficient found here indicates that the population in North America has not become substantially more inbred than the native population. Overall, the inbreeding coefficient is lower than what is reported in other horse populations. Inbreeding coefficients closest to those reported here are 3.08 percent for Arabians raised in France (Moreaux et al., 1996), 4.7 percent for the Asturcón pony of Spain (Royo et al., Reference Royo, Álvarez, Gutiérrez, Fernández and Goyache2007), 3.06–5.31 percent for Polish Arabians (Głażewska and Jezierski, Reference Głażewska and Jezierski2004) and 5.01 percent for Noriker draught horses (Druml, Baumung and Sölkner, Reference Druml, Baumung and Sölkner2009). All of these populations are relatively small and effectively closed to crossbreeding. However, many other populations prohibiting crossbreeding reported higher inbreeding coefficients ranging from 6.0 to 15.6 percent (Mahon and Cunningham, Reference Mahon and Cunningham1982; MacCluer et al., Reference MacCluer, Boyce, Dyke, Weitkamp, Pfenning and Parsons1983; Cunningham et al., Reference Cunningham, Dooley, Splan and Bradley2001; Zechner et al., Reference Zechner, Sölkner, Bodo, Druml, Baumung, Achmann, Marti, Habe and Brem2002; Sevinga et al., Reference Sevinga, Vrijenhoek, Hesselink, Barkema and Groen2004; Valera et al., Reference Valera, Molina, Gutiérrez, Gómez and Goyache2005; Poncet et al., Reference Poncet, Pfister, Muntwyler, Glowatzki-Mullis and Gaillard2006; Cervantes et al., Reference Cervantes, Molina, Goyache, Gutiérrez and Valera2008). Many of these populations also had smaller effective population sizes and increased pedigree depth. Populations with lower inbreeding coefficients (0.7–1.86 percent) represent larger populations and many have a more open policy concerning crossbreeding (Moreaux et al., 1996; Hamann and Distl, Reference Hamann and Distl2008). Many also had slightly longer generation intervals.
The discrepancy between total and effective number of founders indicates that there was an uneven representation of breeding animals in the formation of this breed. However, effective number of founders is moderate compared with other populations reported in the literature, which range from 18.1 to 333 (Moreaux et al., 1996; Cunningham et al., Reference Cunningham, Dooley, Splan and Bradley2001; Zechner et al., Reference Zechner, Sölkner, Bodo, Druml, Baumung, Achmann, Marti, Habe and Brem2002; Valera et al., Reference Valera, Molina, Gutiérrez, Gómez and Goyache2005; Ducro et al., Reference Ducro, Bovenhuis, Neuteboom and Hellinga2006; Royo et al., Reference Royo, Álvarez, Gutiérrez, Fernández and Goyache2007; Cervantes et al., Reference Cervantes, Molina, Goyache, Gutiérrez and Valera2008; Hamann and Distl, Reference Hamann and Distl2008). Norwegian Fjord horses were most similar to small populations closed to crossbreeding such as Trotteur Français (70; Moreaux et al., 1996), Franches-Montagnes (68.7–75.7; Poncet et al., Reference Poncet, Pfister, Muntwyler, Glowatzki-Mullis and Gaillard2006), and Noriker draught horses (117.2; Druml, Baumung and Sölkner, Reference Druml, Baumung and Sölkner2009).
Effective number of ancestors was fairly high and similar to Noriker draught horses (29.3; Druml, Baumung and Sölkner, Reference Druml, Baumung and Sölkner2009). Only Spanish Arabs and Hanoverians reported higher effective number of ancestors at 39.5 and 77.73, respectively (Cervantes et al., Reference Cervantes, Molina, Goyache, Gutiérrez and Valera2008; Hamann and Distl, Reference Hamann and Distl2008). However, the ratio of f e/f a was quite high at 3.21, indicating disproportionate use of some individuals resulting in random loss of genetic diversity. Additionally, a majority of influential ancestors seem to have been part of initial importations in the 1950s and 1960s. This importation could have created a bottleneck event and explains some of the reduction in genetic diversity. This ratio was similar or slightly smaller than that found in Hanoverians (3.15; Hamann and Distl, Reference Hamann and Distl2008), Franches-Montagnes (3.61–3.98; Poncet et al., Reference Poncet, Pfister, Muntwyler, Glowatzki-Mullis and Gaillard2006) and Noriker draught horses (4.0; Druml, Baumung and Sölkner, Reference Druml, Baumung and Sölkner2009). Other breed populations reported lower ratios, implying that loss of diversity because of uneven use of sires is more extreme in North American Norwegian Fjords. The difference between effective number of founder genomes and effective number of ancestors was also quite large, further indicating random loss of genetic diversity.
The small number of sire lines also shows uneven contributions of founder sires and potential for loss of genetic diversity. Fleitner N-97's sire line currently provides the highest contribution and is also the terminal sire for nine of the ten most influential male ancestors through his son Njal N-166. However, although Veimar N-475's sire line is declining, he is the terminal sire for the top male ancestor. Baronen N-193's sire line was non-existent prior to 1989 but has been increasing in recent generations. Typically a small number sire lines are responsible for a majority of paternal lineages in horse populations, and in many populations a single sire line becomes dominant. Populations with fewer sire lines tended to have higher levels of inbreeding and lower effective numbers of founders and ancestors (Cunningham et al., Reference Cunningham, Dooley, Splan and Bradley2001; Royo et al., Reference Royo, Álvarez, Gutiérrez, Fernández and Goyache2007; Cervantes et al., Reference Cervantes, Molina, Goyache, Gutiérrez and Valera2008). In the case of Thoroughbreds, which have one sire line responsible for 95 percent of modern horses, the average inbreeding coefficient was one of the highest reported in the literature for horse breeds (Cunningham et al., Reference Cunningham, Dooley, Splan and Bradley2001).
Conclusion
This study indicates that recent breeding strategies employed by the NFHR for the North American population of Norwegian Fjord horses have prevented further increase in inbreeding levels. If these policies continue to be enforced, inbreeding should remain constant or could decrease. However, low effective number of founders and ancestors and the high ratio of these two parameters show that this breed has undergone random loss of genetic diversity, most likely owing to uneven use of particular breeding individuals and overall small population size. Because of this loss, the gene pool for this breed is relatively small and attempting to select unrelated individuals will become increasingly difficult. Also, many alleles present in the founders of the breed may already permanently lost. Therefore, even though inbreeding is not extreme and no deleterious effects have been reported, further reduction of genetic variability is still a concern. The registry may consider utilizing support provided by organizations such as the American Livestock Breeds Conservancy to educate breeders in methods to minimize inbreeding and increase genetic diversity in relatively rare breeds (American Livestock Breeds Conservancy, 2010). Although Norwegian Fjord horses in North America show less loss than other breeds of small population size and closed studbooks, further loss of genetic diversity should be prevented. Breeders should be encouraged to utilize more diverse bloodlines to broaden the genetic base of this population.
Acknowledgements
Authors would like to acknowledge the Norwegian Fjord Horse Registry for providing data and supporting the research.