


Particularistic spending, a large literature argues, cultivates a personal vote for incumbents (Cain, Ferejohn, and Fiorina Reference Cassino, Lodge, Neuman, Marcus, Crigler and MacKuen1987; Ferejohn Reference Ferejohn1974; Lazarus and Reiley Reference Lazarus and Reiley2010; Levitt and Snyder Reference Levitt and Snyder1997; Mayhew Reference Mayhew1974). To build this support, legislators are assumed to direct projects and programs to their districts. Constituents, in turn, are thought to reward their legislator for the level of federal spending in the district (Levitt and Snyder Reference Levitt and Snyder1997; Strömberg Reference Strömberg2004) or the number of new projects (Bickers and Stein Reference Bickers and Stein1996; Stein and Bickers Reference Stein and Bickers1994).
The extensive study of particularistic spending, however, provides little evidence of how money spent in the district leads to increased support for incumbents. While weak correlations are often observed between particularistic spending and votes, there are few explanations of how constituents connect expenditures to their representatives. Instead, existing formal and empirical models assume that constituents are able to tabulate spending in the district and allocate appropriate credit to incumbents. But this assumption is problematic as constituents know too little about federal spending (Bickers and Stein Reference Bickers and Stein1996; Stein and Bickers Reference Stein and Bickers1994). Unless a constituent is a direct beneficiary of a project, she may fail to notice the spending in the district. And even when constituents are direct beneficiaries, they may fail to identify an expenditure as a government program (Mettler Reference Mettler2011) or fail to attribute the spending to representatives in Washington (Stein and Bickers Reference Stein and Bickers1994). On their own, therefore, it is unclear how constituents allocate credit for expenditures in the district.
We offer an explanation of how this credit allocation occurs: legislators’ statements to constituents. Using extensive observational and experimental evidence we demonstrate how legislators’ credit claiming messages—and not just expenditures in the district—affect constituents’ credit allocation and the cultivation of a personal vote for incumbents. Legislators use credit claiming messages to influence what expenditures they receive credit for and to affect how closely they are associated with spending in the district. Constituents allocate credit in response to credit claiming messages, but in ways contrary to expectations from previous studies. Credit claiming messages are more effective at cultivating support than other nonpartisan messages. But constituent credit allocation depends on more than the amount claimed. Constituents are more responsive to the number of messages received, rather than the amount claimed. Together, our evidence shows that legislators’ credit claiming directly causes constituent credit allocation.
To characterize how legislators claim credit for expenditures in the district, we use a new data set of over 170,000 House press releases issued between 2005 and 2010. We show that legislators use credit claiming messages to associate themselves with spending from many different sources (Bickers and Stein Reference Bickers and Stein1996; Evans et al. Reference Buhrmester, Kwang and Gosling2007; Stein and Bickers Reference Stein and Bickers1994). Earmarked funds are regularly announced, but they comprise only one component of a broader set of spending that legislators use to cultivate support. Legislators from both parties regularly claim credit for expenditures made from bureaucratic agencies in the form of grants allocated to Congressional districts (Evans et al. Reference Buhrmester, Kwang and Gosling2007). And contrary to implicit assumptions in previous studies, we show that there is systematic variation across legislators in how often they claim credit for expenditures in the district.
We offer two experiments to show how credit claiming messages affect how constituents evaluate their legislators—demonstrating that the variation in repetition and content of messages from legislators has direct effects on constituents. Our first experiment shows that credit claiming messages do more than raise a legislator's visibility (Cain, Ferejohn, and Fiorina Reference Cassino, Lodge, Neuman, Marcus, Crigler and MacKuen1987). Credit claiming messages also create the impression that the legislator is able to deliver spending and projects to the district (Mayhew Reference Mayhew1974). The result: Claiming credit for money (allocated as earmarks and as grants) cultivates more support than other nonpartisan messages from legislators. Our second experiment demonstrates that constituent credit allocation depends on more than the amount claimed. We show that frequently claiming credit for small amounts of money can have a larger effect on constituent support for House members than claiming credit for one, much larger, project. This result is particularly surprising given the discrepancy between the awards: The large awards claimed in our experiments are for nearly 100 times the total funds claimed in the frequent messages. The total dollar amount claimed does matter—our results show that constituents are moderately responsive to larger expenditures in credit claiming messages. But we show that frequent credit claiming messages—even with a smaller amount claimed—build greater support among constituents.
We then demonstrate that these results are externally valid using a robust within respondent design and observational data. We show that senators with a relatively higher propensity to claim credit receive higher approval ratings than the state's other senator—even though both senators represent a single district (the state) that receives the same number of new projects and levels of federal spending. And the effect of the credit claiming messages is largest among respondents most likely to consume the credit claiming efforts—constituents who report a high consumption of local news media.
Together, our results show how legislators’ credit claiming efforts affect their personal vote–a finding with implications for the study of U.S. Congressional elections, representation, and particularistic spending. Our findings demonstrate the need to revisit key assumptions that underlie formal and empirical models of distributive spending and its effect on elections. There, it has been assumed that expenditure levels in the district, or the number of new projects awarded, are equivalent to the credit constituents allocate for spending (e.g., Levitt and Snyder Reference Levitt and Snyder1997; Stein and Bickers Reference Stein and Bickers1994). Our results show that constituent credit allocation can be detached from levels of spending in the district. Constituents need only to encounter credit claiming messages from legislators to allocate credit, even if the expenditure is small. This offers one explanation for the often weak correlations observed between expenditures in the district and support for incumbents (Lazarus and Reiley Reference Lazarus and Reiley2010). Our findings also have implications for how the appropriations process works in Washington. If legislators know that constituents are responsive to repeated credit claiming activities, this may explain the proliferation of small grant programs across the government (Stein and Bickers Reference Stein and Bickers1997).Footnote 1
HOW CREDIT CLAIMING AFFECTS THE PERSONAL VOTE
Particularistic spending is a tool incumbent legislators and parties use to build electoral support in various political contexts (Cox and McCubbins Reference Crespin, Finocchiaro and Wanless1986; Dixit and Londregan Reference Downs1995; Fiorina Reference Fiorina1977; Levitt and Snyder Reference Levitt and Snyder1997). This is particularly true in U.S. Congressional elections, where a large literature identifies spending in the district as an effective and nonpartisan instrument for building support (Fiorina Reference Fiorina1977; Levitt and Snyder Reference Levitt and Snyder1997; Strömberg Reference Strömberg2004). The specific models vary across applications, but share the common assumption that constituents increase support for incumbents when greater resources are allocated to a district (Lazarus and Reiley Reference Lazarus and Reiley2010; Levitt and Snyder Reference Levitt and Snyder1997; Shepsle et al. Reference Shepsle2009) or when a larger number of projects are allocated to the district (Bickers and Stein Reference Bickers and Stein1996; Stein and Bickers Reference Stein and Bickers1994). The allocations—either the money spent or number of projects awarded—are assumed to have a direct effect on a constituent's likelihood of supporting an incumbent (Levitt and Snyder Reference Levitt and Snyder1997) or a direct effect on particularly attentive constituents (Stein and Bickers Reference Stein and Bickers1994). For this increase in support to occur, constituents must account for the spending in the district, associate that spending with the incumbent, and then reward the incumbent for the expenditure (Stein and Bickers Reference Stein and Bickers1994).
But just how constituents account for the flow of funds to the district is unclear. Indeed, this task is sometimes difficult for House members to perform, let alone constituents. Lee (Reference Lee2003) argues that this is difficult for House members “[b]ecause House districts are not administrative units in the federal system, systematic data on the amount of money they receive in federal grants is difficult to obtain” (Lee Reference Lee2003, 715). But even after a district receives funds, constituents struggle or are unable to recognize they or their communities are direct beneficiaries of financial support (Mettler Reference Mettler2011). The federal structure of U.S. government further complicates constituents’ ability to assign credit for money spent. Each district has multiple representatives (Bednar Reference Bednar2007; Chen Reference Cleveland2010; Shepsle et al. Reference Shepsle2009) and therefore multiple legislators could receive credit for an expenditure (Shepsle et al. Reference Shepsle2009). Some constituents are more politically knowledgeable, but even the most attentive constituents—those best equipped to credit legislators for expenditures in the district—may struggle to allocate credit for expenditures made in their district (Martin Reference Martin2003; Stein and Bickers Reference Stein and Bickers1994).
Constituents’ inability to account for spending in the district creates the need for legislators to use credit claiming messages to receive credit. Legislators construct messages that are designed to “generate a belief” that they were responsible for money directed to the district (Mayhew Reference Mayhew1974, 52–53). It is commonly—and implicitly—assumed that legislators’ use of credit claiming to induce credit allocation can safely be ignored. This is either due to an assumption that constituents are attentive to spending in the district or that all legislators dedicate essentially the same effort to claiming credit for expenditures in the district. But we argue that ignoring credit claiming messages obscures how particularistic spending builds support in the district—both because legislators are strategic and variant when claiming credit and because of how constituents respond to legislators’ credit claiming messages.
How Legislators Use Credit Claiming Messages
Legislators use credit claiming messages to strategically control what spending in the district they are associated with and how closely they are associated with that spending. In this section we outline two broad expectations about the strategic use of credit claiming messages. First, legislators are able to claim credit for much more than earmarked funds during the appropriations process (see also Evans et al. Reference Buhrmester, Kwang and Gosling2007 and Stein and Bickers Reference Stein and Bickers1994). The strategic incentives of legislators and bureaucrats and the limited knowledge of constituents results in House members claiming credit broadly—particularly for projects that bureaucratic agencies allocate. Second, not all legislators engage in the same amount of credit claiming. Because legislators are limited in the number of press releases they can issue and they may have differential incentives to engage in credit claiming, there will be systematic variation in legislators’ propensity to associate themselves with spending in the district.
When legislators use messages to “generate a belief” among constituents, they are able to claim credit broadly for expenditures—even if they exert little or indirect influence over the allocation of funds. Legislators recognize that constituents often fail to distinguish between expenditures allocated by executive agencies and allocations earmarked during the appropriations process (Evans et al. Reference Buhrmester, Kwang and Gosling2007). Strategic bureaucrats make it easier for legislators to claim credit for allocations made by their agency, creating opportunities for legislators to claim credit for money allocated (Arnold Reference Arnold1979; Ferejohn Reference Ferejohn1974), and presidents direct expenditures and new projects to Congressional districts represented by their co-partisans (Berry, Burden, and Howell Reference Berry, Burden and Howell2010). Accordingly, we expect that earmarked funds will comprise only one component of a much broader set of funds that are announced—legislators will regularly claim credit for money allocated through grants administered by bureaucratic agencies (Evans et al. Reference Buhrmester, Kwang and Gosling2007).
Legislators are able to announce a wide array of expenditures in the district on a regular basis, but we expect that not all legislators dedicate the same effort to credit claiming. This is because legislators have differential incentives to claim credit for money allocated to the district. These differential incentives matter because legislators are constrained in the amount of credit claiming they can do—limited staff resources, time, and interest from local media all constrain the total volume of messages that legislators can effectively broadcast to constituents (Cook Reference Cox and McCubbins1988). This constraint, coupled with legislators’ varying incentives, causes systematic variation in who claims credit for money allocated to a district. Electoral considerations are one source of the variance in legislators’ credit claiming efforts. Grimmer (n.d.) shows that marginal senators are more likely to claim credit for expenditures in their states than senators who are aligned with their constituents (see also Ashworth and Bueno de Mesquita Reference Ashworth and Bueno de Mesquita2006 and Wichowsky n.d.). Some representatives will have ideological objections to claiming credit for funds in the district (Sellers Reference Sellers1997; Yiannakis Reference Yiannakis1982), while other legislators sit on the Appropriations committee, which facilitates credit claiming opportunities (Evans Reference Evans, Bickers, Stein and Wrinkle1994). And still others occupy leadership positions that force attention away from the district and towards broad national policy. While a complete causal theory of credit claiming propensity is outside the scope of this paper, our expectation is that legislators’ electoral considerations, ideological position, and institutional access will covary with the space allocated to credit claiming. And therefore there will be systematic variation in how often legislators claim credit for expenditures.
How Constituents Respond to Credit Claiming Efforts
Legislators use credit claiming messages to affect how closely they are associated with spending in the district. We expect that these differences will matter when constituents allocate credit for expenditures, but most constituents do not deeply engage with these messages and lack the expertise, motivation, and resources to analyze the size of expenditures compared to relevant benchmarks. Instead, we suggest an online information processing model, wherein constituents keep a “running tally” of credit allocation that is updated unintentionally and spontaneously as they encounter credit claiming messages from their legislators (Cassino and Lodge Reference Chen2007).
If constituents update their impression of legislators using an online model, it follows that credit claiming affects constituents’ impressions of how effective a legislator is at delivering funds to the district (Lodge, Steenbergen, and Brau Reference Lodge, Steenbergen and Brau1995), and we argue that these impressions comprise a component of a legislator's personal vote (Cain, Ferejohn, and Fiorina Reference Cassino, Lodge, Neuman, Marcus, Crigler and MacKuen1987). Therefore credit claiming efforts should affect constituents, even if they fail to recall explicitly how much money legislators deliver to the district (Cacioppo and Petty Reference Cain, Ferejohn and Fiorina1989; Lodge, Steenbergen, and Brau Reference Lodge, Steenbergen and Brau1995). This differs sharply from the assumed effect of spending on constituents in theoretical and empirical models of credit allocation—the more legislators secure for the district, the more votes they receive. This assumes that constituents are accountants—carefully tabulating the total spent (Levitt and Snyder Reference Levitt and Snyder1997) or the total number of projects (Stein and Bickers Reference Stein and Bickers1994).
Rather, we expect that voters exert a minimal amount of effort when encountering messages and then update their impressions of legislators accordingly. Yet, constituents do not need to exert a great deal of effort to absorb a legislator's credit-claiming message—the updating process is not mediated by conscious information processing, but rather occurs spontaneously, often without conscious awareness, and generally without recollection of the specific details that led to the updated evaluation (for a review of this frequently replicated finding, see Lodge, Taber, and Verhulst Reference Lodge, Taber and Verhulst2011). We therefore expect that credit claiming messages will cultivate the impression that legislators deliver funds to the district. And because constituents tend to value these expenditures (Cain, Ferejohn, and Fiorina Reference Cassino, Lodge, Neuman, Marcus, Crigler and MacKuen1987), we expect that credit claiming messages will cultivate more support than other nonpartisan messages, such as advertising statements issued to raise a legislator's visibility (Mayhew Reference Mayhew1974).
Even though constituents are able to detect broad differences in credit claiming messages, we do not expect that constituents will be highly responsive to the amount claimed. First, detecting the total amount spent requires substantial cognitive effort, which constituents have little incentive to exert (Delli Carpini and Keeter Reference Dixit and Londregan1997; Downs Reference Erikson and Palfrey1957). And even if constituents are able to identify the total amount claimed in press releases, they usually lack the context to evaluate the spending (Delli Carpini and Keeter Reference Dixit and Londregan1997; Mettler Reference Mettler2011). Barring substantially greater knowledge, resources, and motivation to analyze federal spending data, it is difficult for most constituents to assess the relative size of an expenditure made in the district.
Rather than money determining the credit allocated to a legislator, we expect that the number of messages encountered will have a larger effect. Psychology experiments show that greater message frequency creates opportunities for constituents to repeatedly update their impression of their legislator (Lodge, Steenbergen, and Brau Reference Lodge, Steenbergen and Brau1995). But constituents’ cognitive engagement is already low and tends to drop when exposed to multiple messages (Cacioppo and Petty Reference Cain, Ferejohn and Fiorina1989), decreasing the likelihood that a constituent will retain the details of each message. These findings suggest that encountering a credit claiming message will cause constituents to update their impression of their legislator, but the amount claimed is unlikely to be retained. As a result, the frequency of message dominates the size of expenditure.
There are other reasons we might expect frequency to matter more than amount—repeated exposure to a legislator's name could simply introduce and better acquaint constituents with their representative. The “mere-repeated-exposure” literature (see Zajonc Reference Zajonc2001) suggests that merely exposing constituents to messages from their representative will cause more positive evaluations of the legislator. This is related to the effect of “visibility” in the personal vote literature (Cain, Ferejohn, and Fiorina Reference Cassino, Lodge, Neuman, Marcus, Crigler and MacKuen1987), which argues that increased name recognition and regular contact with constituents causes increased electoral support.
LEGISLATORS USE OF CREDIT CLAIMING MESSAGES
Credit claiming messages matter because they affect how constituents allocate credit for expenditures made in the district. This occurs, in part, because legislators differ in what they claim credit for and how often they make such claims. In this section, we establish how legislators use credit claiming messages. We first show that representatives regularly claim credit for expenditures made through executive agency grants. Focusing on earmarks alone, therefore, misses a large share of the expenditures that legislators use to create the impression of delivering money to the district. We also demonstrate the substantial and systematic variation in how closely legislators associate themselves with spending in the district: Contrary to assumptions in previous work, some legislators avoid claiming credit for money spent in the district, while others actively associate themselves with spending in the district.
To measure legislators’ credit claiming efforts, we use a new collection of over 170,000 House press releases, issued between 2005 and 2010—all press releases House members issued over the six-year period.Footnote 2 Press releases are an incredibly useful tool to measure what legislators are saying to constituents—they are regularly used by House members and have been shown to capture credibly legislators’ behavior in other areas (Grimmer Reference Grimmer2010). Press releases are also useful because they measure legislators’ strategies, rather than conflating legislators’ strategies with newspaper editorial decisions (Kaplan, Park, and Ridout Reference Kaplan, Park and Ridout2006).
We classify the press releases into five categories. The first two categories measure legislators’ credit claiming behavior, following a division first suggested in Evans et al. (Reference Buhrmester, Kwang and Gosling2007). The first category identifies press releases claiming credit for money allocated during the appropriations process, primarily about earmarks included in the bills. For example, Randy Neugebauer (R-TX, 19th) issued a press release where he announced that “[w]eeks of hard work by Rep. Randy Neugebauer to restore funding for important rural health initiatives and Texas Tech University paid off Wednesday as the House passed legislation to fund health and education-related programs in 2006” (Neugebauer Reference Neugebauer2005). The second category is credit claiming messages that claim credit for funds allocated through a bureaucratic agency, usually in the form of grants. One example press release states that “Congressman Dale Kildee (D-MI) announced today that Bishop International Airport would receive a $2,576,029 Federal Aviation Administration grant to continue construction of an intermodal hub and allow the airport to accommodate larger aircraft” (Kildee Reference Kildee2008). The remaining three categories measure noncredit claiming behavior, including: advertising messages, position taking statements, and critiques of earmarked funds (primarily from the office of Jeff Flake; R-AZ). Our supplemental Online Appendix (available at http://www.journals.cambridge.org/psr2012017) contains more extensive examples of each category.
Representatives Claim Credit for Grants as well as Earmarks, but Vary in Frequency of Credit Claiming
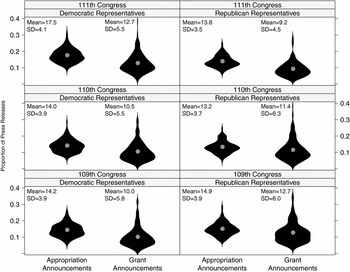
Notes: This figure demonstrates that legislators use both grants and earmarks to create the impression they are effective at delivering funds to the district, though there is substantial variability in the space allocated to credit claiming across legislators. The figure visualizes the distribution of the proportion of press releases claiming credit for money allocated through the appropriations process (left-hand distribution) and grants (right-hand distribution) for Democrats (left panel) and Republicans (right panel) across the 109th, 110th, and 111th Congress. Where the distributions are thicker, there is a larger concentration of legislators, thinner areas imply fewer legislators, and the grey dot is the mean proportion of press releases for that distribution. For specific numerical values, we provide the mean and standard deviation (SD) for each distribution.

We classify the collection of press releases using the supervised learning algorithm ReadMe (Hopkins and King Reference Hopkins and King2010)—a method that reduces the cost of hand coding large sets of documents. Like traditional coding efforts, supervised methods begin with hand coding documents (Evans et al. Reference Buhrmester, Kwang and Gosling2007). Specifically, we hand coded 500 randomly sampled press releases into the five categories. The hand coded press releases are then used to train the statistical model to measure the proportion of press releases in each category from each House member in each Congress.Footnote 3
Moderates Claim Credit for Spending at a Higher Rate than Extremists
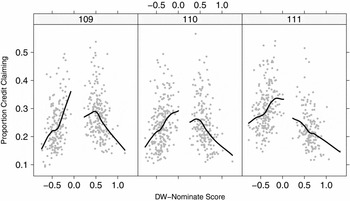
Notes: This figure provides one example of systematic differences across legislators in credit claiming behavior—demonstrating how ideological moderates allocate more space to claiming credit than other senators. The panels present the relationship between ideology and credit claiming propensity in the 109th (left-hand panel), 110th (center panel), and 111th (right-hand panel) Congress. Along the horizontal axis of each panel legislators are plotted according to their DW-Nominate score and the vertical axis contains the proportion of press releases dedicated to claiming credit for expenditures. The black line is a LOESS regression, revealing the relationship between ideology and credit claiming (Cleveland Reference Cook1979).

Figure 1 presents the distribution of legislators’ credit claiming efforts. Each panel contains the distribution of the proportion of press releases dedicated to claiming credit for money allocated during the appropriations process (left-hand distribution) and grants (right-hand distribution), for the 109th (bottom row), 110th (middle row), and 111th (top row) Congress for Democrats (left-hand panels) and Republicans (right-hand panels). The densities are presented as violin plots: flattened kernel-density plots. Areas where the distribution is thicker have a larger share of representatives and thinner areas have fewer representatives. The grey dot is the average proportion of press releases legislators of a particular category, in that Congress, dedicate to claiming credit for a particular expenditure.
Figure 1 shows that conflating earmarks with spending vastly underestimates the funds legislators claim credit for. When legislators craft messages to create the impression that they deliver funds to the district, they use both earmarked funds and money allocated through the bureaucratic grant process (Evans et al. Reference Buhrmester, Kwang and Gosling2007). Funding allocated during the appropriations process—the left-hand distribution in each cell—comprises a larger share of most representatives’ press releases than credit claiming about grants allocated to districts. But press releases announcing grants comprise about 42% of all credit claiming press releases: Nearly half of all credit claiming efforts focus on spending made outside of the appropriations process. This share is stable across Congresses and across parties—both Democrats and Republicans regularly use press releases to associate themselves with money allocated through an executive agency.Footnote 4
Figure 1 not only shows that legislators claim credit for grants and earmarks, it also exhibits the substantial variation in the share of press releases legislators dedicate to credit claiming. This variation is systematic—it covaries with legislators’ characteristics and differential incentives to engage in credit claiming in Washington. One example of this systematic relationship is found in Figure 2, which shows the relationship between the proportion of credit claiming press releases (the aggregation of the two credit claiming categories) and legislators’ DW-Nominate scores for the 109th, 110th, and 111th Congress (Poole and Rosenthal Reference Poole and Rosenthal1997). Moderate legislators of both parties allocate a much larger share of their press releases to claiming credit for money spent in the district—nearly 10 percentage points more than the most liberal Democrats and most conservative Republicans (Grimmer n.d.).Footnote 5
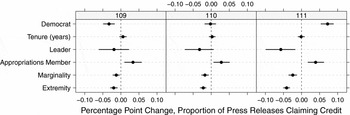
Figure 3 describes the systematic relationship between legislators’ characteristics and their credit claiming behavior across the 109th, 110th, and 111th Congress. We summarize the relationship across a series of independent variables, to demonstrate how credit claiming behavior differs across representatives. To show the connection with Figure 2, the bottom row of Figure 3 shows the change in credit claiming behavior associated with moving a legislator 0.2 units towards the extreme of her party (a one standard deviation shift in extremism). The point is the expected value of this change and the lines are 95 percent confidence intervals. As expected from the top plot, this results in a reduction of 4.1 percentage points in the 111th Congress (95 percent confidence interval [0.03, 0.05]). A similar systematic relationship is observed between legislators’ marginality and credit claiming—marginal representatives likely have the strongest incentives to cultivate a personal vote, facing constituents who tend to support the other party (Grimmer n.d.; Wichowsky n.d.). To measure a legislator's marginality, we use the share of the two-party vote for the presidential candidate from the legislator's party in the most recent presidential election. A one-standard deviation shift towards more alignment is associated with a 2.4 percentage point reduction in credit claiming press releases in the 111th Congress (95 percent confidence interval [0.01, 0.04]). Similarly, Congressional leaders allocate less attention to credit claiming than other legislators (5.8 fewer percentage points, [0.01, 0.09]); members of the Appropriations committee allocate more attention to credit claiming (3.9 more percentage points, [0.02, 0.06]); Republicans in the 109th Congress allocate more attention to credit claiming than Democrats (3.3 more percentage points, [0.01, 0.04]); while Democrats in the 111th Congress allocate more attention to credit claiming press releases than Republicans (7.2 more percentage points, [5.6, 8.9]).
Summarizing the Systematic Differences in Credit Claiming Behavior
Notes: This figure summarizes systematic differences across legislators in their credit claiming frequency. To do this the figure presents the percentage point difference in share of press releases dedicated to credit claiming (horizontal axis) across representatives’ characteristics (vertical axis). The points in the figure are the mean of the differences across groups or the difference in means associated with shifts in characteristics, while the lines are 95 percent confidence intervals for the mean.

It is worth repeating that Figures 2 and 3 are not intended to establish the causal effect of various legislator characteristics on their credit claiming behavior. We think a valuable contribution in future studies will be to explain why legislators adopt different strategies when communicating with constituents. But our intent in presenting the results in Figures 2 and 3 is to show that legislators have substantial discretion over the extent to which they associate with spending in their district. Legislators, therefore, use credit claiming messages in an attempt to affect systematically how closely they are associated with spending in the district.
CONSTITUENT RESPONSE TO CREDIT CLAIMING MESSAGES
Legislators, then, use credit claiming messages as a tool to cultivate the impression that they are effective at delivering money to the district. In this section, we show why this matters. We use two experiments to isolate the effects of the messages and show how the content and repetition of messages affect a legislator's personal vote.
Our proposed manipulations make standard experimental tools difficult to apply. Survey experiments, because they can credibly claim to measure the effect of a treatment on a representative sample, have become a popular tool for measuring the effect of treatments (Sniderman and Grob Reference Sniderman and Grob1996). But we are unable to utilize survey experiments for our manipulation—our experimental conditions vary the frequency of messages—a difficult (or impossible) manipulation in survey experiments (Gaines, Kuklinski, and Quirk Reference Gaines, Kuklinski and Quirk2007). Additionally, a survey experiment would require us to place our manipulation directly between pretreatment and posttreatment questions, making it more likely that we measure an instantaneous and short-lived response to our treatment. Convenience samples of college students are also unattractive for our experiment—they will tend to concentrate in only a few Congressional districts and are likely the least interested in spending in their Congressional districts at home.
As an alternative we use Amazon's Mechanical Turk service to recruit participants and then use proprietary software to deliver messages in ecologically valid settings. Berinsky, Huber, and Lenz (Reference Berinsky, Huber and Lenz2012) show that this service provides a sample more representative than most in-person convenience samples and that Mechanical Turk experimental participants replicate experimental benchmarks. And our study replicates this finding: In our supplemental Online Appendix, we show that our sample is more diverse than a typical sample of college students, though not representative of the U.S. as a whole. Further, in the supplemental Online Appendix we show that the correlations in our sample closely follow correlations in benchmark survey data: Democrats, Republicans, liberals, and conservatives in our sample respond like Democrats, Republicans, liberals, and conservatives in other studies. Validation studies conducted in other fields provide further evidence of the effectiveness of Mechanical Turk (Buhrmester, Kwang, and Gosling Reference Cacioppo and Petty2011; Sprouse Reference Sprouse2011). These studies show that Mechanical Turk and traditional laboratory subjects are nearly indistinguishable—both in replicating recent experiments (Sprouse Reference Sprouse2011) and in reproducing the results of classic experiments (Buhrmester, Kwang, and Gosling Reference Cacioppo and Petty2011). To increase the internal validity of our study, we used a series of questions that assess whether the subjects were engaged with our pretest and posttest battery of questions. We provide summary statistics of the characteristics of our experiment participants, description of recruitment and payment, and validation of our data in the supplemental Online Appendix.
While recruiting experiment participants through Mechanical Turk may seem novel, it provides several advantages over survey or lab experiments.Footnote 6 Both of our experiments are ecologically valid—they replicate how legislators actually disseminate credit claiming information. Because we gather geographic information about respondents at a fine enough resolution to determine their congressional district (zip+4), our platform alleviates the need to present our manipulations in the context of a fictitious representative. Instead, each experiment manipulates messages that our participants believe to be from their actual representative—ensuring that our experiments are not artificially powerful due to the use of hypothetical legislators. (To ensure our participants are not left with false impressions, we debrief our experiment participants, clarifying that they had been participants in a study.) Our measurement strategy also separates exposure to a treatment and the measurement of its effect. All of our postexperiment surveys are conducted on the day after the treatment is completed. Together, our design provides a powerful platform to assess the effects of credit claiming messages on constituents.
Study 1: Credit Claiming Messages and the Impression of Effectiveness
Our first experimental study demonstrates that credit claiming messages have distinct effects from other nonpolitical advertising messages. Advertising affects the visibility component of the personal vote (Cain, Ferejohn, and Fiorina Reference Cassino, Lodge, Neuman, Marcus, Crigler and MacKuen1987), establishing some standing among those who do not know the representative and increasing positive evaluations of a representative among those who do. By manipulating the presence of credit claiming, we can document its effect beyond mere exposure to advertising messages designed only to increase a legislator's visibility.
Our experimental manipulation sent messages ostensibly from representatives to constituents. Using Mechanical Turk we recruited 462 subjects to use a proprietary Facebook application we created called U.S. Congressional Connection. The participants were told that the application was part of a project through our university to facilitate connections between legislators and constituents. After completing a preliminary survey and providing a nine-digit zip code (we assisted participants in obtaining this), we directed participants to install our Facebook application.Footnote 7 Upon installation of the application, participants were randomly assigned to one of three treatment conditions: (1) a control condition where no messages were sent, (2) a credit claiming condition where subjects were sent credit claiming messages from their representative, and (3) an advertising condition where subjects were sent messages with minimal political consequence, but that advertised the legislator's name. Table 1 contains two example posts, as they appear on our server and before they are rendered and sent to our subjects. After identifying the subject's legislator, we fill in the information in Table 1 with the legislator's information—creating the impression of a press release from the subject's representative. For example, at each instance of |lastName in Table 1 we placed the legislator's last name and at each instance of |party we place the legislator's party. To ensure that our messages closely approximated the actual statements legislators would issue, we based all our manipulations on actual press releases. We have placed all our treatments in the supplemental Online Appendix.
Example Templates for Facebook Posts

Key
|lastName: The representative's last name
|firstName: The representative's first name
|party: The representative's party
|state: The representative's state
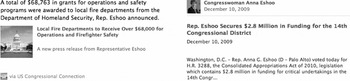
For five consecutive days participants received different messages from our application that corresponded to their assigned treatment. These messages displayed in the participant's news feed—information automatically available upon logging into Facebook. Our story appeared naturally in the news feed, which also contains information about the participant's “friends” and displays content they recommend. The news feed also displays “subscribed” content—often from media outlets and public officials. The left-hand image in Figure 4 provides an example of one post from our manipulation as it appears in a subject's news feed. The headlines and short descriptions of each message were chosen so that they contain the desired treatment: our subjects received the treatment without any additional action. If subjects did click on the provided link they received the entire statement. The right-hand image in Figure 4 provides an example of an actual statement on Facebook from Anna Eshoo (D-CA). The striking similarity between our manipulation and actual content illustrates our experiment's ecological validity. After five days, participants were asked to complete a poststudy survey, where we ask a battery of questions designed to assess the effects of our intervention.Footnote 8 Participants answered representative identification questions first, then questions about attitudes towards the representative, and finally questions about the performance of the representative. All questions were randomized within the three blocks.Footnote 9
Example Message from Our Facebook Application, Compared to Actual Credit Claiming on Facebook
Notes: This figure compares a message from our application that is ostensibly from Anna Eshoo (D-CA) (left-hand picture) to an actual credit claiming message from Anna Eshoo (right-hand picture). The strong resemblance is evidence of the ecological validity of our treatments.

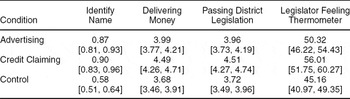
Table 2 summarizes the results across the experimental conditions (rows) and for four dependent variables (the columns).Footnote 10 In the first column we provide a manipulation check: demonstrating that participants assigned to the advertising (top row) and credit claiming (middle row) conditions were significantly more likely to select their legislator in a multiple choice quiz than participants assigned to the control condition (bottom line). When compared to the control group, participants assigned to receive advertising press releases were 29 percentage points more likely to select the correct representative (95% confidence interval [0.20, 0.39]), while participants assigned to receive credit claiming messages were 32 percentage points more likely to identify the correct legislator (95% confidence interval [0.22, 0.41]). This is strong evidence that constituents assigned to receive messages from our application actually encountered those messages.
The Effect of Credit Claiming and Advertising on Constituents

This table shows that credit claiming messages are more effective at cultivating support than advertising messages. Each row contains the conditions: the top row is the advertising condition, the middle row is the credit claiming condition, and the bottom row is the control condition. The columns contain the outcome variables. Each entry is the corresponding condition's average for the dependent variable, with a 95 percent confidence interval below this average. The first column contains a manipulation check, demonstrating that our study increases name recognition, evidence subjects received our treatments. The second and third columns demonstrate that claiming credit increased the impression that legislators were effective at delivering money to the district and passing legislation beneficial for the district. The fourth column shows that credit claiming messages cultivated more support for the legislator.
Both credit claiming and advertising messages increase a legislator's name recognition. But credit claiming messages are more effective at cultivating the impression that legislators are able to deliver funds to the district and pass legislation beneficial to the district. The second column shows that subjects in the credit claiming condition rated their legislator as more effective at delivering federal money to the district. Subjects were asked to rate how effective their representative has been on “bringing federal money to your community” on a seven-point scale. Subjects in the credit claiming condition rated their representative 0.80 units higher than evaluations in the control condition (95% confidence interval [0.48, 1.12]) and 0.49 units more effective than participants assigned to the advertising condition (95% confidence interval [0.16, 0.82]).Footnote 11 The third column shows that subjects in the credit claiming position rated their legislator as more effective at “passing legislation that helps your community” on the same seven-point scale. Subjects assigned to the credit claiming condition rated their representative 0.78 units more effective than the control condition (95% confidence interval [0.46, 1.11]) and 0.55 units more effective than those assigned to the advertising condition (95% confidence interval [0.21, 0.88]).
The fourth column in Table 2 shows that credit claiming messages are more effective at cultivating support than advertising messages. Following a wide array of studies (for example, Stein and Bickers Reference Stein and Bickers1994), we measure the effect of our experiment on constituent evaluations using a 100-point feeling thermometer: a score of “0” is the lowest possible score and a score of “100” is the highest possible rating. Subjects assigned to the credit claiming condition had an increase in average feeling thermometer rating of 10.85 points over the control condition (95% confidence interval [4.87, 16.83]) and an increase in average thermometer rating of 5.69 points over the advertising condition (95% confidence interval [−0.27, 11.65]). This is a substantial increase in favorability—nearly as large as the increase in favorability associated with having a co-partisan representative. Among our control group, co-partisans rated their representative 13.56 units higher. Credit claiming messages increased the average rating of representatives 10.85 units over the control group—an effect 80% the size of the co-partisan difference—and 5.69 units over the advertising group—an effect 42% of the size. The results are also robust to alternative model specifications. In the supplemental Online Appendix, we show that including respondent level covariates and legislator random effects—to account for the repeated use of some legislators—yields nearly equivalent results.
This experiment demonstrates that credit claiming messages have a distinct and substantial effect on constituents above and beyond increasing visibility. Credit claiming messages cultivate an impression of effectiveness and therefore cause a greater increase in constituents’ evaluations.
Study 2: The Effect of Money and Repetition on Constituent Support
While many models of credit claiming assume that constituents are responsive to the dollar amount allocated to the district, we argued that it is unlikely that constituents are able to account for the spending in their district. Even when presented with legislators’ credit claiming statements, it requires substantial effort to account for the amount a legislator claims to have directed to the district. Repeatedly issuing credit claiming statements, however, allows constituents to serially update their impression of their legislator's effectiveness at directing funds back to the district. We therefore expect that the amount claimed will matter much less than the number of the credit claiming messages.
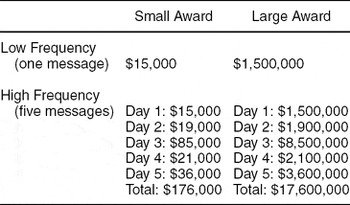
We test these expectations directly with an experimental manipulation of both the number of messages and the amount of money claimed in credit claiming statements. To ensure that our results are not dependent on any one context, we conduct this experiment using emails sent directly to our subjects rather than messages posted on Facebook. We test the effect of message frequency and award size using a 2×2 experimental design—which we summarize in Table 3. One manipulation varies how frequently subjects received emails. Subjects assigned to the high frequency condition received emails for five consecutive days, while subjects assigned to the low frequency condition received a single email. The second manipulation varies the amount claimed. Subjects assigned to the large award condition receive emails claiming credit for 100 times the amount of the corresponding small award condition with the same frequency. Table 4 provides an example of this manipulation, before it is rendered and sent in an email. Again, we use information about the subject's legislator to customize the announcement to create the appearance that it is from the legislator. Depending on the condition, we substitute the dollar amount at each instance of |awardAmount. As a result, we have direct control over the amount of money claimed.Footnote 12
Total Amount Claimed across Experiment Conditions

Example Credit Claiming Manipulation

Key
|lastName: The representative's last name
|firstName: The representative's first name
|party: The representative's party
|state: The representative's state
|district: The representative's district
|awardAmount: The dollar amount claimed
We again used Mechanical Turk to recruit a new group of 1,001 participants for the second experiment and randomly assigned them to one of the four conditions in our experiment. The participants were again told that the information was part of a project through our university to facilitate connections between legislators and constituents. To ensure comparability across conditions, we followed a similar timeline across conditions. The day after enrolling, subjects began receiving emails with the corresponding treatments. The day after the final email was sent subjects received an invitation to complete the postexperiment survey. This ensures that our findings are not the result of effects decaying after subjects participated in our study.
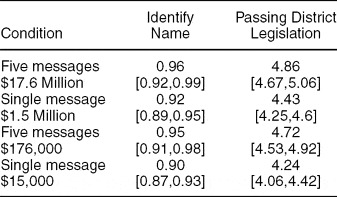
Given the use of emails to deliver the credit claiming messages, one concern is that our messages would be trapped in email spam filters. The construction of the emails minimized this possibility, but we begin with a manipulation check to demonstrate that our subject participants received our messages. The first column in Table 5 shows the proportion of subjects in each condition who are able to correctly identify their representative in a multiple choice test. The top entry in each row is the proportion of subjects assigned to each condition who correctly identified their representative and the 95 percent confidence interval is the bottom entry in each row. The first column of Table 5 shows that, across the four conditions, there is an extremely high level of recognition. And as expected intuitively, there is a slight increase among the high frequency conditions: 95.2% of the subjects assigned to the high frequency condition could correctly identify their representative, a 4.4 percentage point increase over the low frequency condition (95% confidence interval [0.01, 0.08]).
Number of Messages Dominates the Amount Claimed

This table shows that subjects received our email messages and that increasing the number of messages bolstered one measure of a legislative effectiveness more than increasing the amount claimed. The four conditions are placed along the rows and each entry is the corresponding condition's average for the dependent variable, with a 95 percent confidence interval beneath. The first column shows that there is a high level of recognition across our conditions, evidence that subjects received our emails. The second column shows that small award, high frequency subjects evaluated their legislator as more effective at passing legislation for the district than the large award, low frequency condition.
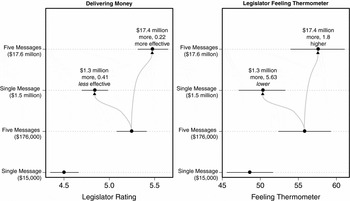
Figure 5 shows that increasing the number of messages cultivates more support than increasing the amount claimed. Consider the left-hand plot, which shows participants’ rating of their representative's effectiveness at delivering money to the district, recorded on the same seven-point scale as in the previous section. Each dot represents legislators’ average effectiveness ratings for each condition and the lines are 95 percent confidence intervals. Subjects assigned to the small award, high frequency condition evaluated their representative as 0.41 units more effective at delivering funds than the large award, low frequency condition (95% confidence interval [0.18, 0.64]). This is particularly surprising given the discrepancy in the amount claimed: subjects assigned to the small award, high frequency condition received messages claiming credit for about one-tenth of the funds as subjects in the large award, low frequency condition. The top estimate shows that subjects assigned to the large award, high frequency condition had the highest evaluation of their representative's effectiveness: increasing the evaluation 0.22 units over the small award, high frequency condition (95% confidence interval [−0.01, 0.44]). This increase, however, is minuscule in comparison to the increase in funds claimed in the large award, high frequency condition. In this condition subjects received messages from legislators claiming credit for 100 times the money as the amount claimed in the small award, high frequency condition. This pattern is replicated when subjects were asked to assess their representative's effectiveness at passing legislation that benefits the district. The right-hand column in Table 5 shows that small award, high frequency subjects evaluated their representative's legislative effectiveness substantially higher than subjects assigned to the large award, low frequency condition (0.30 unit increase, 95% confidence interval [0.03, 0.56]). And there fails to be a substantial increase in evaluations associated with more money. Subjects assigned to the large award, high frequency condition evaluate their representative as more effective than the small award, high frequency subjects—a 0.14 unit increase—though the difference is not statistically significant at standard levels (95% confidence interval [−0.14, 0.42]).
Legislators cultivate perceptions of effectiveness to build support among constituents. The right-hand plot in Figure 5 shows that increasing the number of credit claiming messages substantially increases support. Each point represents the average feeling thermometer evaluation for the subjects assigned to each of the four conditions and the lines are 95 percent confidence intervals. In both the low and high frequency conditions, we see that the amount of money claimed in the press releases fails to substantially or significantly increase the subjects’ evaluations of their legislator even though the large award conditions contained messages claiming credit for substantially more funds. Subjects assigned to the large award low frequency condition had only a 1.6 unit higher evaluation of their representative over the small award, low frequency condition—a difference that is not significant at standard levels (95% confidence interval [−2.75, 5.98]). Likewise, subjects in the large award, high frequency condition evaluated their representative 1.8 units higher than the small award, high frequency condition, but again the difference is not significant at standard levels (95% confidence interval [−3.07, 6.70]).
Number of Messages Dominates the Amount Claimed
This figure shows that multiple messages cultivate more support than increasing the amount claimed. The left-hand plot presents subjects’ evaluations of their legislator's effectiveness at delivering money to the district. The points are the average evaluations and the lines are 95-percent confidence intervals. Even though there is $1.3 million more announced in the large award, low frequency condition (second line), subjects evaluated their representative as less effective at delivering money than the small award, high frequency condition (third line). And the large increase in money claimed in the large award, high frequency condition (top line) does not result in substantially higher evaluations. The right-hand plot shows a similar effect of more messages on feeling thermometer evaluations—the number of messages dominates the amount claimed.

Thus, the money claimed had little effect on the evaluation of legislators, but the frequency of messages mattered substantially. Subjects assigned to the small award, high frequency condition evaluated their representative 5.63 units higher than those in the large award, low frequency condition (95% confidence interval [1.07, 10.17]). In short, spreading a relatively small amount of money over several messages is substantially more effective at building support than claiming credit for one large expenditure.
To see how much more effective frequent messages are than claiming credit for large amounts of money, we compare how much each dollar claimed increased legislators’ evaluations, relative to the baseline condition of the small award, low frequency condition. To measure this return, we divide the increase in average feeling thermometer rating by the increase in the amount of funds claimed, measured in $10,000 units. This simple calculation reveals that frequently claiming credit for small amounts of money is a much more efficient way to cultivate support among constituents than increasing the total amount claimed. The return on the large award and high frequency condition is an increase in average feeling thermometer ratings of only 0.005 units per $10,000 claimed. The return for the small award, high frequency condition was much larger. For every $10,000 claimed in the small award high frequency condition, the average feeling thermometer increased 0.45 units—a per-dollar increase in support 90 times bigger than that found for the large award, high frequency condition.Footnote 13
OBSERVATIONAL EVIDENCE: HOW CREDIT CLAIMING AFFECTS CREDIT ALLOCATION
The previous section demonstrates that constituents are more responsive to the number of credit claiming messages sent, compared to the total dollar amount claimed. The experimental studies are robust, but they assume that constituents consume credit claiming messages. Using survey data and Senate credit claiming measures we show that this is the case. Senators with a relatively higher credit claiming propensity enjoy greater constituent support. Further, we show that the effect of credit claiming messages are strongest among those constituents most likely to consume senators’ credit claiming messages. The result is systematic evidence that legislators’ credit claiming efforts actually affect the personal vote.
We demonstrate the effect of credit claiming messages on constituents using measures of senator credit claiming behavior in 2006 from Grimmer (n.d.) and respondents’ approvals of senators recorded in the 2006 Cooperative Congressional Election Study (CCES). We use Senate, rather than House, data because it facilitates a within respondent design. Because two senators represent each respondent, we are able to model how senators’ relative credit claiming frequencies affect their relative evaluation. This design eliminates the influence of constant constituent characteristics—such as the propensity to consume media and legislators’ messages, length of time living in the state, age, education, income, occupation, race, and a host of other covariates that we would expect to confound our estimate of how legislators’ credit claiming behavior affects constituents. The within respondent design also eliminates much of the influence of actual expenditures in the district. Each senator represents the same geographical unit, and therefore there is an identical flow of actual spending to the district. This eliminates the potential influence of actual spending (as used in Levitt and Snyder (Reference Levitt and Snyder1997)) or the number of new projects in the district (Stein and Bickers Reference Stein and Bickers1994). The within unit design also eliminates the influence of state level characteristics—such as political competition (Jones n.d.), population (Oppenheimer Reference Oppenheimer1996), and state political culture (Schaffner, Schiller, and Sellers Reference Schaffner, Schiller and Sellers2003).
To formalize our design, suppose that for each respondent i (i=1, . . ., Nj), in each state j (j=1, . . ., 50) and senator k, k=(1, 2) we use a dichotomous indicator of whether the respondent approves of each of her senators, Y ij1 and Y ij2. For all respondents we then define the difference in approval, Diffij = Y ij1 − Y ij2. This will constitute the dependent variable for our analysis. To measure the effect of the propensity to claim credit, we use measures of the number of credit claiming press releases issued in 2006 from Grimmer (n.d.). For each senator we measure the total number of credit claiming press releases—T ij1 and T ij2—and then take their difference, Diff. Number Credit Claiming = T ij1 − T ij2.Footnote 14
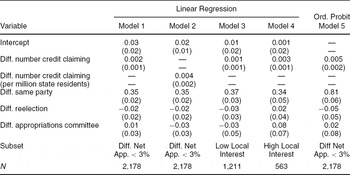
The within respondent design does not address systematic selection in how often legislators claim credit for appropriations. Grimmer (n.d.) shows that the most vulnerable senators issue the most credit claiming press releases. This creates a selection problem similar to that observed in campaign spending (Jacobson Reference Jacobson1978) and the provision of constituency service (Fiorina Reference Fiorina1981): because the most vulnerable legislators use it the most to build support, naïve regressions suggest a negative effect of credit claiming. Given that we lack a plausible instrument (Gerber Reference Gerber1998), we use a substratification research design analogous to that employed in Erikson and Palfrey (Reference Evans2000). We restrict our attention to a stratum of senator pairs who had very similar net-approval ratings at the end of 2005—before credit claiming in 2006 could have had influenced constituents’ evaluations. We include other covariates that attempt to limit other sources of confounding: including whether a constituent is a co-partisan of one senator and an opposing partisan of the other senator, differences in committee membership, and differences in reelection status. The result of our models and a full list of covariates is contained in Table 6, where the coefficients and standard errors (in parentheses) are presented.
The Effect of Credit Claiming on Senate Approval

This table demonstrates that our findings have high external validity—legislators who credit claim more often receive higher evaluations. The effect of press releases are most pronounced on the subsample that is most likely to consume the press releases—those who are most attentive to local media.
The first column in Table 6 shows that senators with a high propensity to credit claim also tend to receive higher levels of support—a relationship that is both substantively and statistically significant. Increasing the differential between two senators by 40 press releases increases relative support for the legislator with a higher propensity to credit claim by 0.082 (95% confidence interval [0.04, 0.12]). For a sense of the magnitude of this effect, co-partisanship between respondent and legislator is associated with an increase in relative approval of 0.35, so the effect of the credit claiming propensity is about 23% of the differences across partisans. This relationship is robust. First, we may be concerned that the number of press releases is a very different treatment across diverse states. The second column of Table 6 shows that the equivalent relationship is found, even after scaling relative credit claiming propensity by state population (measured in millions). Further, the final column of Table 6 shows that using a more appropriate ordered probit model yields the same results: more support for senators with a higher propensity to credit claim.
This demonstrates that the relative propensity to credit claim has a direct effect on the senators’ relative evaluations—even though both senators represent a geographic unit that receives the same amount of federal funds. This effect is concentrated among those individuals who report high attention to local news and local media—exactly those individuals most likely to consume legislators’ credit claiming statements (see Stein and Bickers (Reference Stein and Bickers1994) for a similar result regarding project awards in House districts and political interested respondents). Models 3 and 4 rerun our analysis on two subsets of the respondents. Model 3 is applied to those respondents who report a low to moderate interest in local news, while Model 4 is applied to those who report a high level of interest in local news. For respondents who report a low consumption of local media, the differential propensity to credit claim has a small effect that is nearly indistinguishable from zero (0.001, 95% confidence interval [−0.001, 0.002]). But senators’ propensity to credit claim has a large effect on respondents who report regular consumption of local media (0.003, 95% confidence interval [0.001, 0.005]). And the difference between the two coefficients are both substantively meaningful and statistically significant (p<0.1)—indicating that the effect of credit claiming behavior is concentrated among those constituents most likely to encounter senators’ credit claiming efforts.
CONCLUSION
The different ways in which legislators claim credit affect how constituents allocate credit. We show that there is substantial variation in what legislators claim credit for and how often they claim credit for expenditures made in their districts, based on an examination of 170,000 press releases issued from 2005 to 2010. We follow with two experimental studies that show that differences in credit claiming strategies matter for how constituents allocate credit. Our first experiment demonstrates that credit claiming messages have an effect on constituents distinct from other, nonpolitical messages. Our second experiment demonstrates that constituents are responsive to more than the dollar amount claimed: increasing message frequency causes a larger increase in constituent support for legislators than increasing dollar amounts claimed. We then show that the credit claiming efforts have a direct effect on senators’ evaluations—with the largest effect concentrated among those constituents most likely to encounter legislators’ credit claiming messages.
Our results suggest an explanation for the often loose association between spending in the district and electoral support (Fiorina Reference Fiorina1981; Levitt and Snyder Reference Levitt and Snyder1997; Stein and Bickers Reference Stein and Bickers1994). Studies that measure the effect of spending on the district on constituent support use the dollar amount of expenditures or the number of new projects allocated to the district. Our results suggest that this specification will make detecting the effect of particularistic spending difficult. First, because constituents have limited knowledge about spending, they can only allocate credit for projects that they associate with their representative. As representatives vary in their credit claiming activity, we would expect this association to vary across districts. Second, our experiments show that constituents may have a limited response to large new expenditures in the district. Rather than a reflexive response to spending, our experimental results suggest that we would expect the largest effect of government spending when legislators regularly announce expenditures in the district. Simply measuring total funds delivered to a district removes critically important information about how frequently legislators cultivate the impression that they deliver funds to the district.
While our experiments demonstrate that constituents are more responsive to frequent credit claiming activities, it is unclear if legislators recognize this when engineering credit claiming opportunities. Prior literature (Arnold Reference Arnold1979; Ferejohn Reference Ferejohn1974) and the evidence that we present suggests the possibility that legislators recognize the value in small grants. The fact that legislators regularly announce small expenditures from bureaucratic agencies is suggestive evidence that they value the opportunity to frequently claim credit when interacting with constituents. If true, this suggests an explanation for why legislators pursue relatively small earmarks (Crespin, Finocchiaro, and Wanless Reference Delli Carpini and Keeter2009; Lee Reference Lee2003) and allow agencies to allocate large sums of money through grant programs (Arnold Reference Arnold1979; Ferejohn Reference Ferejohn1974; Stein and Bickers Reference Stein and Bickers1994). Rather than pursuing the largest expenditures, legislators may create institutions that provide regular and modestly sized grants that are easily announced to the public. If correct, future studies should examine how spending is structured to ensure that legislators receive full credit for expenditures in the district and examine how federal outlays are constructed to help constituents attribute spending in the district to incumbents.
Credit claiming activities may also help explain how presidents receive credit for federal expenditures. Kriner and Reeves (Reference Kriner and Reeves2012) show that presidents often receive credit for particularistic spending and that presidents receive more credit in counties represented by the president's co-partisans in Congress. In the supplementary information we offer one explanation for this finding. We show that co-partisans of the president are much less likely than opposing partisans to contest the president's credit—to explicitly undermine the credit a president receives by arguing that an expenditure was obtained over the president's objection or budget cut. We then use an experimental manipulation to show that contesting the president's credit for an expenditure actually undermines the credit that constituents allocate to the president, with a particular decrease among independent voters. This provides an explicit mechanism to explain why presidents receive less credit when a county is represented by opposing partisans in Congress—because those partisans use messages to diminish the president's credit.
Finally, much work remains in demonstrating how credit claiming activities build support among constituents. Further experiments are necessary to assess ideas such as contested credit claiming (Shepsle et al. Reference Shepsle2009), the party-based rewards for expenditures (Lazarus and Reiley Reference Lazarus and Reiley2010), and formal theoretic models of valence cultivation (Serra Reference Serra2010). Our experimental designs provide straightforward templates for testing these theories using real constituents who are asked to evaluate real members of Congress—illuminating how legislators’ words, coupled with expenditures in the district, cultivate support.






Comments
No Comments have been published for this article.