Magnetic resonance imaging has emerged over the last decade as the gold standard for imaging of the aorta.Reference François and Carr1 Concerns about radiation exposure from computed tomography exist, especially when serial scanning is required. Echocardiographic imaging is limited to the aortic root and proximal ascending aorta and standardised methods of measurement are limited to two dimensions. Patients with connective tissue disorders such as Marfan, Ehlers–Danlos, and thoracic aortic aneurysm syndrome are at risk for the development of aortic aneurysms and require serial imaging of the entire thoracic aorta. This group of patients, in particular, may benefit from the comprehensive coverage of the aorta provided by magnetic resonance imaging.
Due to time constraints, current manual methods of magnetic resonance image analysis result in processing of only a limited number of images contained in a complete three-dimensional or four-dimensional (three-dimensional plus time) image data set. The end result is static measurements at end diastole and/or end systole at various locations of the thoracic aorta. Often, reproducing consistent locations of measurements for year-to-year comparisons is difficult.
In a recent study by Zhao et al,Reference Zhao, Zhang and Wahle2 we described a method for automated segmentation of four-dimensional data sets that produced results capable of distinguishing shape characteristics between normal individuals and those with connective tissue disorders with 90% accuracy. From this initial study, it was clear that the cross-sectional area could be measured for any level of the thoracic aorta and plotted for the entire length of the vessel for accurate comparison with future scans.
The goal of this study was to apply the graph theory-based segmentation method to four-dimensional magnetic resonance images of the thoracic aorta in normal controls to develop the first set of normative data for the dimensions of the entire thoracic aorta. The utility of the analysis and display technique was then applied to an initial group of patients with confirmed or suspected connective tissue disorders to show the utility of the method.
Materials and methods
Study population
Thirty-two normal individuals were recruited to participate in the study and were excluded if they had existing cardiac pathology, or a family history of connective tissue disorders or aortic dissection. Twenty-four patients, currently followed at the University of Iowa Hospitals and Clinics, with known or suspected connective tissue diseases and who were undergoing magnetic resonance imaging of their aortic arch were offered enrollment in the study. Patients were identified both prospectively and retrospectively from a database of connective disease patients who had undergone magnetic resonance imaging of their aortas. All patients in the Connective Tissue Disease Clinic at the University of Iowa over a 2-year period were approached to allow their image data to be included in this study. The database was reviewed and all patients not seen in the 2-year study period were contacted by mail for consent to allow their image data to be included in the analyses. Of the 24 patients, nine had two or more magnetic resonance imaging studies, although only their initial studies were used for the results presented below. Existing diagnoses were based on available echocardiographic data, family history, and/or genetic testing. For patients volunteering to enroll, the standard aortic arch imaging protocol was followed. No extra images were obtained or special imaging sequences were used as part of this study. The study was reviewed and approved by the University Human Subjects Review Board and informed consent was obtained from all individuals.
Magnetic resonance imaging
Normal individuals were scanned on a 1.5 Tesla Siemens Avanto scanner (Siemens Medical Solutions, Malvern, Pennsylvania, United States of America). A retrospectively gated, segmented two-dimensional balanced, steady-state free-precession gradient echo cine sequence was used with repetition time of 2.6–3.0 milliseconds, echo time of 1.1–1.3 milliseconds, flip angle of 70–80 degrees, 12–18 segments, and 20–28 cardiac phases. Field of view was 40–50 centimetres using a three-fourth rectangular field of view and a matrix of 192 × 256. In plane, resolution was 1.5–2 millimetres and the slice thickness was 6 millimetres with no inter-slice gap.
Patients were imaged as above or on a 1.5 Tesla General Electric Signa CV/i scanner (General Electric Medical Systems, Milwaukee, Wisconsin, United States of America). The imaging protocol on this system used a balanced, steady-state free-precession gradient echo cine sequence with a repetition time of 3.4–3.9 milliseconds, echo time of 1.25–1.65 milliseconds, and a flip angle of 50 degrees. For each group, sequential localizer images were used to obtain standard views, which included a left ventricular outflow tract view (corresponds to the echocardiographic parasternal long-axis view) and an aortic arch or “candy cane” view, which included the distal ascending aorta, transverse arch, and descending aorta to the diaphragm. Left ventricular outflow tract and aortic arch imaging was performed during sequential breath-holds at end expiration. The breath-hold time varied from 8 to 13 seconds, depending on the heart rate.
Image analysis
Following image acquisition, patient identifiers were removed and reference codes were added before transfer to a secure server. The left ventricular outflow tract and aortic arch images were registered together using the positioning and intensity information available in the Digital Imaging and Communications in Medicine data format. The registration process fused the information about the aorta from the two views, identifying the spatial correspondence between the left ventricular outflow tract and aortic arch images and interpolating the image to isotropic voxels to facilitate automatic segmentation of the aorta. Image analysis was performed using the methods previously described by Zhao et al.Reference Zhao, Zhang and Wahle2 Briefly, automatic segmentation of the aorta was performed using a graph theory-based segmentation algorithm that required initialisation points at the mid-aortic annulus and mid-aorta at the diaphragm and a volume that contained the entire thoracic aorta. Without further user input, the programme defined a surface of the aorta in four dimensions – average processing time of 5 minutes– and a centerline of the aorta from annulus to diaphragm on which 95 equally spaced points were defined. The cross-sectional area at each of the 95 points was calculated. An expert observer reviewed all borders defined by the programme for accuracy. When necessary, editing of the aortic borders was performed with a specially developed graphical user interface – average per scan change in total aortic volume after editing was 1.4 plus or minus 2.1%.
Statistical analysis
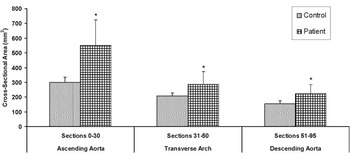
Frequencies are presented as a mean plus or minus standard deviation. Group characteristics were tested for differences with Student’s t-tests or chi-square tests. In other analyses, the aortic segmentation was separated into three sections corresponding to the ascending aorta (positions 1–30), the transverse aortic arch (positions 31–50), and the descending aorta (positions 51–95) for the comparison of normal and patient groups. Corresponding areas under the curve were calculated for the patient and normal groups and were used to examine for potential differences in the cross-sectional area. Mean cross-sectional area for the patient group was compared to the 95th percentile cross-sectional area from the normal group. Statistical analysis software was Statistical Analysis Software 9.2 (SAS, Cary, North Carolina, United States of America).
Results
Participant characteristics
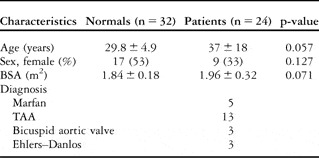
Characteristics of normal individuals and patients are presented in the Table 1. The normal and patient groups were not significantly different in terms of age, sex, and body surface area. Most of the individuals in the patient group had the diagnosis of Marfan syndrome or thoracic aortic aneurysm syndrome. Three of the patients had bicuspid aortic valve with aortic dilation and three had Ehlers–Danlos with aortic dilation.
Characteristics of normal individuals and patients.

BSA = body surface area; TAA = thoracic aortic aneurysm
Cross-sectional area nomogram
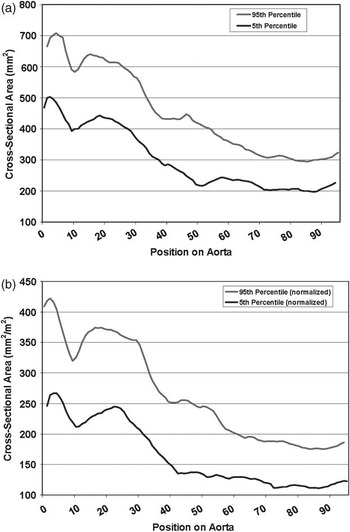
A nomogram representing the maximum cross-sectional area 5th–95th percentile along the length of aorta was constructed from the normal individuals and plotted using both raw values as well as values normalised to body surface area (Fig 1a and b). The maximum cross-sectional area for all phases along the entire length of thoracic aorta (95 slices) from aortic valve to diaphragm was used for the calculations. For individuals with multiple-year scans, an average value at each location was used. The ranges represent the maximum aortic area at any point during the cardiac cycle similar to aortic z-score diameters.Reference Colan, McElhinney, Crawford, Keane and Lock3 This ensures that the aorta is captured at the maximum point of distension.
(a) Aortic cross-sectional area nomogram. Maximum cross-sectional area 5th–95th percentile of normal individuals from aortic valve (position 1) to diaphragm (position 95). (b) Aortic-cross sectional area nomogram (normalised). Cross-sectional area 5th–95th percentile from aortic valve (position 1) to diaphragm (position 95) normalised for body surface area.

Calculated aortic diameters: comparison of magnetic resonance and echocardiographic measurements
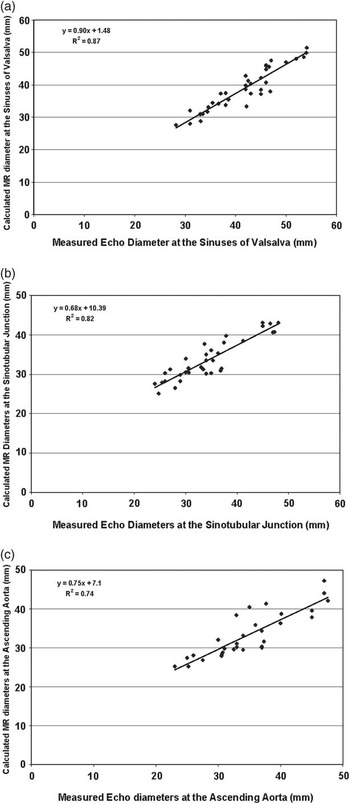
Aortic root levels corresponding to the sinuses of Valsalva, sinotubular junction, and proximal ascending aorta were identified from individual two-dimensional, left ventricular outflow tract, and aortic arch images. Using image localisation features built into the graphical user interface, the corresponding cross-section on the three-dimensional reconstructed aorta was identified and the end-diastolic cross-sectional area from that level used to calculate the average aortic diameter. End diastole was chosen for comparison with standardised echocardiographic measurements, which are made at end diastole.Reference Roman, Devereux, Kramer-Fox and O’Loughlin4 The ascending aorta position was defined as two segmentation marks above the sinotubular junction, approximately 5 millimetres, in order to most closely correlate with positioning of echocardiographic measurements for the proximal ascending aorta. Patients with echocardiographic aortic root measurements made within 6 months of the magnetic resonance scan were used for comparison between the two imaging modalities. As shown in Figure 2, an excellent correlation was found between the measurements calculated from the automatically analysed four-dimensional magnetic resonance image data sets and values directly measured by echocardiogram. Magnetic resonance measurements at the sinotubular junction and ascending aorta correlated less well than at the sinuses of Valsalva, resulting in a slight overestimation at smaller values and underestimation at larger values compared to echocardiographic measurements.
Comparison of echocardiographic and magnetic resonance measurements at the sinuses of Valsalva, Sinotubular junction, and ascending aorta. The regression plot is shown comparing measured echo diameters and calculated magnetic resonance diameters at the sinuses of Valsalva (a), sinotubular junction (b), and ascending aorta (c). Cross-sectional area from end diastole was used for calculation of the average diameter.

Cross-sectional area: comparison between patients and normal individuals
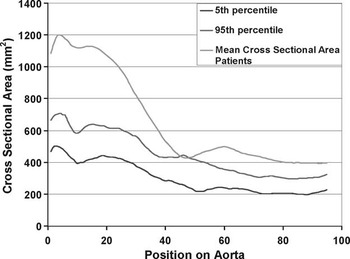
The average cross-sectional area along the entire length of the thoracic aorta calculated for the normal individual and patient groups is plotted in Figure 3. For patients with both pre- and post-surgical scans during the study period, only pre-surgical scans were included. The average cross-sectional area at the aortic root and ascending and descending aorta for the patient group was significantly greater when compared to the cross-sectional area 95th percentile from the normal group (p-value less than 0.05). Values in the mid-transverse arch were similar in both groups.
Cross-sectional area as a function of position on aorta: patients versus normal groups. Comparison of mean cross-sectional area per position on the aorta – positions along the aorta numbered from 1 corresponding to the aortic valve to 95 corresponding to the diaphragm – is shown for patients with known or suspected connective tissue disease and the mean cross-sectional area 5th–95th percentile for the normal group.

Individual segmentation examples
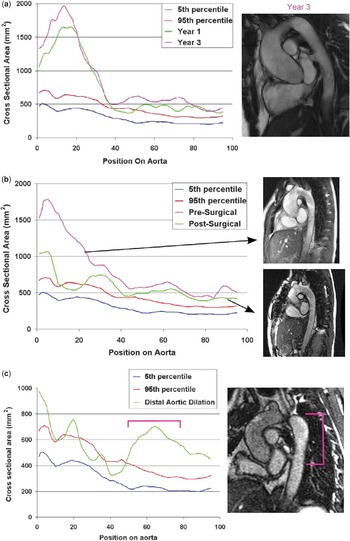
Specific patient examples highlight the ability of this analysis and display method of the entire thoracic aorta to quantitate features recognised qualitatively in the magnetic resonance images. A strength of the image analysis and display method is that aortic dimensions at identical levels along the entire thoracic aorta can be aligned to serial studies on an individual patient. Figure 4a shows the cross-sectional area of the aorta on a patient with thoracic aortic aneurysm syndrome over a 3-year period. The cross-sectional area for the aortic root and ascending aorta was well above the 95th percentile for normal. Serial scans showed a mild-progressive increase in the aortic root cross-sectional area. Note that a cross-sectional area of 2000 squared millimetres corresponds to a calculated circular cross-sectional diameter of 50 millimetres, cross-sectional area of 1000 squared millimetres corresponds to a diameter of 35 millimetres, and 500 squared millimetre to 25 millimetres.
Patient examples: (a) aortic root dilation. Cross-sectional area per position on aorta in a patient with thoracic aortic aneurysm syndrome. Cross-sectional area in the aortic root and ascending aorta – positions 1–30 – was significantly greater than the 95th percentile compared to the normal group. Mild dilation was seen in the area of the aortic root and ascending aorta over a 3-year period, although the images were similar (year 1 image not shown). (b) Aortic root replacement. Aortic pre- and post-surgical cross-sectional area per position on the aorta for a Marfan patient with reference to the 5th–95th percentile for the normal group. The pre-surgical (top frame) and post-surgical (bottom frame) magnetic resonance images are shown. (c) Distal aortic dilation. Aortic cross-sectional area per position on aorta for a post-surgical Marfan patient with distal thoracic aortic dilation. The cross-sectional area 5th–95th percentile for the normal group is also shown. Corresponding regions on the patient’s cross-sectional area plot and aorta are indicated.

Figure 4b shows serial scans in a patient with Ehlers–Danlos syndrome who underwent aortic root replacement. As expected, a significant decrease in the cross-sectional area occurred on subsequent magnetic resonance images such that the ascending aorta at cross-sectional positions 5–30 returned towards the normal range. The magnetic resonance images show an obvious visual reduction in the calibre of the aortic root and the ascending aorta.
Figure 4c shows a post-surgical scan in a patient with Marfan syndrome who underwent aortic valve and root replacement. The proximal two-thirds of the aorta reflect the post-surgical changes and are near or within the normal range for the cross-sectional area when compared to the normal group. An abrupt increase in the distal aortic cross-sectional area can also be seen demonstrating post-surgical descending aortic dilation. This distal dilation can visually be seen in the magnetic resonance image just beyond the transverse arch.
Regional cross-sectional analysis
Figure 5 shows the potential utility of examining the serial changes for a region of the aorta in the follow-up of patients with connective tissue diseases. Shown is the average cross-sectional area per region of thoracic aorta for patients compared to normals. The graph shows comparisons at sections 1–30, 31–50, and 51–95 from the aortic segmentations, which correspond to the ascending aorta, transverse arch, and descending aorta. All three regions showed significantly greater average cross-sectional area in the patient group compared to normals with the greatest regional difference seen in the ascending aorta. Although similar changes were seen in the diameter measurements at specific levels, this assessment of regional changes in aortic properties is possible when the entire thoracic aorta is considered.
Regional cross-sectional area. Bar graphs represent the average cross-sectional area per region of thoracic aorta. Sections 1–30 correspond to the ascending aorta; sections 31–50 correspond to the aortic transverse arch; and sections 51–95 correspond to the descending aorta. Average cross-sectional area was significantly greater in all three regions in patients compared to normals (* p-value less than 0.05 by unpaired t-test).

Discussion
Magnetic resonance imaging is being increasingly utilised in the assessment and follow-up of patients with known or suspected connective diseases.Reference François and Carr1 With the current imaging technology, the entire thoracic aorta can be clearly imaged in the majority of patients studied. However, only a fraction of the image data is typically utilised in the quantitative assessment of the aorta due to time constraints placed on the clinicians who are interpreting the images. From the limited analyses, a challenge has been to reproducibly measure the identical aortic locations on images for comparison from 1 year to the next. In addition, out-of-plane images may not capture the true cross-sectional diameter of the vessel.
We have previously described a highly automated technique that analyses the entire four-dimensional – three-dimensions plus time – magnetic resonance image data set generated during a typical imaging session of the thoracic aorta.Reference Zhao, Zhang and Wahle2 Applying this method to a young adult population of normal individuals, we developed what to our knowledge is the first presentation of the normative data for the maximum cross-sectional area for the entire thoracic aorta.Reference Johnson, Premraj and Patel5 The strength of the graphical presentation of the aortic cross-sectional area from the annulus to the diaphragm, along with the normative data, was apparent when patient data were considered. Although specific genetic diagnoses were not available for the patients that were studied, a clear distinction in the aortic cross-sectional area between the patient population and the normal individuals was evident. In addition, the post-operative normalisation of aortic dimensions and the identification of distal disease was also apparent in the patient group.
Echocardiography is still the mainstay in following patients with connective tissue diseases.Reference Pyeritz, Laschinger and Gillinov6–Reference Gott, Greene and Alejo8 This imaging modality is readily applied to younger children in whom less cooperation is needed than what is required to obtain a technically adequate magnetic resonance imaging study. In addition, the seminal work of Roman and DevereuxReference Roman, Devereux, Kramer-Fox and O’Loughlin4 has provided clear reference values for the echocardiographic measurements of the proximal ascending aorta that can be used for diagnosis and follow-up. However, there are important limitations to the echocardiographic assessment of patients with suspected aortopathy. Echocardiography typically can only adequately visualise the proximal ascending aorta making quantitation of more distal disease difficult, although standard measurement positions in the transverse arch have been defined.Reference Lopez, Colan and Frommelt9 In addition, echocardiography can potentially underestimate the maximal diameter of the aorta if the dilation is asymmetric or out of plane of the echocardiogram beam.Reference Meijboom, Groenink, van der Wall, Romkes, Stoker and Mulder10 The interrogation of the entire thorax that magnetic resonance imaging can provide overcomes these limitations. Imaging the entire aorta avoids the diagnostic inaccuracies of measuring just a few points on the proximal aorta. Disease in the more distal portion of the thoracic aorta was readily visualised using the methods described here (as shown in Fig 4c). In addition, alignment of the cross-sectional area along the entire thoracic aorta over serial imaging studies can be used to graphically represent the rate and degree of disease progression (see Fig 4a).
Surgical guidelines that have been established based on echocardiographic criteria must be modified if the new assessment of the cross-sectional area is to be incorporated in the diagnostic algorithm. Surgical replacement of the aortic root is indicated for aortic diameters greater than 5 centimetres or if the rate of increase in aortic diameter is greater than 0.5 centimetre per year.Reference Gott, Greene and Alejo8 When the cross-sectional area is considered, this would correspond to a cross-sectional area greater than 2000 squared millimetres or an increase of greater than 400 squared millimetres per year.
Novel criteria may be established when the cross-sectional area for the entire thoracic aorta is available. For example, Figure 5 showed that the average regional cross-sectional area can be calculated. By considering more than a specific cross-section, a more sensitive measure of aortic disease may be identified. Larger follow-up studies and/or inclusion of retrospective magnetic resonance imaging data from patients who developed aortic dissection may allow these novel parameters to be identified.
An obvious immediate use of the analysis and display method presented here would be in patients with known connective tissue disease who have undergone aortic root replacement. These patients are at risk for developing distal aortic dilation.Reference Carrel, Beyeler and Schnyder11–Reference Nollen, Groenink, Tijssen, Van Der Wall and Mulder15 Accurately reproducing measurements at specific locations in the distal arch is challenging and results in semi-qualitative follow-up. The methods described here readily allow serial measurements to be made and directly compared.
Calculated diameters of the aortic root from the analysed magnetic resonance images were compared to echocardiographic measurements. Although good correlation was found (Fig 2), the exact correspondence of the values could not be expected due to the inherent differences that exist between the two imaging techniques and the method of measurement. The diameters calculated from the cross-sectional area represent an average luminal diameter and thus may under- or overestimate the diameter depending on vessel asymmetry. In addition, the cross-sectional area calculated from magnetic resonance images is based on inner vessel borders as opposed to leading-edge standards used in echocardiography,Reference Roman, Devereux, Kramer-Fox and O’Loughlin4 which would underestimate vessel diameters calculated from cross-sectional area.
Magnetic resonance imaging is a powerful modality that provides complete visualisation of the entire thoracic aorta throughout the cardiac cycle. The large number of images that result from these studies has precluded a comprehensive assessment of the aorta. Utilising novel image analysis methods can extract relevant data, but the visualisation of these data is necessary in order to apply these techniques to the patient care setting. The use of the aortic cross-sectional area and the normative data for the entire thoracic aorta provides important clinical tools for following patients with connective tissue diseases and should provide the foundation for larger clinical trials utilising these measurements to confirm their clinical utility.
Acknowledgements
We thank Natalie Van Waning, ARNP, for her assistance in collection of the data and Honghai Zhang, PhD, for assistance with image analysis. This study is supported by the Grant no. NIH R01 HL071809. There are no conflicts of interest to disclose.