The Mother's Day Quarry is located in south-central Montana, USA, on the northeast edge of the Bighorn Basin near Bridger, Carbon County. Precise locality information is on file at Cincinnati Museum Center and available to qualified researchers. The quarry site comprises a monodominant assemblage of disarticulated, gracile diplodocid sauropod skeletons (identified here as Diplodocus sp. Marsh, Reference Marsh1878) and was initially studied by Myers & Storrs (Reference Myers and Storrs2007). These animals are exclusively juvenile and sub-adult individuals, based upon both the small size and limited degree of ossification of the preserved elements. Osteologically mature adults are lacking from the assemblage. Rare theropod teeth, attributable to Allosaurus sp. Marsh, Reference Marsh1877, are also present as isolated crowns. These are probably the shed teeth of scavengers, although resorption bases are not preserved in the sample. Myers & Fiorillo (Reference Myers and Fiorillo2009) interpreted the assemblage as the remains of an age-segregated sauropod herd.
Discovered in 1994, the site was worked for two seasons (1995 and 1996) by a crew from the Museum of the Rockies, Montana State University, Bozeman (Horner & Dobb Reference Horner and Dobb1997). Subsequently, from 2000 to 2012, the quarry site was operated as part of the Cincinnati Museum Center Dinosaur Field School. The project collected thousands of bones and other specimens through the participation of the many community members and students enrolled as field school attendees. Here, we review previous work on the Mother's Day Quarry, present new data and analysis of the spatial relationships of the bone-bed, and test anew the hypothesis that the assemblage represents a drought-induced, catastrophic mass-mortality followed by debris flow emplacement.
1. Geologic setting
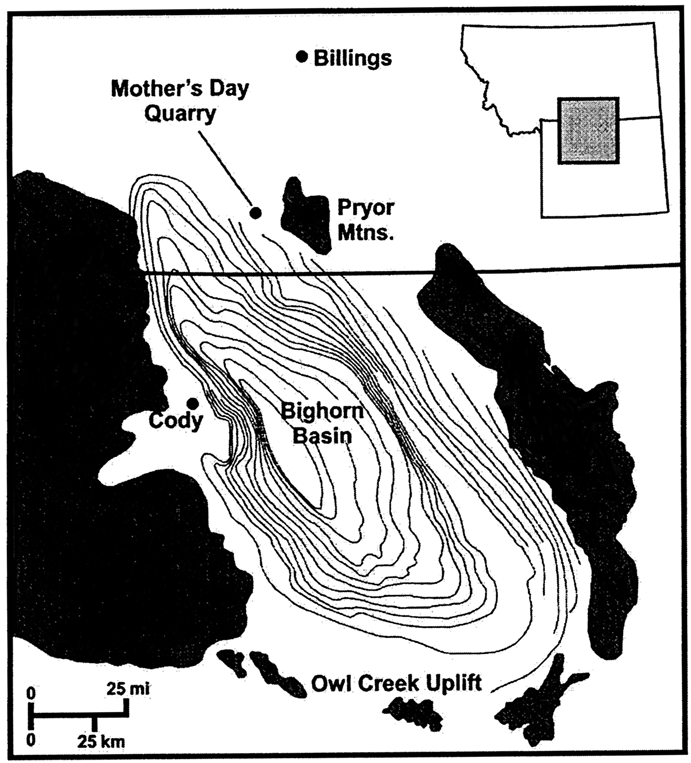
Situated within cover sediments of the northeast Bighorn Basin (Fig. 1), the Mother's Day Quarry site lies in the lower half of the Upper Jurassic Morrison Formation, approximately 12 m above the underlying Swift Formation (Myers & Storrs Reference Myers and Storrs2007). The Morrison is world-renowned for the abundance, quality and diversity of dinosaur and other fossil material it contains (Marsh Reference Marsh1896; Hatcher Reference Hatcher1901; Gilmore Reference Gilmore1925; Stovall Reference Stovall1938; Madsen Reference Madsen1976; McIntosh Reference McIntosh1981, Reference McIntosh, Weishampel, Dodson and Osmólska1990; Madsen et al. Reference Madsen, McIntosh and Berman1995; Bakker Reference Bakker and Morales1996; Kohl & McIntosh Reference Kohl and McIntosh1997; Chure et al. Reference Chure, Litwin, Hasiotis, Evanoff and Carpenter1998b; Kirkland et al. Reference Kirkland, Carpenter, Hunt and Scheetz1998; Lockley et al. Reference Lockley, Foster and Hunt1998; Monaco Reference Monaco1998; Madsen & Welles Reference Madsen and Welles2000; Foster Reference Foster2003, Reference Foster2007; Mateus Reference Mateus, Foster and Lucas2006). Its widespread depositional basin stretched from present day New Mexico to Saskatchewan and from Utah to Kansas. A terrestrial unit, it is composed of thick, variegated mudstones, truncated channel and thin stringer sandstones, siltstones, conglomerates and occasional lacustrine limestones. These deposits originated from the erosion of ancestral uplifts to the SW and were deposited by major fluvial systems over a broad, low-lying floodplain with occasional lacustrine environments (Dodson et al. Reference Dodson, Behrensmeyer, Bakker and McIntosh1980). Radiometric dates based upon altered volcanic ash layers fall within the range of 148 to 155 million years (Kowallis et al. Reference Kowallis, Christiansen and Deino1991, Reference Kowallis, Christiansen, Deino, Peterson, Turner, Kunk and Obradovich1998; Steiner Reference Steiner1998).
Regional situation of the Mother's Day Quarry site between the Beartooth (W) and Bighorn (E) uplifts at the NE edge of the Bighorn Basin, Carbon County, Montana, USA (after Myers & Storrs Reference Myers and Storrs2007).

Morrison palaeosols, plant taphofacies and other palaeoclimatic evidence indicate that the region was dominated by a seasonal, semi-arid palaeoenvironment (Demko & Parrish Reference Demko and Parrish1998; Demko et al. Reference Demko, Currie and Nicoll2004; Parrish et al. Reference Parrish, Peterson and Turner2004). Carbonate (caliche) nodules, which are good pedogenic indicators of semi-arid conditions (Dunagan & Turner Reference Dunagan and Turner2004), have been found in abundance by the authors at the Mother's Day Quarry, and support this interpretation. The Morrison's stacked palaeosol sequences, with widespread exposures of oxidised sediments, indicate frequent lowering of the ancient water table (Demko et al. Reference Demko, Currie and Nicoll2004). Herbaceous vegetation is by far the most abundant botanical material preserved, suggesting that an extensive savannah is the closest modern analogue for the Morrison palaeoenvironment (Parrish et al. Reference Parrish, Peterson and Turner2004).
It appears that the large fluvial systems of the Morrison basin, represented by large channel sandstone bodies, crevasse splay sandstones and siltstones and broad floodplain mudstones, were fed by seasonal, perhaps monsoonal, rains, while limited riparian forests were separated by extensive, resource-poor, savannah-like plains. Ephemeral water bodies dotted the landscape. The main source of water for the region lay not in precipitation, but in groundwater levels that could fluctuate considerably (Demko et al. Reference Demko, Currie and Nicoll2004; Dunagan & Turner Reference Dunagan and Turner2004). An abnormally arid dry season would result in a large drop in the water table, causing the high evaporation rate to dry out the waterholes.
Large-bodied herbivores, primarily represented by a diverse sauropod dinosaur assemblage, were the dominant faunal elements of the Morrison palaeoenvironment. The diversity of sauropods may have resulted because advantageous surface-to-volume ratios allow large animals to survive preferentially in seasonally harsh climates, although a variety of physiological factors have been suggested for sauropod gigantism (Sander & Clauss Reference Sander and Clauss2008; Clauss Reference Clauss, Klein, Remes, Gee and Sander2011). In general, however, maximal body size in vertebrates is determined by the quantity and quality of available resources relative to the consumer's mobility and its rate of energy expenditure (McNab Reference McNab2009). Such factors are directly related to resource availability in harsh, especially arid, environments.
The geographic position of the Mother's Day Quarry approaches the northernmost surface expression of the Morrison Formation and is well north of the centre of the Morrison depositional basin. Here, the formation is not divided into members, as is typical for the thicker sediments on the Colorado Plateau, (for example, Stokes Reference Stokes1944; Craig et al. Reference Craig, Holmes, Cadigan, Freeman, Mullers and Weir1955; Kowallis et al. Reference Kowallis, Christiansen, Deino, Peterson, Turner, Kunk and Obradovich1998; Peterson Reference Peterson1988; Peterson & Turner Reference Peterson and Turner1998; Turner & Peterson Reference Turner and Peterson1999, Reference Turner and Peterson2004), but is apparently correlative with the Kimmeridgian Salt Wash Member of the Morrison (Myers & Storrs Reference Myers and Storrs2007). The site includes an average regional dip of 20o W, as the sediments within which it lies have undergone gentle deformation as part of the Laramide Orogeny, sitting as they do upon the western flank of the Pryor Mountains uplift. As a result, fossils within the quarry are often fractured, crushed and otherwise deformed. In fact, the quarry itself is crosscut by several small-scale faults (Δd<0·1 m) filled with secondary calcite.
The fossils of the bone-bed are contained within a largely homogenous, massive, muddy, grayish-yellow siltstone approximately 4 m thick. It can be inferred from the sedimentary homogeneity of the bone-bed that it was not formed as a gradual accumulation deposited by multiple events, but rather represents a single depositional event. The unit lies directly upon a hard, well-cemented, yellow-brown (moderate yellow, sensu Munsell 2009) sandstone defining the quarry floor. Neither primary sedimentary structures nor sorting of bones are apparent, but clay intraclasts and rare, poorly-consolidated sand bodies are present (Myers & Storrs Reference Myers and Storrs2007). Palaeopedogenic carbonate nodules contained within the quarry apparently were not produced in situ, but have been transported and secondarily deposited, as evidenced by their random distribution within the deposit, both geographically and stratigraphically.
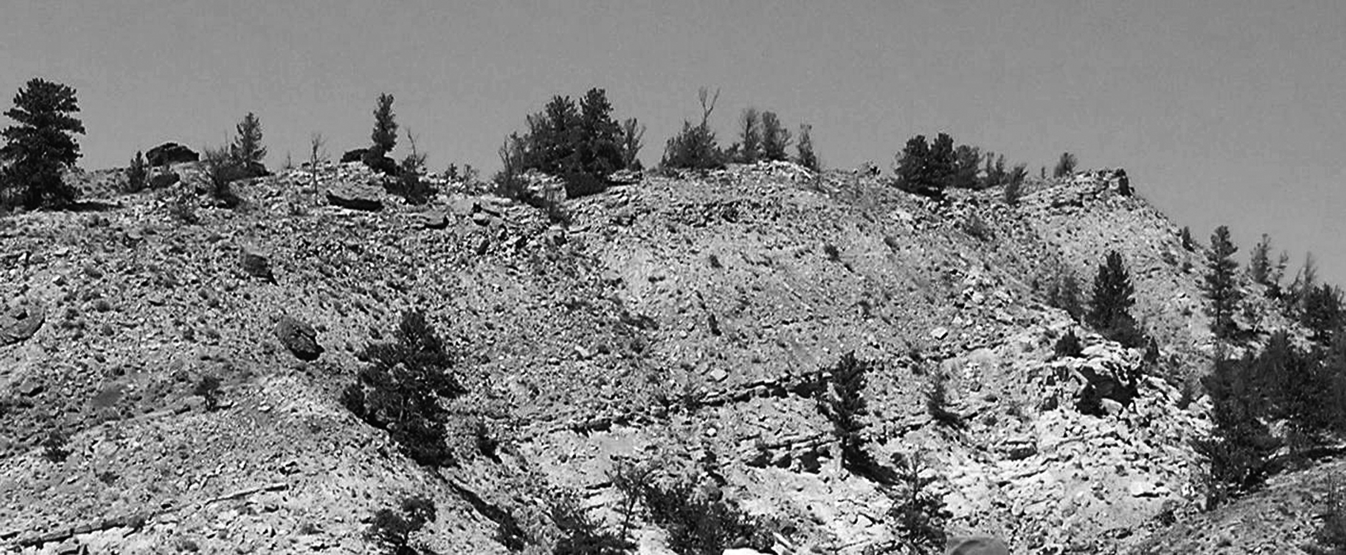
Due to the nature and location of the quarry, with its long history of erosion and excavation, a complete section cannot be measured to determine the exact thickness of the deposit. (Myers & Storrs Reference Myers and Storrs2007 determined thicknesses of 2·5–3·0 m by the use of a composite profile from test pits within the quarry.) However, a large escarpment near the quarry (Fig. 2) provides excellent exposures of the strata directly above, below and possibly within the Mother's Day deposit. A trench dug across the hillside during this present study allowed direct measurement of the thickness of stratigraphic units, as noted against a line suspended over them at a fixed angle relative to the horizontal. The true vertical thickness (at that specific point) of a potentially correlative bone-bearing deposit was then determined trigonometrically and corrected, based upon the regional dip of the beds. At least two bone-bearing deposits have been identified on the hillside, making it necessary to verify which may be correlative with the quarry. The capping sandstone bed at the quarry site was correlated visually with similar beds exposed down the hillside, and by using a standard surveying transit (DeWalt DW090 Builder's Transit). The resulting calculated stratigraphic thickness of 3.96 m compares well with the estimate of Myers & Storrs (Reference Myers and Storrs2007), when the variable depth of the lower bounding surface of the fossiliferous deposit is taken into consideration.
Escarpment of Morrison Formation exposures adjacent to the Mother's Day Quarry site.
Modern topography and erosional contours limit the amount of deposit remaining to the north and east of the Mother's Day Quarry. However, the full extent of the deposit has not been excavated to the south and west, although increasing amounts of overburden hinder exploration in those directions. Nevertheless, the nearby escarpment and its contained bones demonstrate that the original deposit may have been extensive.
2. Palaeontology and palaeobiology
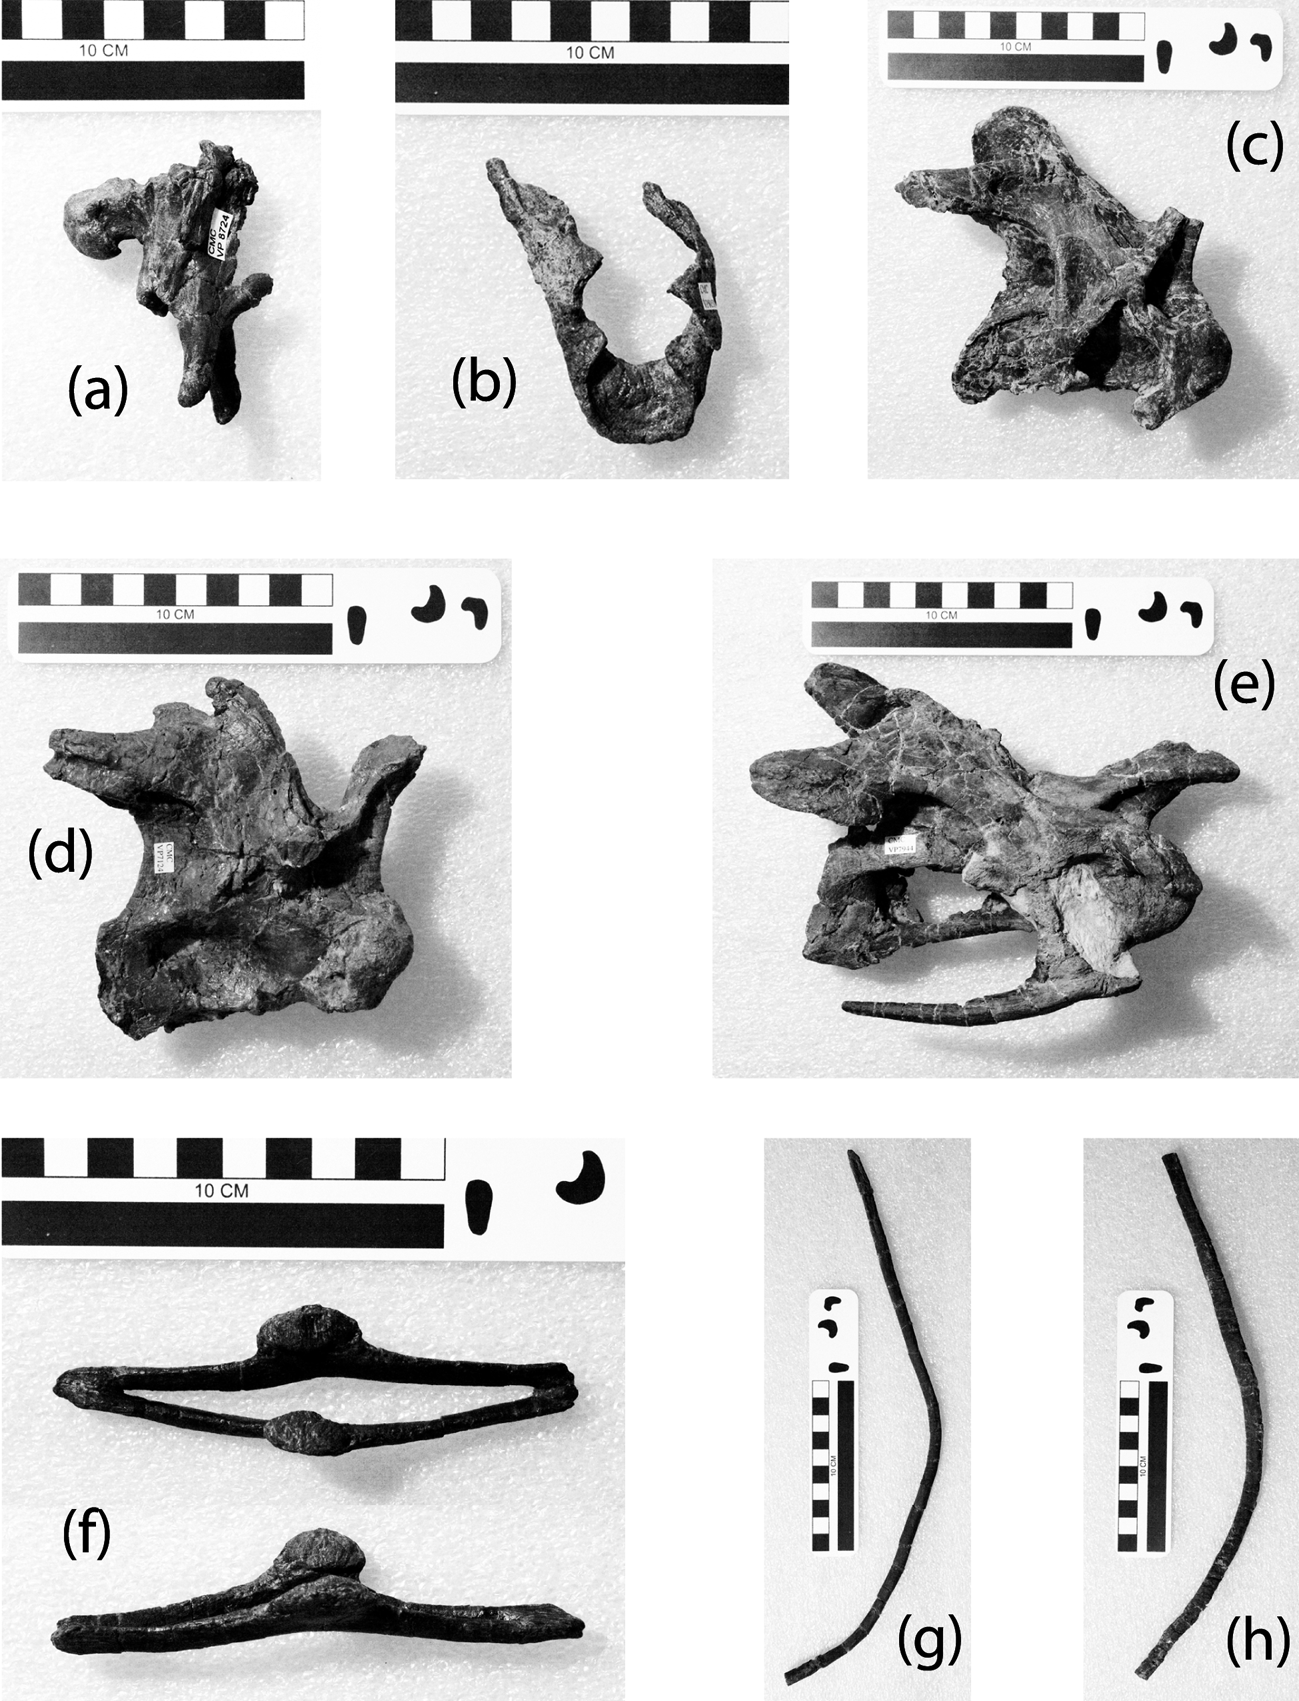
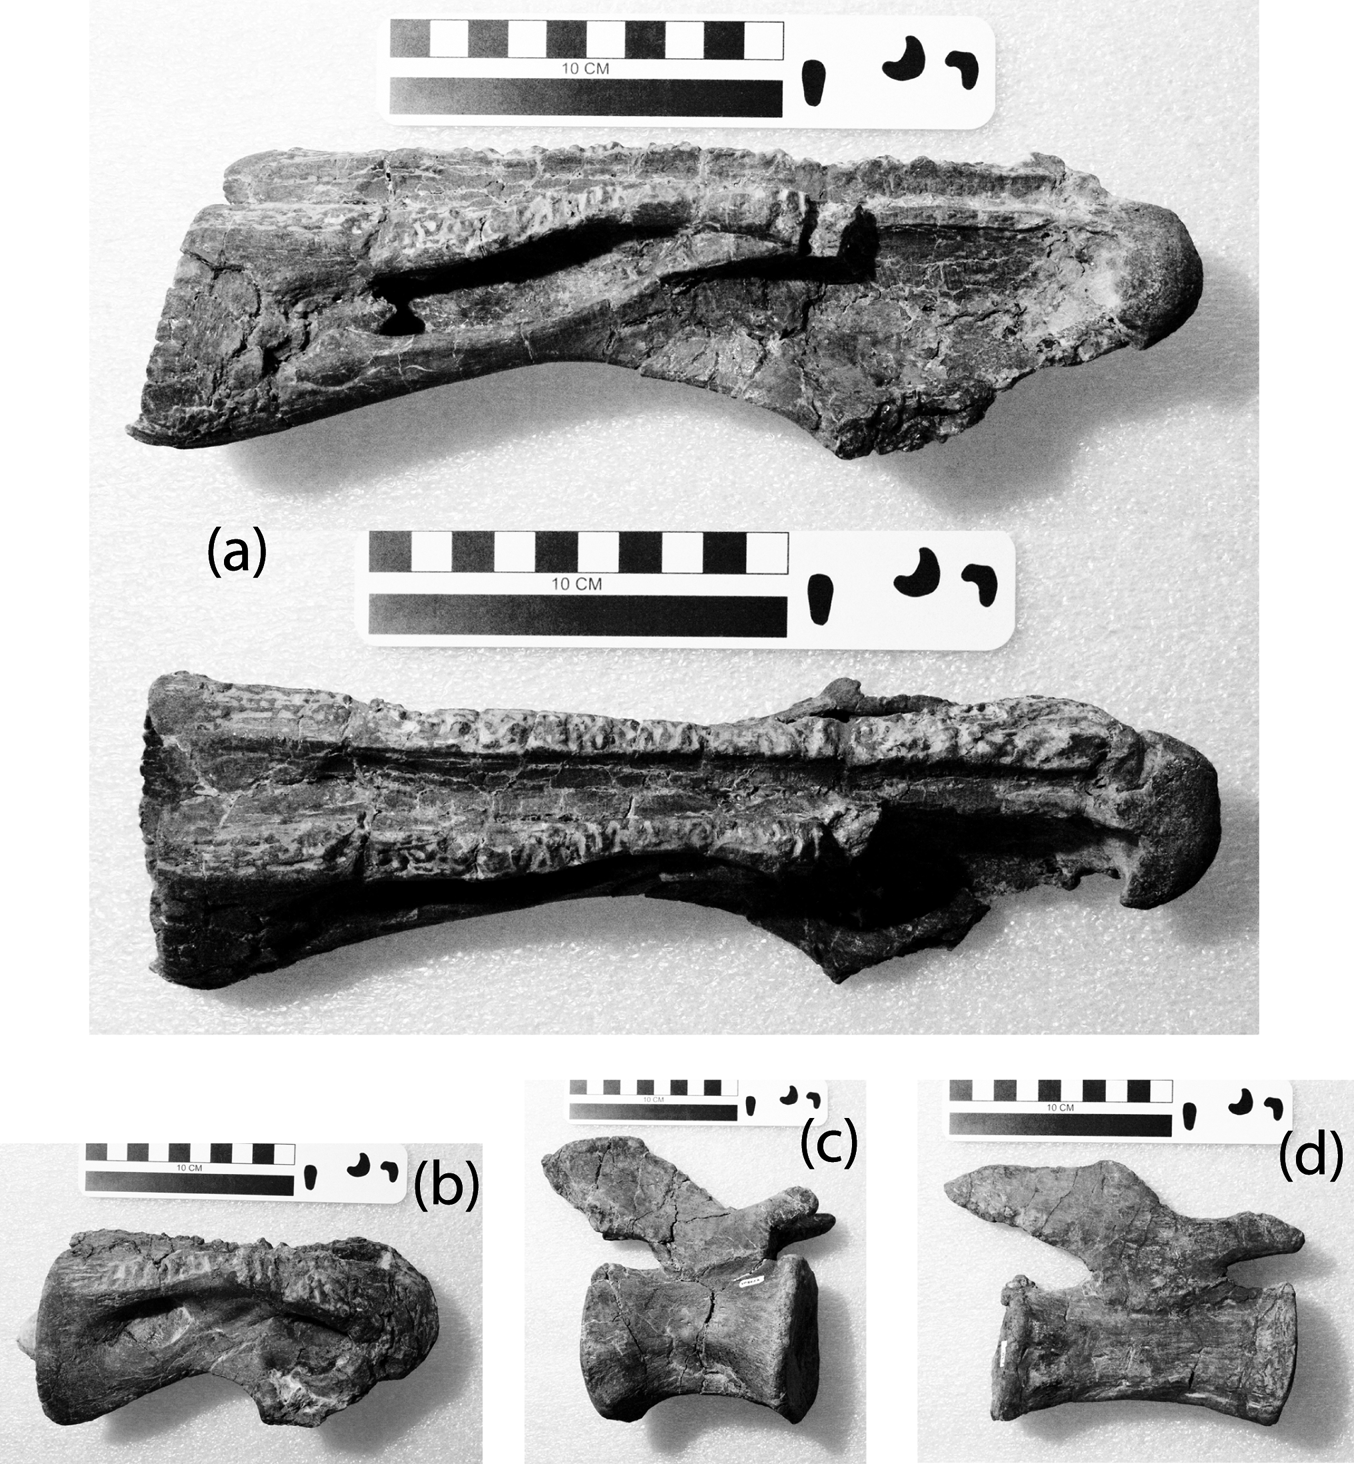
In contrast to the high faunal diversity displayed by many Morrison Formation fossil deposits, the Mother's Day Quarry site can be characterised as a monodominant assemblage. The bones preserved represent a single taxon of gracile diplodocid and are assigned here to Diplodocus sp. Marsh, Reference Marsh1878, based upon the following diagnostic characters. The skull is delicately constructed with a lengthened rostrum and weak, narrow-crowned teeth restricted to the anterior margins of the jaws, the posterior cervical and anterior dorsal vertebrae possess bifurcate neural spines, and the posterior caudal chevrons are of the distinctive “double-beam” variety, as is typical for Diplodocidae (Hatcher Reference Hatcher1901; Holland Reference Holland1906; McIntosh Reference McIntosh, Weishampel, Dodson and Osmólska1990; Wilson Reference Wilson2002; Upchurch et al. Reference Upchurch, Barrett, Dodson, Weishampel, Dodson and Osmólska2004a). However, the teeth lack apical wear facets, indicating lack of occlusion, as in Diplodocus Marsh, Reference Marsh1878 (Barrett & Upchurch Reference Barrett, Upchurch, Curry Rogers and Wilson2005). Additionally, the appendicular elements are slender relative to those of, e.g. Apatosaurus Marsh, Reference Marsh1877, as are the relatively elongate cervical vertebrae (Figs 3–5), and bear close resemblance to those illustrated for Diplodocus Marsh, Reference Marsh1878 (Hatcher Reference Hatcher1901; Holland Reference Holland1906; Wilhite Reference Wilhite, Tidwell and Carpenter2005). The longitudinal ventral trough in each caudal centrum of the Diplodocus Marsh, Reference Marsh1878 genoholotype (McIntosh & Carpenter Reference McIntosh and Carpenter1998) is only variably present in Mother's Day Quarry specimens, and none is particularly deep. However, this condition likely reflects the juvenile and subadult nature of the specimens and the variable degree and orientation of the ubiquitous diagenetic compression of the bones. As is diagnostic for Diplodocus Marsh, Reference Marsh1878, the lengthened cervical vertebrae are relatively shorter than in Barosaurus Marsh, Reference Marsh1890 (Lull Reference Lull1919; McIntosh Reference McIntosh, Tidwell and Carpenter2005), and all elements are far more delicate than the robust bones of Apatosaurus Marsh, Reference Marsh1877 (Riggs Reference Riggs1903; Gilmore Reference Gilmore1936; Upchurch et al. Reference Upchurch, Tomida and Barrett2004b), the other two relatively common Morrison diplodocids (Hatcher Reference Hatcher1901; Holland Reference Holland1906; Wilhite Reference Wilhite, Tidwell and Carpenter2005).
Representative specimens of juvenile diplodocid bones (Diplodocus sp. Marsh, Reference Marsh1878) from the Mother's Day Quarry: (a) basicranium CMC VP9724 in right lateral view; (b) atlas vertebra CMC VP8058 in anterior view; (c) anterior cervical vertebra CMC VP9134 in right lateral view; (d) anterior cervical vertebra CMC VP7124 in right lateral view; (e) middle cervical vertebra CMC VP7944 in right lateral view; (f) “double beam” chevron CMC VP7753 in dorsal and lateral views; (g) gastralium CMC VP9135; (h) gastralium CMC VP9137. Scale bars=10 cm.
Representative specimens of juvenile diplodocid bones (Diplodocus sp. Marsh, Reference Marsh1878) from the Mother's Day Quarry: (a) posterior cervical vertebral centrum CMC VP8693 in right lateral and dorsal views; (b) middle cervical vertebral centrum CMC VP8694 in right lateral view; (c) middle caudal vertebra CMC VP8652 in right lateral view; (d) posterior caudal vertebra CMC VP7933 in right lateral view. Scale bars=10 cm.
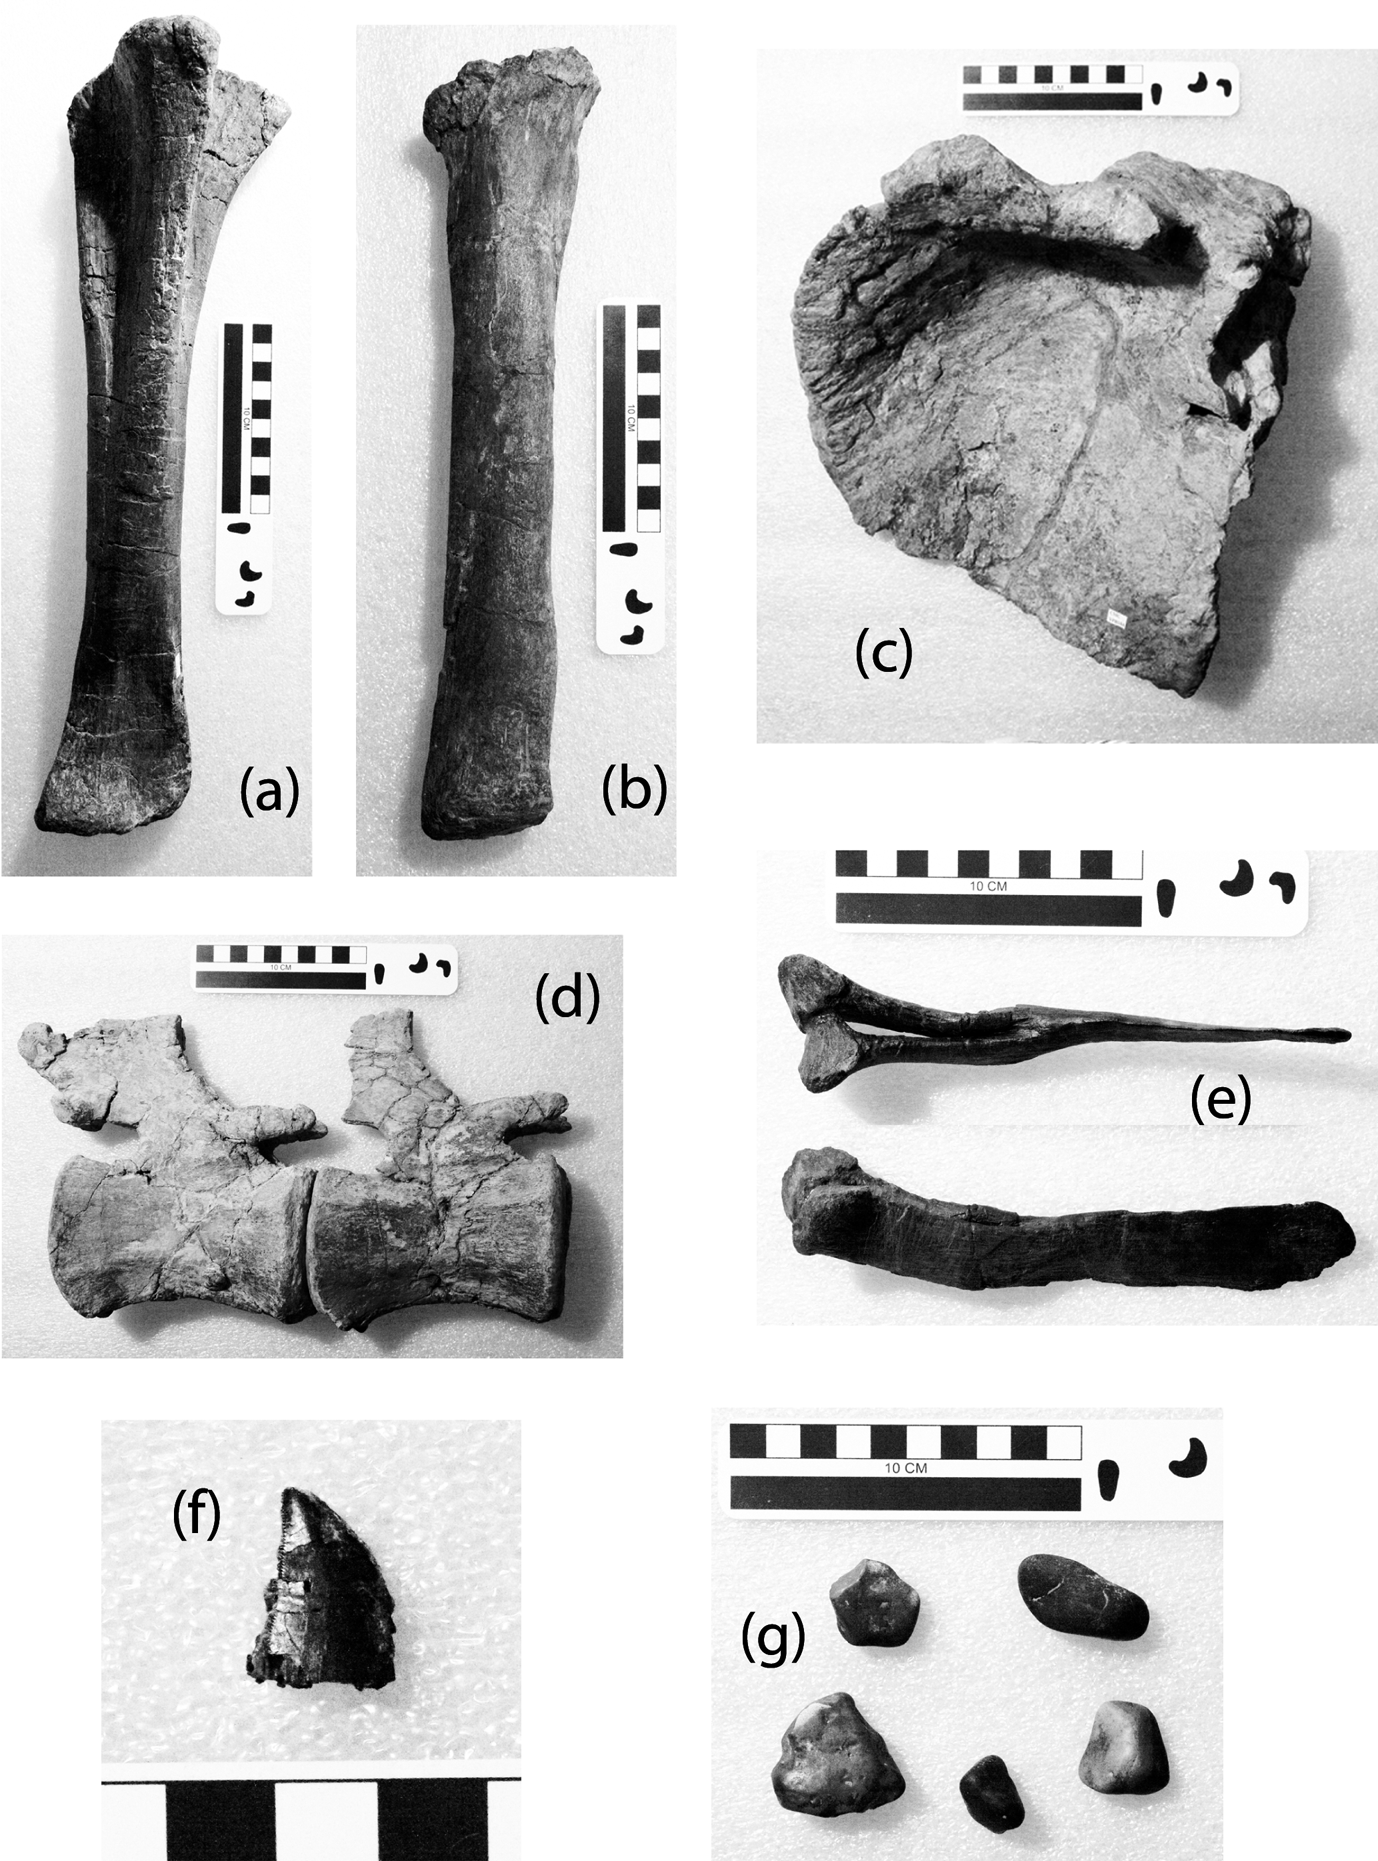
Representative specimens of juvenile diplodocid bones (Diplodocus sp. Marsh, Reference Marsh1878) and other fossils from the Mother's Day Quarry: (a) ulna CMC VP8045; (b) radius CMCVP8681; (c) coracoid CMC VP8044; (d) articulated middle caudal vertebrae CMC VP8499; (e) proximal chevron CMC VP8529 in posterior and left lateral views; (f) tooth of Allosaurus Marsh, Reference Marsh1877; (g) presumed gastroliths of Diplodocus sp. Marsh, Reference Marsh1878. Scale bars=10 cm.
The known material of the rare diplodocids Supersaurus Jensen, Reference Jensen1985 and Amphicoelias Cope, Reference Cope1877, if truly distinct, does not afford ready comparison with the Mother's Day material, but appears distinguishable based upon the stated autapomorphies of those taxa (Osborn & Mook Reference Osborn and Mook1921; Lovelace et al. Reference Lovelace, Hartman and Wahl2007). All of the known specimens of these two genera come from adult individuals. The plesiomorphic Morrison diplodocoid Suuwassea Harris & Dodson, Reference Harris and Dodson2004, known from a single small, yet adult, individual, may be differentiated particularly by its relatively narrow and elongate cervical neural spines and large proximal tuberculum of the humerus. A rectangular proximal articular surface of the tibia may also be diagnostic (Harris Reference Harris2006, Reference Harris2007). Neither of these features is seen in the Mother's Day sample.
Over the course of a decade, well over 2,000 skeletal elements have been collected from the Mother's Day Quarry by teams led by the senior author (in addition to the 502 identifiable specimens collected by the Museum of the Rockies in the mid 1990s). Precise numbers are not yet available, because many specimens await preparation. These bones come from throughout the skeleton, with proportional representation of each skeletal element (e.g., Figs 3–6). Myers & Storrs (Reference Myers and Storrs2007) determined the minimum number of individuals (MNI) represented in the deposit at eight, using data obtained through 2003, and based upon the number of collected specimens of metatarsal I (Mt I). New examination of the prepared and recently collected specimens of Mt I, plus material at the Museum of the Rockies, demonstrates the presence of thirteen examples of left Mt I and nine of right Mt I. Additionally, there are now ten right astragali in the sample and nine left astragalus specimens. These metatarsals and astragali are currently the most common determinable elements in the Mother's Day sample. At first glance, this circumstance allows an increase of the MNI estimate to thirteen. However, mirrored elements (left vs. right) were additionally differentiated based upon element length, ranging from 7·5 cm to 12 cm for the metatarsals and from 10·5 cm to 19·5 cm for the astragali. It is clear that at least one extremely young individual is represented by a right Mt I that is not matched by a complementary left example; there are two such young animals uniquely represented by right astragali. At minimum then, fifteen individuals are now known to be present in the Mother's Day Quarry bone-bed.
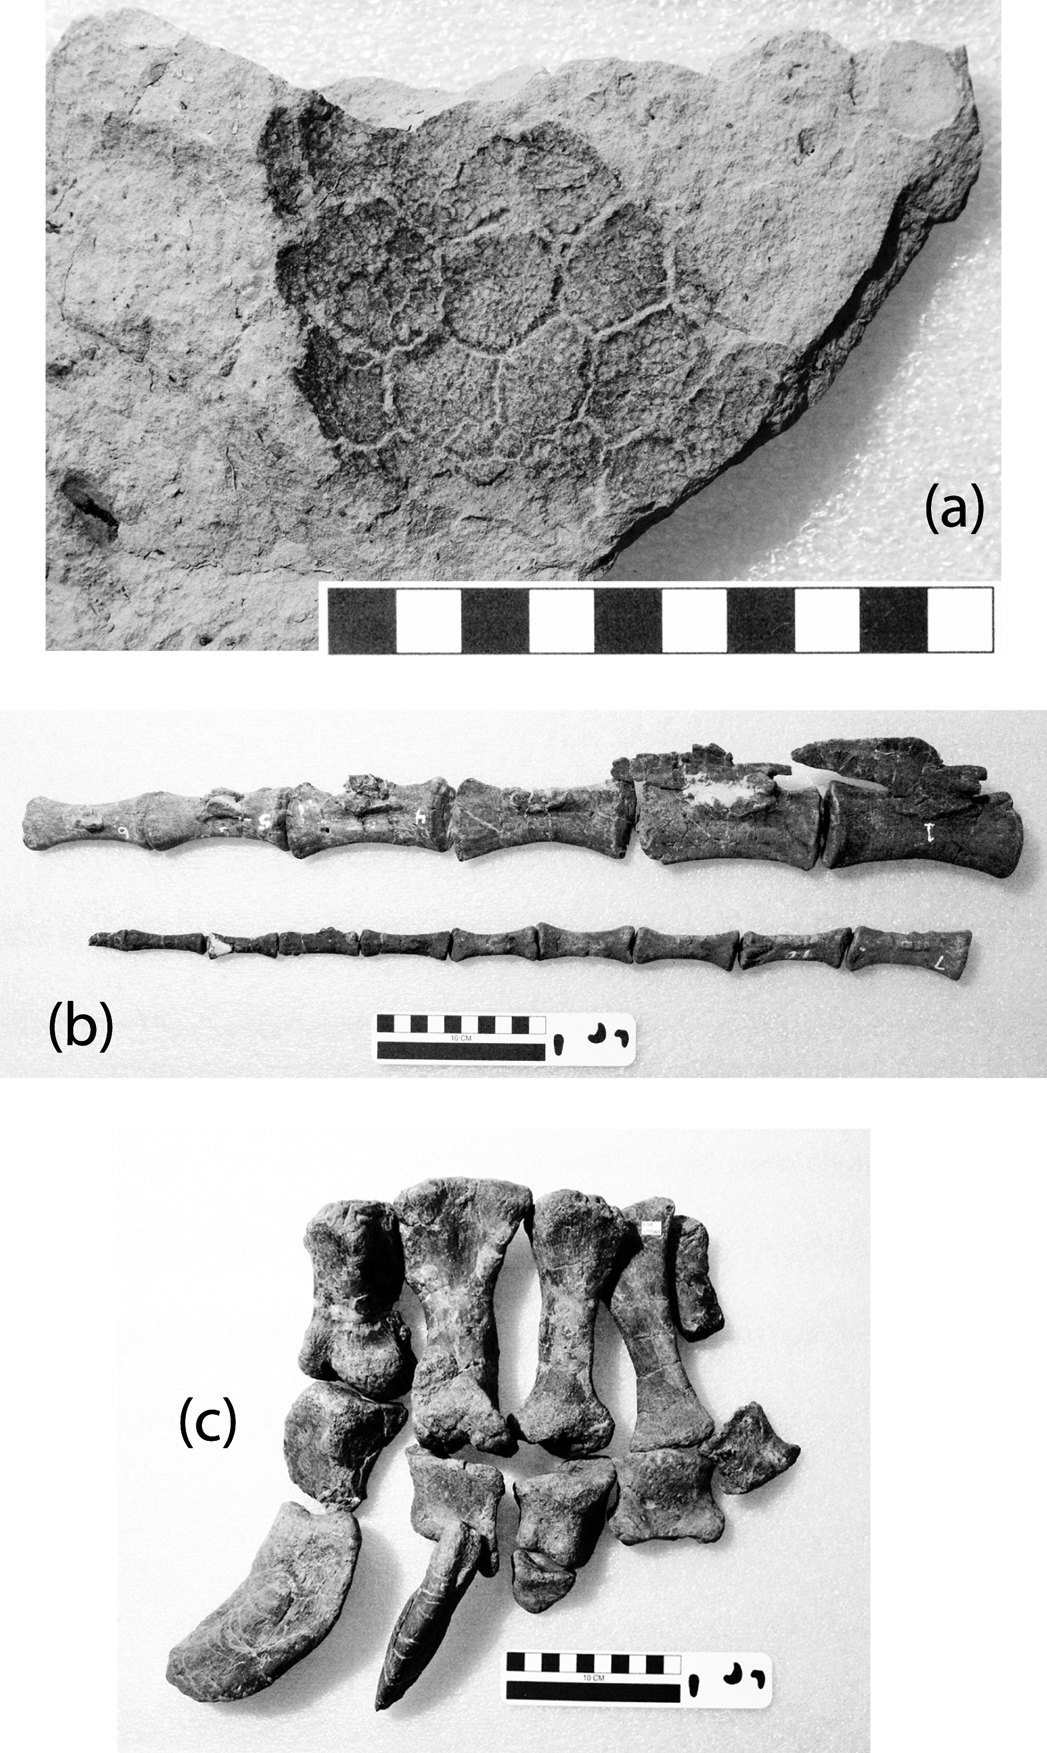
Examples of Diplodocus sp. Marsh, Reference Marsh1878 fossils from the Mother's Day Quarry suggestive of carcass desiccation: (a) skin textural impression and adhering carbonaceous film CMC VP8075; (b) sixteen articulated distal caudal vertebrae CMC VP9136 in right lateral view; (c) articulated right pes CMC VP8004.
The largest prepared Mother's Day humerus (Cincinnati Museum Center CMC VP7746), compared with the estimated length of the smallest adult Diplodocus Marsh, Reference Marsh1878 at the Carnegie Museum, Pittsburgh, USA (CM-94), is 74% of adult size, placing it just within the range for sub-adults (Meyer & Storrs 2007). Using this comparison as a baseline, the size of the smallest prepared humerus now available (CMC VP9133) is 53% that of an adult. Similarly, epipodial specimens examined here range from 75% to 38% of adult size. While small, the osteologically immature nature of the preserved bones is attested to by their poorly formed articular surfaces and unfused sutures. Sexual maturity, or lack thereof, cannot be determined.
Among the preserved bones, approximately one dozen theropod teeth (identified as Allosaurus sp. Marsh, Reference Marsh1877) have been found scattered throughout the deposit (Fig. 5). A single bivalved crustacean (conchostracan), c.f. Lioestheria sp. (sensu Tasch Reference Tasch1987) has been recovered from the deposit. Conchostracans are believed to be indicative of small, ephemeral lacustrine environments (Tasch Reference Tasch1987; Webb Reference Webb1979; Lucas & Kirkland Reference Lucas and Kirkland1998). Macerated but indeterminate botanical material is commonly preserved as carbonised remains and impressions. These are dispersed throughout the bone-bearing unit. They no doubt represent fragments of gymnosperm leaf and other fragments, and include small pieces of carbonised wood that retain no identifiable structure. No trace fossils have been found.
Also present within the deposit are numerous (to date 400+) well-rounded, dark gray chert pebbles (Fig. 5) that by virtue of their size (0.5–5.0 cm) and composition, are clearly allochthonous. These are generally distributed randomly among the bones, as recent excavations have extended the depth distribution of both pebbles and bones below the concentration identified by Myers & Storrs (Reference Myers and Storrs2007). Myers & Storrs (Reference Myers and Storrs2007) were unable to identify the origin of the stones definitively, particularly in light of a suggestion that supposed Cloverly Formation “gastroliths,” common in the rocks overlying the Morrison, are in reality pebble clasts related to debris flow movements (Zaleha & Wiesemann Reference Zaleha and Wiesemann2005). However, at least some sauropod taxa apparently did possess “stomach stones” (Manley Reference Manley1993; Sanders et al. Reference Sanders, Manley, Carpenter, Tanke and Carpenter2001; Jennings & Hasiotis Reference Jennings and Hasiotis2006), and the Mother's Day Quarry clasts could be derived from the decaying diplodocid carcasses. A notable recent discovery in the quarry is an associated accumulation of approximately one dozen similarly-sized pebbles concentrated amid a mass of carbonaceous debris. This debris is here interpreted as stomach contents, or a similar mass from the digestive tract, and the stones therefore likely gastroliths. The relatively small size of the stones, in comparison with putative examples from other localities, may correlate with the small size of the Mother's Day animals.
The Mother's Day deposit has been interpreted as preserving an age-segregated herd, although preferential mortality of juvenile and sub-adult animals at the site cannot be ruled out. As the Mother's Day Quarry exhibits no evidence of taphonomic bias due to differential transport or attritional accumulation, it may be a reasonable representation of original herd composition (Myers & Fiorillo Reference Myers and Fiorillo2009). Certainly, sauropods travelled in herds, as is well evidenced by preserved trackways, some of which may have been age-segregated into juvenile-only assemblages (Lockley et al. Reference Lockley, Houck and Prince1986, Reference Lockley, Wright, White, Matsukawa, Jianjun, Lu and Hong2002; Farlow et al. Reference Farlow, Pittman, Hawthorne, Gillette and Lockley1989; Lockley Reference Lockley1991; Barnes & Lockley Reference Barnes and Lockley1994; Day et al. Reference Day, Upchurch, Norman, Gale and Powell2002; Wright Reference Wright, Curry Rogers and Wilson2005). In any case, taphonomic and sedimentological considerations strongly suggest a single, mass-mortality accumulation of the sauropods of the Mother's Day Quarry site, whatever the herd composition (Myers & Storrs Reference Myers and Storrs2007).
3. Taphonomy
Several taphonomic features of significance have been observed at the site (Myers & Storrs Reference Myers and Storrs2007; this study). Firstly, the bones show little post-mortem modification such as breakage or abrasion, and delicate structures such as vertebral laminae, cervical ribs, chevrons and gastralia are usually preserved intact (Fig. 3). Only two specimens (e.g. the femur CMC VP 7747 noted by Myers & Storrs Reference Myers and Storrs2007) are known to display bite marks, the apparent result of scavenging activity by theropod dinosaurs (Chure et al. Reference Chure, Fiorillo and Jacobsen1998a). Some of the bone surfaces, however, exhibit poor preservation, obscuring the characterisation of taphonomic influences on those elements. There is, additionally, vertical crushing and distortion of many bones, related to diagenetic compaction of their entombing matrix and the tectonic history of the region. Nevertheless, the majority of bones do not appear to display any significant pre-depositional modification (i.e. weathering, trampling, boring, etc.) apart from minimal traces of scavenging and the rare fractured rib. The general lack of modification suggests that the bones were not exposed at the surface for an extended period of time, but perhaps just long enough for carcass decay/disarticulation to begin. Also, the fine preservation of many elements indicates only a limited amount of bone transport prior to deposition (see below).
Small (3 cm or less) abraded bone clasts are present but rare, and seem to represent at least one earlier cycle of fossil deposition followed by one or more periods of reworking and redeposition. Because strong bimodal distributions in size, breakage and degree of abrasion exist between these clasts and the preserved diplodocid bones making up the bulk of the deposit's fossils, they have no direct relationship to one another.
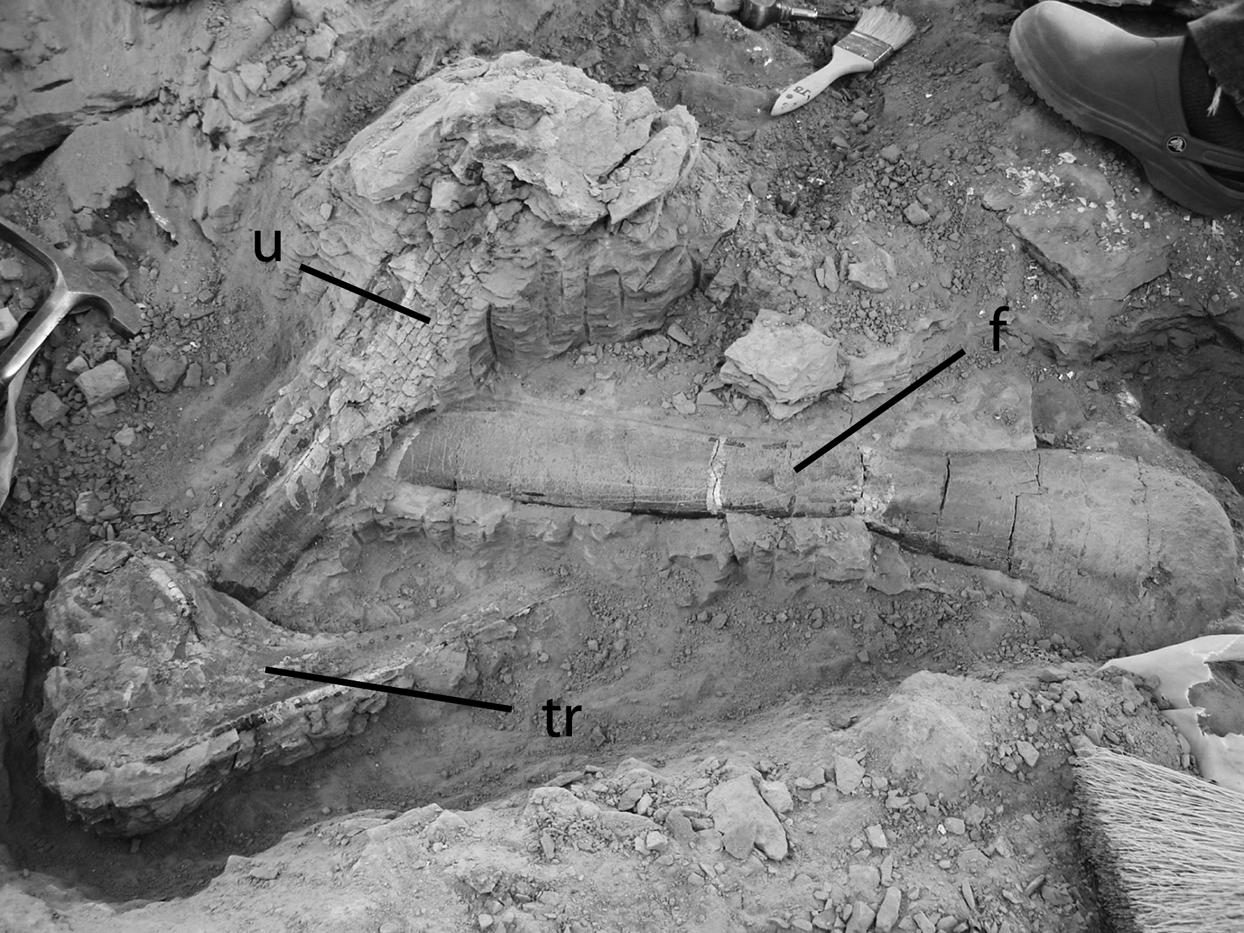
One of the more obvious characteristics observed at the site is the disarticulation of the vast majority of the diplodocid bones (Figs 3–5) (Myers & Storrs Reference Myers and Storrs2007). Most bones within the deposit are individual elements (Fig. 7), although there is also some latent articulation of associated skeletal components, such as complete manus or pedes, paired pelvic elements, sequential strings of vertebrae and epipodial pairs, for example (Figs 5, 6). Such associations are notable for an accumulation so otherwise disarticulated. These elements would have been bound by ligaments, which were apparently still present at the time of burial. Such resistance of ligaments to decay is especially true in arid environments where, in general, disarticulation proceeds proximally to distally (Hill & Behrensmeyer Reference Hill and Behrensmeyer1984). Carbonate rinds are present on some of the bones (Myers & Storrs Reference Myers and Storrs2007), suggesting decomposition of remnant non-mineralised tissue under anoxic conditions (Berner Reference Berner1968; Weigelt Reference Weigelt1989; Allison & Briggs Reference Allison, Briggs, Allison and Briggs1991). Representations of diplodocid skin, in the form of carbonised films on textural impressions that display distinctive patterning, are present and relatively common at the quarry (Fig. 6a). In arid environments, skin can dry, toughen and remain long after other soft tissues have decayed away. These clues are clear evidence of dessication of the dinosaur carcasses prior to final burial. The presence of skin and ligaments at the time of burial not only indicates dry conditions, but also helps set a timeframe for burial, as even desiccated soft tissues will ultimately decay if exposed for an extended period.
Examples of randomly deposited juvenile diplodocid bones in the Mother's Day Quarry. Abbreviations: f=fibula; tr=thoracic rib; u=ulna.
The disarticulation of most bones at the Mother's Day Quarry, in combination with little surface modification or breakage, suggests some limited transport prior to final deposition. Fluvial agents such as rivers and streams often transport material moderate to long distances. In such cases, bed load clasts may become sorted according to size and mass, and significant rounding and breakage of bones is common (Voorhies Reference Voorhies1969; Behrensmeyer Reference Behrensmeyer1982, Reference Behrensmeyer, Ethridge, Flores and Harvey1987, Reference Behrensmeyer, Behrensmeyer and Kidwell1988; Eberth & Getty Reference Eberth, Getty, Currie and Koppelhus2005). The bones at the Mother's Day Quarry site do not show sorting or winnowing of any kind, and there is neither stratification nor sedimentary structures, suggesting that the transporting agent was not fluvial. This is in stark contrast to the situation reported by Richmond & Morris (Reference Richmond and Morris1998) for the Dry Mesa Quarry. Similarly, no imbrication of elements is evident at Mother's Day (Myers & Storrs Reference Myers and Storrs2007). However, clay intraclasts are present in abundance at the site, and heterogeneous sandy patches have been incorporated into the unit, perhaps indicative of a relatively high energy event.
Lastly, the bones have a wide range of three-dimensional orientations within the entire sedimentary depositional unit (bone-bed), although the 4 m-thick unit apparently represents a single depositional event (Fig. 7). There is the suggestion of a preferred current orientation amongst some of the elongate, elements, as discussed below. This circumstance is contrary to the situation as determined by Myers & Storrs (Reference Myers and Storrs2007). New, targeted analyses reveal a preferred alignment related to element depth within the deposit, suggesting an evolving depositional flow regime, from relatively high to somewhat lower energy environments during the duration of unit emplacement (Fig. 10).
From the clear evidence of transport, absence of sorting and imbrication, the trend and plunge profiles of buried elements, and the presence of intraformational clay clasts and other sediments consistent with a non-fluvial, high energy transport event, a hyperconcentrated debris flow likely entombed the bones (Myers & Storrs Reference Myers and Storrs2007; Myers & Fiorillo Reference Myers and Storrs2009). Dewatering of thixotropic sediments resulted in a wide range of three-dimensional bone orientations as the flow quickly solidified. Such flows travel relatively short distances, with presumably little time or opportunity for bone breakage (Benvenuti & Martini Reference Benvenuti and Martini2002; Dasgupta Reference Dasgupta2003; Rogers Reference Rogers2005; Eberth et al. Reference Eberth, Britt, Sheetz, Stadtman and Brinkman2006). Other examples of high-density debris flows containing dinosaur bones are known, although uncommon (Fastovsky et al. Reference Fastovsky, Clark, Strater, Montellano, Hernandez and Hopson1995; Rogers Reference Rogers2005; Van Itterbeeck et al. Reference Van Itterbeeck, Bolotsky, Bultynck and Godefroit2005; Eberth et al. Reference Eberth, Britt, Sheetz, Stadtman and Brinkman2006; Lauters et al. Reference Lauters, Bolotsky, Van Itterbeeck and Godefroit2008; Britt et al. Reference Britt, Eberth, Sheetz, Greenhalgh and Stadtman2009). The multiple (2–3) bone-beds recently identified in the escarpment adjacent to the Mother's Day Quarry suggest that similar conditions and circumstances may have pertained repeatedly at or near this site on separate occasions over the course of many years, contra Myers & Storrs (Reference Myers and Storrs2007). Seasonal repetition of flows also has been noted at a few other dinosaur sites (Fastovsky et al. Reference Fastovsky, Clark, Strater, Montellano, Hernandez and Hopson1995; Rogers Reference Rogers2005; Eberth et al. Reference Eberth, Britt, Sheetz, Stadtman and Brinkman2006).
4. Spatial analysis
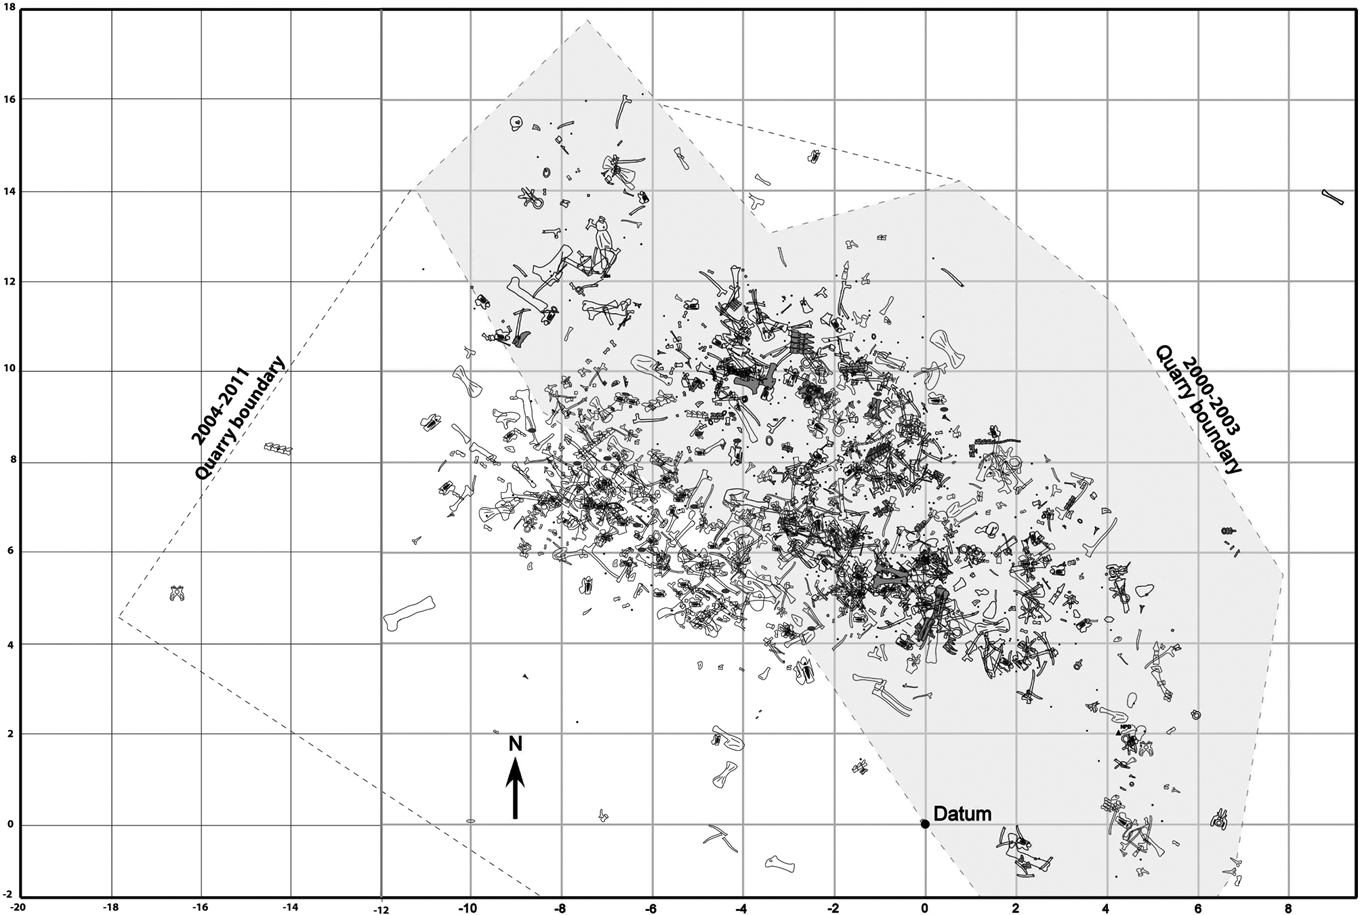
During the course of annual excavations at the quarry, mapping was carried out using a standard surveying transit (DeWalt DW090 Builder's Transit), stadia rod, laser range finder (Leica Disto D5) (in earlier years a tape and plumb bob) and Brunton pocket transit (compass). While in situ, the azimuth, or orientation relative to N, and the distance and the depth of each element collected were determined relative to a fixed datum point. The same datum was used year-to-year for compilation of total results. For elongate bones (e.g. limb elements, ribs, vertebral centra, etc.), the trend relative to N, plunge from horizontal and the length of each element were also noted. The size of all elements was measured, represented by the longest distance across each bone. The distance, depth and bearing measurements were used to determine three-dimensional Cartesian coordinates from the datum to each bone, while the plunge and trend (i.e. pitch and yaw) are vertical and horizontal rotation angles partially describing the orientation of the axis in which the length of each specimen was measured (a roll angle was not recorded). It should be noted that the resulting quarry map (Fig. 8), expanded from that of Myers & Storrs (Reference Myers and Storrs2007), does not reflect the entire geographic extent of the deposit as noted above.
Composite two-dimensional quarry map (2000–2011 excavations) of bone distributions within the Mother's Day Quarry (incorporating 2000–2003 map of Myers & Storrs Reference Myers and Storrs2007). Grid squares represent 2 m×2 m each.
The increased sample size resulting from excavations subsequent to the Myers & Storrs (Reference Myers and Storrs2007) study dictates that rose diagrams be constructed anew to test for the presence or absence of preferred bone alignments suggestive of current overprinting. Diagrams (Figs 9, 10) were generated using a freeware application developed by David Nash at the University of Cincinnati Department of Geology (Nash Reference Nash2011), and available online at: http://homepages.uc.edu/~nashdb/Software/RoseDiagram.htm.
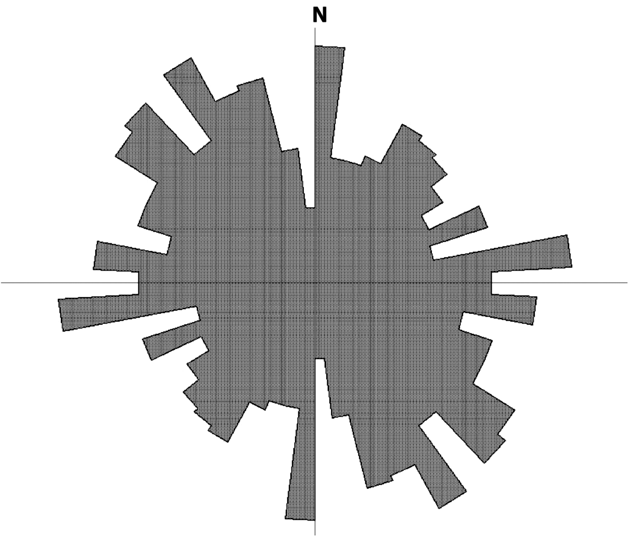
Composite rose diagram of abundance of trend values for individual elements, 2000–2011. Data are mirrored (e.g. 0o equals 180o) to reflect bipolar trends of elongate axes of bones. n=886.
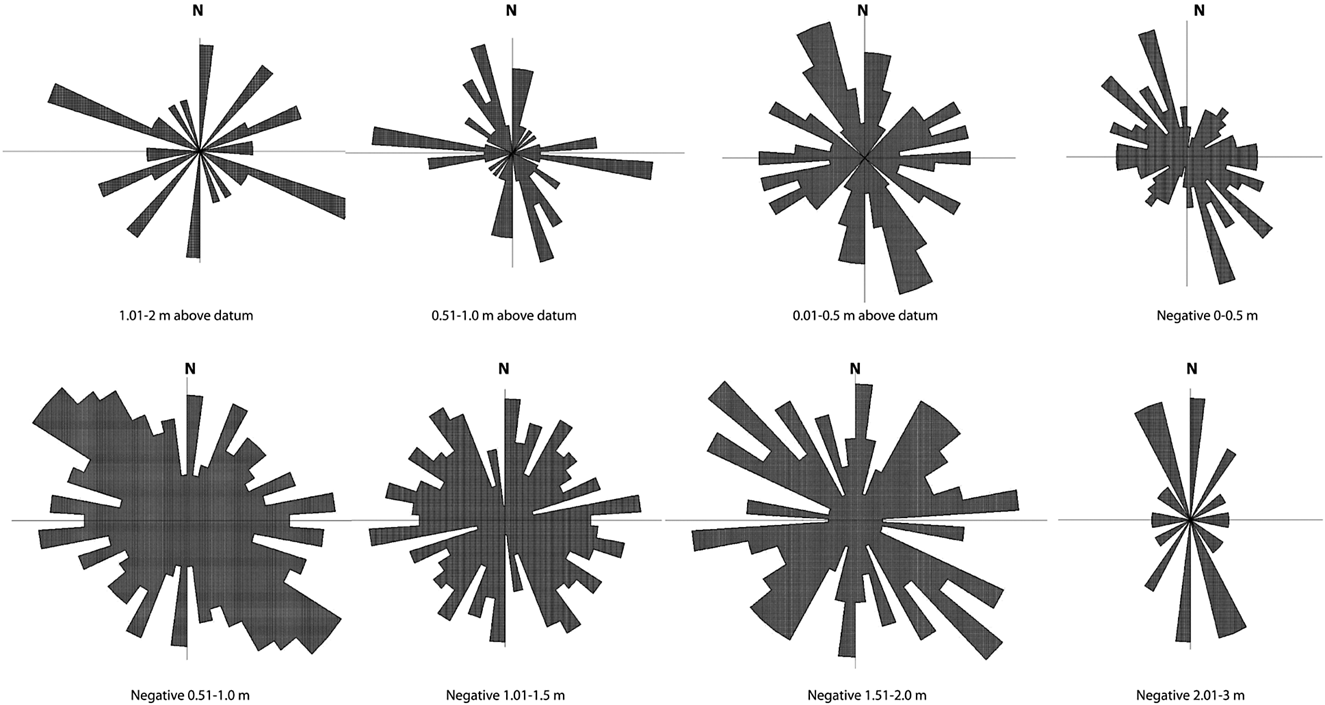
Series of rose diagrams displaying change in frequency of bone orientations with stratigraphic depth.
When the trend data are plotted, no apparent correlation is visible in the cumulative orientations of the elongate bone elements (Fig. 9). The Rao's Spacing Test is used to quantitatively determine a preferred orientation among a set of orientation values (Rao Reference Rao1972, Reference Rao1976). Rao's test consists of the following:
 $$U= {1\over 2} \sum^n_{i=1} |T_i- \lambda|$$
where λ=360/N, Ti=fi+1−fi, and Tn=(360−fn)+f1.
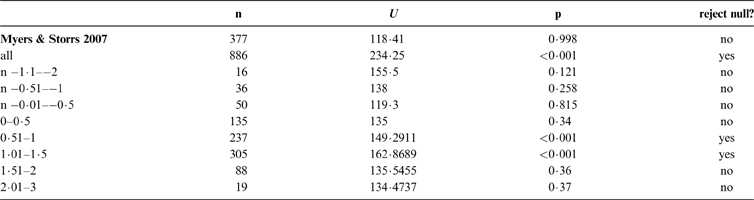
The test was here applied to a sample of 886 elements, versus the 377 elements initially available from the site. The null hypothesis (i.e. that all of the bones were oriented randomly with no preferred orientation) could not be rejected by Myers & Storrs (Reference Myers and Storrs2007). Using the updated data, a U value (Rao's test statistic) of 234·25 was obtained. This gives p<0·001, which allows rejection of the null hypothesis for the cumulative data (Russell & Levitin Reference Russell and Levitin1995). However, upon visual inspection, the rose diagram displays no preferred orientation (Fig. 9). The discrepancy may result from a data set that is too large for use of the Rao test. As a test of this idea, and because of the unusual thickness of the bone-bearing unit, Rao's test was also performed on depth-separated trend data. Six subsets of the data were arranged by 0·5 m intervals of depth within the quarry, while the top and bottom units comprised 1·0 m each because of their lower sample sizes (n=19, 16 respectively). While in most cases the data remained insufficient for a determination, the calculations for the 0·51–1·0 m-depth and 1·01–1·5 m-depth intervals returned U values of 135 and 149 respectively, yielding p<0·001, and therefore sufficient to reject the null hypothesis.
While the trend data for all of the bones combined appears random, separation of the data according to depth reveals an interesting progression (Table 1). Although the dataset for the bottom of the deposit is too small to allow rejection of the null hypothesis, the bones there appear to exhibit a strong N–S trend preference, whereas those elsewhere have either no statistically preferred orientation (near the middle of the deposit) or a statistically significant NW–SE orientation near the main mass of bones (Fig. 10). Overall, there appears to be a N–S orientation along the base of the deposit perpendicular to flow direction (indicated by the palaeoslope, below) while, moving upwards through the deposit, more long bones are randomly oriented, trending towards a preferred NW–SE/W–E orientation near the deposit's top. Fluvial transport would be expected to imprint a single, highly pronounced preferred orientation throughout the deposit (Voorhies Reference Voorhies1969), which is not exhibited in the Mother's Day Quarry.
Clasts contained within hyperconcentrated debris flows may be characterised by random orientation when emplaced over a low gradient palaeoslope (Vallance & Scott Reference Vallance and Scott1997). The observed trend in the orientation of Mother's Day bones at depth can therefore be explained by the fact that when an elongated object is transported at the base of a debris flow, the long axis of the object may become aligned perpendicular to the flow direction as the object is rolled along at the base of the flow. Therefore, one can deduce that the debris flow that resulted in the Mother's Day Quarry deposit had a palaeodirection along the modern W–E axis. Long bones within the deposit are more often oriented parallel to the flow direction than they are at depth, perhaps indicating that the waning phase of the flow was a lower density event, and closer to fluvial conditions.
The current dip of the deposit, reflecting regional dip off of the Pryor Mountains uplift, requires correction of the raw apparent dip and plunge measurements of each skeletal element before they can be used in the construction of a comprehensive three-dimensional bone-bed model. The resulting data set and model can then further test the debris flow interpretation, for dip correction allows the spatial orientation of the bones to be viewed as originally deposited. The following equation was used to determine the corrected, or true original dip of each bone, where the average regional dip is calculated as 20o:
 $$\delta = Cos(20)^* ((D^* Tan(20)^* Cos(80 - b)) + d)$$
, where δ is the corrected dip, D is the distance (m) from the datum, b is the azimuth from the datum (in degrees relative to N), and d is the apparent depth of each element (given as a positive value for those elements below the datum). The final value must be multiplied by −1 before use in the mapping program presented below. The plunge of each element was corrected using the following equation:
 $$P = \phi^* Cos(80 - \mu) +20$$
, where P is the plunge, ϕ is the apparent plunge, and μ is the trend (in degrees relative to N).
A program was written in MATLAB (2011) to render the contextual data measured at the site as a simplified three-dimensional map of the quarry. The tailored program created here generates a series of simple rectangular boxes to visually represent each skeletal element (oriented lengthwise with the long axis of each bone). These were colour-coded to indicate the type of element represented. Details of the program and its use, together with the program script, are available as with the online version of this paper (see section 7). Results are presented in Figures 11–13.
Key to MATLAB display bone identifications.
MATLAB display, aspect to N, showing original 11o average E palaeoslope of Mother's Day Quarry site bone-bed deposit.
MATLAB display, from above, reflecting extent of quarry excavations with adequate bone orientation measurements (2004–2011).
5. Discussion
The abundance of articulated podial elements and sub-vertical limb bones within the nearly 4 m-thick bone-bed of the Mother's Day Quarry led to the early hypothesis that the site represented a miring environment where multiple animals were trapped in the mud of a floodplain adjacent to a shrinking water body (Horner & Dobb Reference Horner and Dobb1997). However, many of the sub-vertical elements are in fact preserved upside-down, a circumstance that would not be expected under such a scenario. Additionally, elements from the ventral and posterior regions of the body (which are submerged and buried) are usually far more abundant in miring situations than dorsal elements, which would have been exposed above the mud matrix and subsequently more vulnerable to scavenging and other forms of transport and/or destruction (Abler Reference Abler1985; Hungerbühler Reference Hungerbühler1998; Heinrich Reference Heinrich1999). The Mother's Day Quarry site shows no such disparity in the ratio of preserved dorsal or ventral bones, while the demonstrated directional current overprint falsifies the in situ miring hypothesis.
The limited amount of evidence for predators at the quarry is notable. In the Cincinnati Museum Center collection, only five out of the 2,000+ elements comprising the Mother's Day assemblage are Allosaurus teeth (<0·25%). A similar number are held by the Museum of the Rockies. The relative scarcity of teeth, combined with the rarity of bite marks on the bones, indicates that predation was not responsible for the origin of the deposit and that scavenging played only a minor role at the site.
From the combined sedimentologic, palaeontologic and taphonomic characteristics of the site, it appears that a monodominant herd of juvenile and subadult dinosaurs (perhaps age-segregated) congregated at a limited, perhaps ephemeral, water body and succumbed to drought conditions (Myers & Storrs Reference Myers and Storrs2007; Myers & Fiorillo Reference Myers and Fiorillo2009). The age profile of the accumulation is consistent with this interpretation, in that immature individuals of large herbivores in modern environments die much more frequently than do adults under drought conditions (Corfield Reference Corfield1973; Barnes Reference Barnes1982; Conybeare & Haynes Reference Conybeare and Haynes1984; Haynes Reference Haynes1985, Reference Haynes1987; Dudley et al. Reference Dudley, Craig, Gibson, Haynes and Klimowicz2001; Oba Reference Oba2001). Following this catastrophic mass-mortality, the desiccated dinosaur carcasses were exposed just long enough for partial decay, before mudflow mobilisation after the return of monsoonal rains. Such transport further disarticulated skeletal elements not already subjected to scavenging, although some latent articulation of associated skeletal complexes remained (Figs 5, 6). The present analysis suggests that minor and evolving current overprints developed as the bones were entombed.
Young sauropods would have been especially vulnerable to dehydration due to their small size and inability to traverse large distances in search of water. The scaling effect of large size imparted a survival advantage to adults due to their relative efficiency in the acquisition and processing of food resources (Engelmann et al. Reference Engelmann, Chure and Fiorillo2004). A prevalence of juvenile individuals also exists in monospecific drought assemblages of the Two Medicine Formation, which was deposited under similar conditions as those dominating the Morrison (Rogers Reference Rogers1990). Similarly, modern studies of elephant mortality rates under drought conditions show a disproportionate number of juvenile deaths (Corfield Reference Corfield1973; Barnes Reference Barnes1982; Conybeare & Haynes Reference Conybeare and Haynes1984; Dudley et al. Reference Dudley, Craig, Gibson, Haynes and Klimowicz2001). The characteristics of the Mother's Day Quarry site are therefore consistent with drought-induced assemblages. The Morrison Formation's Dry Mesa Quarry of Colorado may be a catastrophic drought accumulation related to the evaporation of ancient Lake T'oo'dichi' and a subsequent flash flood depositional event. The arid regional palaeoenvironment, disarticulation of the Dry Mesa bones and their unaltered surfaces are interpreted as evidence of drought (Richmond & Morris Reference Richmond and Morris1998).
Annual excavation of fossils at the Mother's Day Quarry site has resulted in a significant sample of immature Diplodocus Marsh, Reference Marsh1878 bones for analysis. Previous work has identified a drought-induced mass-mortality assemblage of a single herd of animals, subsequently transported and interred by a high-density sediment (debris) flow following potentially monsoonal rains (Myers & Storrs Reference Myers and Storrs2007). However, because of the episodic nature of excavations at the site, the wide expanse of quarry operations, and the regional strike and dip of the quarry beds, the overall three-dimensional geometry of the deposit has been obscured until now.
Three-dimensional mapping of the bones has facilitated key observations not evident using conventional methods. The scale and scope of the deposit, and the orientations of its entombed fossils, may now be clearly visualised. In particular, MATLAB computed display plots (Figs 12, 13) allow for the identification of a “palaeo-slope” or original dip for the bone-bearing unit at the Mother's Day Quarry site, following correction for current regional dip. Examination of the model suggests an average original slope or dip of 11o E. This observation provides strong evidence in support of the deposit having been the result of a hyperconcentrated debris flow, as suggested by Myers & Storrs (Reference Myers and Storrs2007). Indeed, the N–S preferred orientation of many long elements at the base of the deposit, perpendicular to the E-dipping palaeoslope, is consistent with this explanation. Debris flows are gravity-fed events requiring a downhill slope for mobilisation of the thixotropic fluid of which they are composed. However, steep gradients are not required when sediments are fully saturated (Iverson et al. Reference Iverson, Reid and LaHusen1997). Furthermore, the preferred orientation of elongate elements at multiple depth levels within the deposit is perpendicular to flow, consistent with a debris flow model.
The computer program presented here provides a useful tool for the interpretation of the geometry and depositional history of bone-beds. In this case, it has allowed a method for testing the previous interpretation of the site's taphonomic history, thus the debris flow hypothesis was not falsified. MATLAB is a readily available software package that can be adapted for use in similar bone-bed analyses. Close examination of the code used here will allow customisation for use in a variety of circumstances and with a variety of output types. It may be used at any site where the elements and their context in three-dimensional space have been sufficiently documented. In addition, we suggest that detailed parsing of depositional horizons within a thick, apparently single, flow event can provide information on the evolution of the flow from onset to conclusion.
6. Acknowledgements
The authors thank the organisers of this Festschrift for the opportunity to contribute to a volume in honor of Wann Langston. The senior author is indebted to Wann for providing inspiration during his early student days and thereafter. Wann's passion for his profession and generosity with his knowledge set a tone for our own professional conduct and we can only hope that we have each lived up to his standards. It is our sincere pleasure to thank Wann and to dedicate this contribution to him.
We also wish to acknowledge the US Department of the Interior Bureau of Land Management and, notably, Gary Smith, for providing access to the quarry site and support for our operations. The Yellowstone Bighorn Research Association was instrumental in providing logistical support for our field crews. Funding was provided by Cincinnati Museum Center, The University of Cincinnati Department of Geology and The University of Cincinnati WISE Program. Assistance in the field and lab was given by Michael J. Papp, T. Scott Myers, William J. Garcia, Dale Gnidovec, Jason Dennison, Mason Milam, Lauren Scallon, Daniel Striley, Mackenzie English, William E. Storrs, Olivia E. Storrs, Ian R. Storrs, Lamont Meadows, James Clark, Kani Meyer, Fred Moore, Stanley Hedeen and Charlotte Cox. Hundreds of Cincinnati Museum Center Dinosaur Field School attendees and friends have participated in fossil and data collection over the years and all are to be thanked.
David Eberth and Pascaline Lauters provided helpful editorial criticisms, greatly improving the quality of this work. We thank them for their time and effort.
7. Supplementary Material
Details of the MATLAB program and its use, together with the program script, are published as with the on-line version of this paper. This is hosted by the Cambridge Journals Online (CJO) service, and can be viewed at http://journals.cambridge.org/tre.