


1. INTRODUCTION
Collimated plasma out-flows (jets) are a subject of great interest in the study of astrophysical phenomena (Ryutov et al., Reference Ryutov, Drake and Remington2000; Mizuta et al., Reference Mizuta, Yamada and Takabe2002; Bellan, Reference Bellan2005; Schopper et al., Reference Schopper, Ruhl, Kunzl and Lesch2003), laser plasma interaction phenomena (Hong et al., Reference Hong, He, Wen, Du, Teng, Qing, Huang, Huang, Liu, Wang, Huang, Zhu, Ding and Peng2009) and are of interest also for a new fast ignition concept (Velarde et al., Reference Velarde, Ogando, Eliezer, Martinez-Val, Perlado and Murakami2005). Additionally, they can be found in simulations of plasmas generated at contact surfaces of different materials in multi-shell target geometry (Goldman et al., Reference Goldman, Caldwell, Wilke, Wilson, Barnes, Hsing, Delamater, Schappert, Grove, Lindman, Wallance and Weaver1999; Blue, Reference Blue, Weber, Glendinning, Lanier, Woods, Bono, Dixit, Haynam, Holder, Kalantar, MacGowan, Nikitin, Rekow, Van Wonterghem, Moses, Stry, Wilde, Hsing and Robey2005). The first serious attempts to generate jets relevant to astrophysical observation were presented only recently (Farley et al., Reference Farley, Estabrook, Glendinning, Glenzer, Remington, Shigemori, Stone, Wallance, Zimmerman and Harte1999; Shigemori et al., Reference Shigemori, Kodama, Farley, Koase, Estabrook, Remington, Ryutov, Ochi, Azechi, Stone and Turner2000). Conically shaped targets made of different materials were irradiated by five beams of the Nova laser with pulse duration of 100 ps and energy for each beam of 225 J or by six beams of the GEKKO-XII laser with the same pulse duration, but the total energy of 500 J. The jet-like structures were formed by collision of ablated flows at the axis of conical targets. Since the jet diameter increases with decreasing atomic number of the irradiated target, the authors suggested that the jet collimation was due to radiative cooling. One other method of the jets generation is also worth mentioning where the convergent plasma flows are formed by an electrodynamic acceleration of plasma created by a conical array of fine wires (a modification of the wire array Z-pinch) (Lebedev et al., Reference Lebedev, Chittenden, Beg, Bland, Ciardi, Ampleford, Hughes, Haines, Frank, Blackman and Gardiner2002).
In 2006, we reported a simple method of plasma jet generation based on using a flat massive target with atomic number A ≥ 29 (A = 29 corresponds to Cu) irradiated by a single partly defocused laser beam (Kasperczuk et al., Reference Kasperczuk, Pisarczyk, Borodziuk, Ullschmied, Krousky, Masek, Rohlena, Skala and Hora2006). Our further investigations of the plasma jet were devoted to its optimization from the point of view of laser energy, focal spot radius, and position of the focal point in respect to the target surface, that is, inside or in front of the target (Kasperczuk et al., Reference Kasperczuk, Pisarczyk, Borodziuk, Ullschmied, Krousky, Masek, Pfeifer, Rohlena, Skala and Pisarczyk2007a, Reference Kasperczuk, Pisarczyk, Borodziuk, Ullschmied, Krousky, Masek, Pfeifer, Rohlena, Skala and Pisarczyk2007b, Reference Kasperczuk, Pisarczyk, Badziak, Miklaszewski, Parys, Rosinski, Wolowski, Stenz, Ullschmied, Krousky, Masek, Pfeifer, Rohlena, Skala and Pisarczyk2007c, Reference Kasperczuk, Pisarczyk, Kalal, Martinkova, Ullschmied, Krousky, Masek, Pfeifer, Rohlena, Skala and Pisarczyk2008). Recently, we tested the possibility of plasma jet creation at an oblique laser beam incidence. It turned out that at an angle of 30° of the laser beam incidence on the target surface normal, the plasma jet quality is not worse than that for the normal incidence. This was very important in our experiment devoted to the interaction of the plasma jet with ambient gases (Kasperczuk et al., Reference Kasperczuk, Pisarczyk, Nicolai, Stenz, Tikhonchuk, Kalal, Ullschmied, Krousky, Masek, Pfeifer, Rohlena, Skala, Klir, Kravarik, Kubes and Pisarczyk2009). The oblique incidence of the laser beam allowed us to avoid disturbances caused by preionization of gas by laser beam in the plasma jet expansion region.
Such a plasma jet production method is clearly the simplest possible one. And ever since its first observation, these results became (at PALS) routinely reproducible. However, the correct mechanisms responsible for the plasma jet forming turned out to be rather difficult to determine. The observed plasma jets are characterized by high plasma density in the paraxial region of a diameter of 300–400 µm and by its sharp decrease at the borders. Strong gradients of electron density in the vicinity of the axis and high plasma density in the center indicate that these plasma jets are produced by collision of plasma flows converging on the axis. Such convergent plasma streams can be effectively generated at the target irradiation structure of annular shape (Schaumann et al., Reference Schaumann, Schollmeier and Rodriguez-Prieto2005; Sizyuk et al., Reference Sizyuk, Hassanein and Sizyuk2007). Indeed, our investigations have shown that in the plasma jet production regime, the craters produced by laser radiation on the target have always a semitoroidal shape (Kasperczuk et al., Reference Kasperczuk, Pisarczyk, Badziak, Miklaszewski, Parys, Rosinski, Wolowski, Stenz, Ullschmied, Krousky, Masek, Pfeifer, Rohlena, Skala and Pisarczyk2007c). However, this mechanism acts properly only in the case of target materials with atomic number A ≥ 29. If the target is made of low-A materials like plastic or Al, no plasma jets are observed despite the fact that the laser intensity distribution is the same. Corresponding laser craters have as a rule their maximum depth in the center. Thus other mechanisms must influence the plasma jet forming, too.
The radiative cooling of plasma, which was suggested by numerical simulations of the plasma dynamics (Nicolai et al., Reference Nicolai, Tikhonchuk, Kasperczuk, Pisarczyk, Borodziuk, Rohlena and Ullschmied2006), was also taken into consideration due to influence of the target material atomic number on the efficiency of plasma radiation and cooling (the higher the atomic number, the more effective is the radiative cooling). However, despite many efforts, no numerical simulations attempted so far were able to provide results that would be in acceptably close agreement with experimentally observed reality.
The goal of this paper was to elucidate the relative role of both the above mechanisms in the plasma jet forming process as well as exploration of other possible mechanisms that might help to explain the above features. For this reason, the experiment with high-A (Cu) and low-A (plastic) materials as massive planar targets as well as the plastic targets covered by thin Cu layers with different thicknesses (from 28 to 190 nm) were performed. Moreover, analytical and numerical analyses of laser beam interaction processes with planar targets made of Cu and plastic were realized assuming a flat laser beam intensity profile.
2. EXPERIMENTAL SETUP AND CONDITIONS
The experiment was carried out with the use of the PALS iodine laser facility (Batani et al., Reference Batani, Dezulian, Redaelli, Benocci, Stabile, Canova, Desai, Lucchini, Krousky, Masek, Pfeifer, Skala, Dudzak, Rus, Ullschmied, Malka, Faure, Koenig, Limpouch, Nazarov, Pepler, Nagai, Norimatsu and Nishimura2007; Laska et al., Reference Laska, Krasa, Velyhan, Jungwirth, Krousky, Margarone, Pfeifer, Rohlena, Ryc, Skala, Torrisi and Ullschmied2009; Torrisi et al., Reference Torrisi, Margarone, Laska, Krasa, Velyhan, Pfeifer, Ullschmied and Ryc2008). The plasma was generated by a laser beam of diameter about 160 mm (at the vacuum chamber entrance window), which was focused by means of an aspheric lens with focal length of 600 mm for the third harmonic of the laser radiation used (λ = 0.438 µm). The following laser parameters for irradiation of plastic and Cu planar targets have been chosen: laser energy E L = 30 J, focal spot radius R L = 400 µm (the focal point being located inside the target), and the pulse duration τ = 250 ps (full width at half maximum). In this case, the average laser intensity was 2.4 × 10¹³ W/cm2. In order to observe the influence of the atomic number of target material on an ablative plasma structure, the high-A (Cu) and low-A (plastic) materials as massive planar targets as well as the plastic targets covered by thin Cu layers with thicknesses of 28, 45, 78, 190 nm were employed.
For studying the plasma expansion a three-frame interferometric system with automatic image processing was used. The diagnostic system was illuminated by the second harmonic of the iodine laser. The delay between subsequent frames was set to 3 ns.
The diagnostic system included an X-ray streak camera. Streaked images of plasma X-ray emission were recorded by KENTECH low magnification X-ray streak camera mounted in a side view. The temporal and spatial resolutions of X-ray images were 30 ps and 50 µm, respectively. To avoid registration of visible plasma radiation, the recording channel of the camera was covered with 8.5 µm of Mylar and 40 nm of Al. In this arrangement, the transmission was negligible for photons of energy less than 0.8 keV, and amounted to about 20% for photons of 1.3 keV. As the laser-produced plasma exhibits such high temperature only during the laser pulse period, the streak camera registered radial distribution changes of the plasma radiation in the vicinity of the target surface. Consequently, the measured distribution of plasma radiation should correspond to the distribution of laser beam intensity in that period. Location of the optical and X-ray diagnostics in the experimental setup is shown in Figure 1.
Experimental setup.

3. INFLUENCE OF TARGET MATERIAL ON STRUCTURE OF THE PLASMA OUT-FLOW
The interferometric measurements corresponding to the high-A (Cu) and low-A (plastic) target materials are presented in Figures 2 and 3, respectively, as sequences of interferograms, corresponding electron isodensitograms, and electron density distributions. In all diagrams, the plasma stream boundary is represented by the electron density contour n e = 1018 cm−3. The step of the adjacent equidensity lines is Δn e = 2 × 1018 cm−3. In the first frames (Δt = 2 ns), the plasma configurations corresponding to both materials are similar. The only difference concerns the plasma volume resulting from the difference in plasma velocities (6 × 107 cm/s for plastic and 4 × 107 cm/s for Cu). One can see that in both cases, the plasmas tend to create plasma jets. A substantial difference in the plasma out-flow structures appears already in the second frames (Δt = 5 ns). In the case of Cu target, the jet creation process continues, whereas the plastic plasma expansion changes essentially, becoming divergent. This character of plasma out-flow is also conserved at later times.
(Color online) Sequences of interferograms (a), electron equidensitograms (b), and spatial electron density distributions (c), showing the evolution of Cu-plasma structure.

(Color online) Sequences of interferograms (a), electron equidensitograms (b), and spatial electron density distributions (c) showing the evolution of plastic-plasma structure.

Explanation of the initial similarity of the plasma configurations for each material and their consecutive difference evolving at later times could be found based on measurements of plasma radiation by the streak camera, typical results of which are presented in Figure 4. The Abel inversion was used to get radial X-ray radiation intensity distributions from the registered streak images. Due to a large difference in the radiation intensity of Cu and plastic plasma (about 30 times higher in case of Cu), the presented X-ray emission intensity distributions are normalized to unity, 0.02 being the step of the adjacent intensity distribution lines.
(Color online) The laser pulses (a), typical streak images of X-ray radiation from Cu and plastic plasma (b), equidensitograms of the X-ray radiation intensity distributions (c), and spatial distributions of the radiation intensity (d).

Let us underline the most important findings coming from these observations: (1) For both kinds of the target material, the annular form of the X-ray radiation is clearly apparent suggesting the similar shape for the laser irradiation structure as well; (2) In the case of the plastic target, an additional radiation peak in the center appears spontaneously at a certain instant of the laser pulse. This radiation lasts even for a considerable time after the laser pulse end with the plasma emission becoming concentrated near the axis.
Transition of the annular character of the plastic plasma radiation source to the central one is related to the change of the initially convergent plasma out-flow to the divergent one. The nature of it cannot be explained on the basis of the considered mechanisms of the plasma jet forming. At the moment of the central plasma radiation appearance, the ablative plasma reaches only a distance of about 100 µm, thus making any strong deflections of the laser radiation toward the axis rather unlikely. Therefore, another phenomenon must be responsible for this process. This problem will be considered later on in this paper. However, the observation made is confirming that after the laser pulse end, the plasma radiation becomes concentrated near the axis. Such change of the annular configuration of the plasma radiation source to the central one, undoubtedly corresponds to the change of the plasma source localization causing the initially convergent plasma out-flow to get the divergent form.
Since the annular target irradiation creating the annular plasma source clearly leads to the convergent plasma out-flow and the jet creation, it became interesting to find out what would happen if the plastic target would be coated by a thin Cu layer with its thickness ensuring conservation of the annular plasma source geometry for the total laser pulse duration. It was expected that this plasma source geometry transferred through the Cu layer into the plastic might be sufficient for continuation of the plasma jet forming even from the uncovered underlying plastic.
In order to answer this question, the experiment with the plastic target coated by the thin Cu layers was performed. However, the crucial problem constituted determination of the most appropriate layer thickness, the ablation time of which would correspond to the laser pulse duration. Such layer, in our opinion, ought to be enough for imprinting the annular plasma source geometry into the plastic. For this reason, a theoretical model of laser-driven evaporation was developed taking into account conditions and features of PALS experiment.
4. LASER-DRIVEN EVAPORATION THEORETICAL MODEL FOR HIGH-TEMPERATURE PLASMA
High-temperature laser-produced plasma is created as a result of evaporation of target material during the period that is close to the laser pulse duration. In the case of relatively low laser intensities, I ≤ 1014 W/cm2 evaporation of matter from the flat target surface during this period realizes in the hydrodynamic regime. This regime of evaporation means that the flux of the evaporating matter from the target is approximately equal to the flux of the expanding high-temperature plasma (corona) created as a result of the laser irradiation (Gus'kov et al., Reference Gus'kov, Azechi, Demchenko, Demchenko, Doskoch, Murakami, Nagatomo, Rozanov, Sakaiya, Stepanov and Zmitrenko2007a). Additional influence of the thermal conductivity plays only a marginal role.
The flux of the evaporated matter q ev can be expressed by the formula

where ρ0 is the target material density, D is the evaporation wave velocity. The flux of the expanding corona material q ex can be determined by plasma velocity V cr and density ρcr in the laser absorption region (that is, at the critical density)

In the above expression, the critical density ρcr can be written as

where λ is the irradiating laser wavelength in microns, A and Z are the atomic number and average ion charge, respectively.
Expansion speed of the matter V cr is determined from the condition of equality between the absorbed laser energy flux and the flux of the plasma internal energy in the absorption region (that is, in the region with critical mass density) (Gus'kov et al., Reference Gus'kov, Kasperczuk, Pisarczyk, Borodziuk, Ullschmied, Krousky, Masek, Pfeifer, Skala and Pisarczyk2007b)
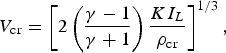
where γ = 5/3 is the adiabatic exponent; I L is the intensity of incoming laser radiation; K is the coefficient of the laser energy conversion into the internal energy of the corona material, taking into account energy losses due to only partial absorption of the laser energy in corona as well as the energy loss caused by the plasma thermal radiation. Equality of (1) and (2) provides for the evaporation wave velocity D the expression

and consequently for the evaporated layer thickness Δev the formula

The evaporation wave propagation time t ev is longer than the laser pulse duration t L

by the additional evaporation time t P during which sufficiently high pressure in the plasma corona is maintained to support the evaporation wave after the end of the laser pulse. In the conditions of PALS experiments, the additional evaporation time t P could not be neglected in comparison with the relatively short laser pulse duration. For this reason, a contribution of the post-pulse evaporation must be included in the model. Let us evaluate this time by estimating the evaporation wave velocity D after the end of the laser pulse. Under such conditions D can be characterized by the formula similar to the Eq. (5)

As the laser radiation ended, no critical density region with characteristic density heated by the laser exists. Under these conditions, the average corona density ρex and the average expansion velocity V ex assume the forms:

Here m ev is the total mass in corona, Ω is the corona volume, and E is the corona kinetic energy (after the end of laser pulse full energy of the corona is approximately equal to the kinetic energy). By inserting (9) into (8) we get

After the end of the laser pulse, the corona energy practically remains the same, and the evaporated matter increase is rather small. As a result of these facts, the evaporation wave velocity changes only due to the corona volume increase caused by the plasma expansion

Let us estimate the additional evaporation time t P as the time during which the evaporation wave velocity decreases by the factor of 2, that is, in agreement with (11), the corona volume increases also by the same factor. Let us assume that the corona would have a cylindrical form. Under these assumptions, the ratio between the corona volume at the time t L + t P and at the time t L when the laser pulse ended should be equal to two. Hence, for determination of the time t P the following expression can be obtained:

where R L is the focal spot radius.
In Table 1, the results of calculations of all relevant quantities are presented for the following laser pulse parameters: E L = 30 J, R L = 400 µm, τL = 250 ps, I L = 2.4 × 10¹³ W/cm2. In this Table, the values of the coefficient of the laser energy conversion K and the average charge Z of Cu have been taken from Gus'kov et al. (Reference Gus'kov, Kasperczuk, Pisarczyk, Borodziuk, Ullschmied, Krousky, Masek, Pfeifer, Skala and Pisarczyk2007b), ρcr was calculated using the Eq. (3), V cr using the Eq. (4), and Δev using the Eq. (6); the ratio t p/t L was obtained as a solution of Eq. (12). The full amount of the evaporated matter can be calculated from the thickness of the evaporated layer using the formula:

So, the total evaporated mass of Cu (equal to 0.69 µg) corresponds to the mass of the disk with the focal spot radius (400 µm) and the thickness of 155 nm.
The set of calculated relevant quantities

5. INFLUENCE OF CU LAYER THICKNESS ON CHARACTERISTICS OF THE PLASTIC PLASMA OUT-FLOW
To observe the gradual influence of the Cu layer on the configuration of the plasma out-flow, a set of plastic targets covered by the Cu layers with thicknesses 28, 45, 78, and 190 nm was prepared. Based on the above estimates, the first three layers should evaporate at different stages during the laser pulse, whereas the evaporation time of the last one should correspond approximately to the laser pulse end. Unfortunately, prefabrication of the Cu layer with thickness exactly equal to 155 nm proved to be difficult. On the other hand, in the above theoretical model, the homogeneous laser intensity distribution with the radius of 400 µm was assumed. However, the actual intensity distribution is characterized by considerably higher values at the off-axial region. For this reason, a Cu layer thicker than that predicted by the theory seemed to be more realistic.
Sequences of interferograms documenting the plasma stream evolution for the plastic and Cu targets as well as for the plastic targets with the above mentioned Cu layers are presented in Figure 5. To extend the observation period, the first frames in the interferogram sequences were taken from the other shots with the same type of targets. This was possible as these results were routinely reproducible.
Sequences of interferograms corresponding to different target compositions.

These interferometric measurements allowed us to come to some important conclusions:
(1) The sequence corresponding to the plastic target clearly proves that the plasma expansion has a divergent character. One can see that the plasma expansion angle grows in time. It is connected with the decrease of plasma source size seen in the streak in Figure 4. (2) When the plastic target was covered by a thin Cu layer, the plasma out-flow keeps its convergent character for a certain period, the duration of which grows with the layer thickness. In the case of a 28 nm thick Cu layer, the divergent plasma out-flow is observed for about 10 ns after the laser pulse. The divergent form of the plasma out-flow is thus delayed by about 6 ns with respect to the plastic target. It means that even such a thin Cu layer influences the plasma expansion character for a considerably long time. With growing thickness of the Cu layer, the plasma expansion transition from the convergent form to the divergent one is progressively delayed. This process runs gradually less effective and practically disappears in the case of the 190 nm thick Cu layer (no divergent plasma expansion occurs during the observation period). (3) The diameter of the plasma jets decreases with the growing thickness of the Cu layer. This can be clearly seen in the interferograms in Figure 5 at 7 ns. As a matter of interest in the case of the two thickest Cu layers used, the plasma jet diameter is even smaller than that for the Cu only target.
A considerable contribution to the explanation of the above features was obtained by the determination of the influence of the Cu layer thickness on the plasma radiation form using the X-ray streak camera. Recorded images corresponding to all used Cu layers are similar to that for the Cu only target (see Fig. 4). The differences concern the plasma radiation intensity in the period of the laser pulse. It grows with the Cu layer thickness reaching its maximum value for the 190 nm Cu layer that resembles to that of the Cu only target. In Figure 6, the maximum intensity distributions along the lateral part of the streaks are presented. The corresponding emission source is marked by the dotted horizontal line A-A in Figure 4. The maximum value of the X-ray emission intensity distribution for the 190 nm thick Cu layer is normalized to unity. A certain interpretative problem constitutes the minimum in the X-ray intensity distributions appearing in all the diagrams. This, according to our opinion, has no physical reasons and should be attributed to the X-ray streak camera somewhat peculiar behavior. It should be also emphasized that the shape of the recorded data in their final part, that is, after the laser pulse end, are very close to that for the Cu only target (see Fig. 4). Also the corresponding intensities are close to each other as it is demonstrated in the part II of Fig. 6.
(Color online) Diagrams of distributions of maximum plasma radiation intensity along the lateral side of streaks for all the Cu layers used. The diagrams in the part II corresponds to the enlarged scale in comparison with that in the part I.

The connected results from both diagnostics allow us to draw the following conclusions: (1) Although the plasma radiation period with the Cu plasma intensity level decreases with the decreasing Cu layer thickness, and corresponds roughly to that expected on the basis of the theoretical model, no sharp drop of the plasma radiation intensity to the plastic intensity level is observed. The slowly shifting intensity decrease means that there is no distinct transition from the Cu layer and plastic plasmas. The plasma following the first Cu layer plasma constitutes the mixture of the Cu and plastic plasmas. It is most likely connected with the plasmas velocity difference and non-homogeneity of the target irradiation. (2) The observed annular plasma source geometry in case of Cu layers is maintained until the Cu layer evaporates completely. This moment is gradually postponed in time with the growing Cu layer thickness. Later on, the divergent plasma out-flow appears. It means that, in analogy to the plastic only target, the plasma source geometry changes from the annular form to one that concentrated near the axis. Accordingly, there is no possibility to transfer the Cu layer plasma source annular geometry to the underlying plastic. (3) In the case of the thinnest Cu layer, due to the small Cu plasma contribution to the total plasma generated, the plasma jet has the large diameter and its life-time is relatively short. With the growing Cu layer thickness, the participation of the Cu plasma increases and the plasma jet diameter becomes smaller, and the jet life-time increases. However, an intriguing question, that is, why the plasma jet quality for the two thickest Cu layers is better than that for the Cu only target, appears. The difference concerns mainly the plasma jet tops that are expected to look similar to those produced from Cu only target. Most likely the plastic plasma emitted at the laser pulse end catches up with the Cu plasma front taking part in the plasma jet top forming. In these cases it could be assumed that the faster plastic plasma penetrating into the Cu plasma front is able to improve the plasma jet quality (the actual mechanism remains to be understood). With the decreasing Cu layer thickness, the plastic plasma component becomes dominant in the total plasma generated and the plasma jet creation conditions are becoming gradually less favorable.
Although the above experimental results confirm that the annular geometry of the target irradiation plays a decisive role in the plasma jet forming, this factor is practically completely suppressed in the case of the low-A target material. In order to explain this feature, a numerical modeling of the processes under consideration was performed.
6. NUMERICAL SIMULATIONS OF THE LASER BEAM - PLANAR CU AND PLASTIC TARGETS INTERACTION
Numerical simulations of the laser beam interactions with the planar Cu and plastic targets were carried out using the two-dimensional hydrodynamic code ATLANT-HE (Lebo et al., Reference Lebo, Demchenko, Iskakov, Limpouch, Rozanov and Tishkin2004). Cylindrical coordinates (r, z) were used assuming the expanding plasma axial symmetry. The computations were performed for the PALS radiation conditions. The laser beam intensity distribution on the target surface was defined the following way:

where s = r/R L, r is the distance from the beam axis. The focal point was located inside the target. The calculations were performed using the equation of the perfect gas. Kinetics of ionization and recombination were not included, the average charge of ions for the CH-target (plastic) was taken Z CH = 3.5 and for the Cu-target Z Cu = 19. The energy losses caused by the thermal emission and radiation transfer in plasma were not considered.
In Figure 7, the spatial distributions of the density and the electron temperature of the plastic and Cu plasmas at the instant of the laser pulse end are shown. In these distributions, the essential differences in the plasma expansion features between the plastic and Cu targets are clearly visible. Due to much lower plasma expansion velocity in the case of the Cu target, the longitudinal size of the expanded plasma (along the z axis) at the moment of the laser pulse end is about one-half of its transverse dimensions (only the right half of the plasma plumes is shown due to their axial symmetry). In this case, the plasma expansion has a planar geometry. On the contrary, in the case of the plastic target, the longitudinal size of the plasma plume is larger than its transverse one and the expansion exhibits the spherical symmetry.
Spatial distributions of plasma density (in g/cm3) and electron temperature (in eV) at the moment of laser pulse end for plastic and Cu targets.

In Figure 8, the temporal dependence of the maximum values of the electron temperature in the plasma bunch and the velocities of the plasma-vacuum boundary at the axis of symmetry (r = 0) for the plastic and Cu targets are shown. It can be seen that the plasma expansion velocities increase only during the time of the laser pulse action. Later on, they are stabilized at certain constant values. The temperatures decrease due to the plasma expansion and, in fact, all the energy absorbed is transferred into the kinetic energy of ions, those becoming significantly supersonic.
(Color online) Temporal dependence of electron temperature maximum T and plasma boundary velocity u for plastic and Cu targets.

Let us consider the hydrodynamic equations of continuity and motion:


If the motion is significantly supersonic, it is possible to neglect in Eq. (16) the term pδik with respect to ρu iu k, as p = ρc s2 (c s is the sound velocity) and ρu iu k ~ ρu 2 ≫ ρc s2. Then the Eq. (16) with the help of (15) can be reduced to the form:

It means that the velocities of the Lagrangian particles of the plasma do change neither their value nor their direction. This motion represents the inertially expanding continuous medium. Therefore, the geometry of the plasma bunch expansion is formed during the initial stage of the laser pulse. After the laser pulse end, the plasma velocities in the bunch do not change. As shown in the Figure 8, in the case of the plastic target, the temperature drops rapidly due to the higher speed of the plasma expansion resulting from its spherical geometry in comparison to the planar geometry of expansion in the case of Cu target.
The lower velocity of the plasma expansion for the Cu target is a result of the larger evaporation (ablation) of the mass of this target in comparison to the plastic one. Figure 9 shows the calculated dependences of the electron temperature, density, and velocity of the plasma on the axis of symmetry (r = 0) on the mass coordinate m = ρ0 (z 0 − z). The mass is determined from the irradiated surface of the target; ρ0 and z 0 are the initial values of the target density and thickness, respectively; the axis z is directed toward the incoming laser radiation. The data correspond to the end of the laser pulse. In the case of the Cu target, until the end of the laser pulse, the position of the thermal wave front at the symmetry axis has the mass coordinate Δm fCu = ρ0Δz 0f = 1.25 × 10⁻³ g/cm2 (ρ0 = 8.93 g/cm3) and for the plastic target Δm fCH = 2.4 × 10⁻⁴ g/cm2 (ρ0 = 1 g/cm3). The ratio Δm fCu/Δm fCH = 5.21. The increase of the evaporated mass of the Cu target in comparison with the plastic target is a consequence of a deeper heating of the target by the electron heat conductivity wave in the case of the Cu target compared to the case of the plastic target. This is evident from a comparison of the coefficients of thermal conductivity for the plasmas of both targets in the context of this task, as an evaporated mass corresponds to the heating depth of target by thermal wave during the period of laser pulse duration Δm ~ (χτL)1/2. The coefficient of thermal conductivity

is determined by the plasma density, the coefficient of electron heat conductivity and the specific heat C V. Spitzer's coefficient of electron heat conductivity in its usual form was used in the numerical simulations

here T e is the electron temperature, m e and e are the mass and charge of the electron, respectively, Λ is Coulomb logarithm, Z* and Z 2* are the charge and squared charge of ions averaged over the different types of ions.
(Color online) The dependences of the electron temperature T e, density ρ and velocity u of the plasma on the axis of symmetry on the mass coordinate at the moment of the end of the laser pulse. The mass is counted from the irradiated surface of the target.

Using (18), bearing in mind that C V ~ Z*/A* (A* is the average atomic mass of ions), choosing the characteristic value of temperature on the heat wave front, T e = 100 eV, and substituting for the Cu plasma the values Z* = 19, Z2* = 361, A* = 64, and for the plastic plasma Z* = 3.5, Z2* = 18.5, A* = 6.5, the following value of the ratio of masses of evaporation parts of the Cu and plastic targets could be obtained

This is close to the results of numerical simulations.
As it was mentioned earlier, at later times, after the laser pulse end, all the absorbed energy is transferred into the kinetic energy of moving ions:

where dV represents the volume element, ρdV is the mass element, M ev ≈ Δm fS L, S L is the laser cross-section incident on the target, (u 2)* is the square of the plasma velocity averaged from the mass point of view. The efficiency of absorption in the cases of the Cu and plastic targets is very close to 100% (99% for Cu and 97.5% for plastic) due to the short wavelength of the laser beam. Therefore in (19) E k approximately equals the incident laser energy. Consequently, the ratio of the squares of the Cu and plastic velocities can be estimated: (u 2)*CH/(u 2)*Cu ≈ Δm fCu/ΔmfCH = 5.21. The ratio of the characteristic velocities of plasma expansion is u CH/u Cu ≈ (5.21)1/2 = 2.28. This is in a good agreement with the velocity values in Figure 8.
In Figure 10, the plasma equidensitograms for the plastic and Cu targets are plotted for the same instants (2, 5, and 8 ns) as those recorded in the experiment (see Figs. 2 and 3). The experimentally and numerically determined distributions correspond to each other assuming the mean ion charges as Z*CH = 3.5 and Z*Cu = 19. During the process of the plasma expansion, the partial ion recombination takes place and the mean charge decreases. However, this effect is not important for the results presented in Figure 8. When the Z* values are changed, the electron isodensity lines do not move too much. The lines displacement is not significant as the density is shown in the wide range of values and doubling the Z* decrease due to recombination results in the density isoline transition to the neighboring isoline position. The qualitative coincidence of the electron isodensity lines obtained experimentally with the numerically computed ones should be noted. The computations for the Cu target show a prolonged existence of the narrow area of the plasma expansion in the axis vicinity in which the isodensity lines run away from the target whereas in the case of the plastic target the isodensity lines are shifted toward the target. Eventually, due to the plasma density decrease and independently on the plasma expansion character, the plasma density isolines will move to the target. However, the planar geometry of the Cu plasma expansion causes this isolines movement taking place later.
Simulated sequnces of plasma equidensitograms (density in g/cm3) for plastic and Cu targets. The instants in equidensitograms are related to the laser pulse beginning.

The numerical modeling presented here allowed us to come to the following conclusions. Due to the increase of evaporated mass of the Cu target in comparison with that of the plastic one and, simultaneously, the decrease of the Cu plasma expansion, the inertial stage of the Cu plasma expansion runs in the planar geometry. The plasma flow at the large distance from the target has the stream form with the diameter corresponding to the interaction spot. Much higher velocity of the plastic plasma expansion during the laser pulse action leads to the inertial plasma expansion in the geometry close to the spherical one. In that case, the transversal dimension of the ion beam increases, whereas the density falls rapidly with the increasing distance from the target.
It should be noted that the consideration of a thermal self-emission of plasma will lead to a more pronounced flat character of the expanding laser-produced plasma from Cu targets. The results of experiments show that under irradiation of Cu targets by the first-harmonic radiation of PALS laser, the energy losses due to plasma self-emission are significant enough and constitute about 60% of the incident laser energy (Gus'kov et al., Reference Gus'kov, Kasperczuk, Pisarczyk, Borodziuk, Ullschmied, Krousky, Masek, Pfeifer, Skala and Pisarczyk2007b). Reduction of the plasma thermal energy due to plasma self-emission will lead to a decrease of the velocity of plasma. Consequently, the jet-like plasma expansion for Cu targets will be more pronounced. In the case of laser-produced plasma from targets made of light elements, such as plastic targets, energy losses due to thermal self-emission of plasma are insignificant and do not exceed several percent. Therefore, it practically does not change the spherical character of plasma expansion from these targets.
7. CONCLUSIONS
The experimental and theoretical results presented in this paper constitute a rich material which allowed us to understand better the processes accompanying the plasma jet forming. This paper also answers the question why no plasma jet is produced in the case of the low atomic number target material, represented here by plastic.
The most important achievement of this paper is finding one additional mechanism taking part in the plasma jet forming toward the two such mechanisms considered so far, namely the annular irradiation and the plasma radiative cooling. Based on numerical simulations, the influence of the plasma expansion regime was identified: in the case of Cu, the planar expansion regime is taking place and in the case of plastic, it is the spherical one. In our opinion, all these three mechanisms play their respective roles in the plasma jet forming. However, the contribution of these mechanisms toward the plasma jet production seems to depend on the target irradiation conditions.
Our earlier experiments at PALS laser system have proved that the decisive role in the plasma jet forming plays the annular target irradiation. The gas (iodine) laser PALS tends to generate a central depression in the intensity distribution. This is becoming more pronounced with increasing laser energy. In spite of a reasonably small first harmonic intensity depression in the center of the laser beam cross-section before its focusing (not more than 10%), the resulting third harmonic central depression can be much deeper. Thus, the PALS laser beam properties exhibit the annular target irradiation geometry causing part of the generated plasma to collide on the axis. Because of the radial component of plasma velocity directed toward the axis, a great part of the kinetic energy of the plasma taking part in the collision is transformed into the thermal energy thus additionally heating the on-axis plasma. Consequently, the radiative cooling can play its role at later times, i.e. after the plasma jet creation, in case of high Z materials.
If the target irradiation is homogeneous or exhibits only a small depression, the planar Cu plasma expansion should dominate. The numerical modeling confirms that even in that case, the plasma jet creation is possible. In this case, the plasma radiative cooling can play an important role by decelerating the Cu plasma during the laser pulse and creating better conditions for the planar plasma expansion.
In the case of the plastic plasma, the two contradictory mechanisms are involved, namely the annular target irradiation and the spherical character of plastic plasma expansion. Influence of the latter appears to be stronger and, consequently, no plasma jet is produced.
The experiment performed confirmed the correctness of the hydrodynamic model of laser-driven evaporation of the planar target material at the PALS radiation conditions. The prediction of the Cu layer thickness evaporating during the laser pulse, based on presented theoretical model, was found sufficiently accurate for a successful design of this experiment.
ACKNOWLEDGEMENTS
The work was supported in part by the Polish Ministry of Science and Higher Education (project No. N N202 076635), by the Access to Research Infrastructures activity in the 6FP of the EU (contract RII3-CT-2003-506350, Laserlab Europe) as well as the HiPER project (grant agreement No 211737). It was also supported by the Ministry of Schools, Youth and Sports of the Czech Republic (project No. LC528 and grant KONTAKT ME933) and by the IAEA Research Contract No. 13781.



