

Introduction
Chile Solidario (CS) is a social protection programme designed to end extreme poverty. The programme emerged during the early 2000s in response to evidence that previous efforts to reduce extreme poverty in Chile were failing. The design of CS was premised on the idea that families living in extreme poverty are marginalised from the economy and social policy networks and require specialised support to facilitate social insertion and access to opportunities. For the purposes of the programme, extreme poverty was understood as a multi-dimensional problem characterised by low income and a low level of economic, human, social and psycho-social assets. Unlike more conventional conditional transfer programmes in which monetary benefit plays a central role in alleviating poverty and encouraging participation, however, in CS the cash transfer element is a secondary consideration. Rather, a key element of the programme is its work with families through the apoyos familiares (family support workers), social workers who accompany each family over a two-year period. The apoyos familiares aim to help beneficiaries achieve a set of 53 minimum conditions for empowerment and social insertion, and the family support component of the programme plays a key role in the coordination of public benefits for the very poor. CS works with existing programmes and benefits based on the premise that the missing element in these programmes is the connection between poor families and social policy networks rather than a lack of opportunities. As such, participating families enjoy preferential access to social programmes in the areas of employment, training, health, housing and education, as well as access to monetary subsidies targeted at specific groups such as children and senior citizens and a small cash voucher meant to encourage beneficiaries to remain in the programme. The CS intervention is designed to last five years: the first two focus on achieving a minimum set of conditions through the apoyos familiares, and the next three form a follow-up phase during which subjects continue to enjoy preferential access to social programmes and guaranteed access to monetary subsidies.Footnote 1
This article evaluates the impact of CS on income, employment and housing for the first cohort of programme participants. This cohort entered the programme in 2002 and was selected for the study due to data availability. The study builds upon three previous impact evaluations of CS, which mostly refer to the first cohort.Footnote 2 The first was carried out by Galasso in 2006 and presents an evaluation for 2003 and 2004. In this evaluation, Galasso finds that CS improves access to education and health services, subsidies, and employment and housing improvement programmes. However, she finds no evidence that the programme has led to improvements in the areas of employment or income. The second evaluation, by Perticara, extends analysis to the period 2003–6. The author finds no evidence of improved labour insertion or capacity to generate income in urban areas, though some is found in rural areas. She also establishes that the programme has a strong positive impact on access to housing improvement and labour intermediation assistance programmes, positive impacts on access to health and education, and a particularly important impact on the beneficiaries’ positive attitude. The third evaluation was organised by the World Bank and implemented by Galasso and Carneiro in 2008. The authors examine the programme's impact between 2003 and 2006 and find positive results for rural poverty and indigence reduction. According to this study, CS had positive effects on the use of social services and participation in labour training and intermediation programmes in rural areas, and positive effects were again found in the beneficiaries’ sense of self-worth and self-sufficiency.
All three evaluations were based on CS survey panel data. They report on a follow-up survey of individual participants and a control group identified through the 2003 Encuesta de Caracterización Socioeconómica Nacional (National Social and Economic Typification Survey, CASEN) which was the first round of the panel. Additional information was gathered in 2004 and 2006. The questionnaire covers residents, housing, education, employment and income. The 2004 and 2006 survey rounds also gathered data on participants’ subjective perceptions. However, the CS survey panel presents a set of problems that limit its usefulness for impact evaluation. The main shortcoming is that the baseline was constructed in 2003, when the programme was already ongoing: 94 per cent of households in the first cohort of the survey had already begun the programme.Footnote 3 As a result, there is no adequate ‘before and after’ distinction.Footnote 4 This is known as ‘baseline contamination’. If there are short-term programme effects, the ex ante measurement is inadequate for that database. Other limitations include: (1) the CS panel results present comparability problems because the questionnaire was changed; (2) many respondents were lost (attrition), which introduces potential selection biases in the respondent sample; and (3) problems with the recording of individual identifiers made it impossible to make observations that would cover all of the rounds.
The added value of the present study is that it resolves these problems through the use of a database of the Comité de Asistencia Social (Social Assistance Committee, CAS) form records.Footnote 5 These files are based on a socio-economic assessment survey that was used to target social programmes. All CS participants have a CAS form relating to before and after the intervention. The data in the CAS form have not been organised and systematised prior to this study, which is the first to carry out an impact evaluation using these data in Chile. The benefits of using these data include the establishment of a baseline that predates the programme and the use of an unaltered questionnaire that allows for a better comparison of the socio-economic levels of households. Also, the CAS form's coverage is broad given that it addresses approximately 40 per cent of Chile's population and 80 per cent of lower-income individuals. This database contains a large number of potential controls for CS participants.Footnote 6
We should also, of course, point out the disadvantages of these data. Principally, they do not cover all of the aspects associated with CS. This restricts the scope of the assessment to variables of income, employment and housing. No information is available on the effects of the programme on education, health or psycho-social aspects, which means that the evaluation is partial in nature.
The evaluation is based on difference-in-difference estimates that compare the change in outcomes (before and after the intervention) between participant and control groups. The latter are identified by using a matching propensity score such that each participant is ‘matched’ to a set of cases with very similar observable characteristics. The first cohort exhibits positive but small average impact on employment and housing that can be attributed to the programme. There is a negative impact on self-generated income that could be linked to a substitution of greater monetary subsidies, as has been observed in other similar programmes.Footnote 7 We do note that participants in the first CS cohort show absolute gains in all of the areas analysed, but the gains decrease or disappear when the comparison to the control group is made. The results suggest that a significant part of the overall gains can be attributed to environmental conditions predating the programme, which introduces doubts regarding the adequacy of the hypothesis of beneficiary families isolated from the economy and social networks. In addition, gains from CS tend to be concentrated in the first phase and followed by a certain level of decline. This shift seems to be associated with the family support phase (the first two years of the programme), and suggests that the benefits may not be sustainable over time and that some households do not develop adequate autonomy.
Qualitative studies indicate that a lack of information and disconnection from networks is produced after the first phase.Footnote 8 Evidence based on qualitative studies points to a lack of coordination and adaptation of the social programmes when it comes to extending services to participant families.Footnote 9 As we have noted, a significant part of the supply of CS services comes from existing programmes. However, the programmes must provide quality services and adapt benefits to the profile and needs of CS member families. They must also promote the replacement of the assistance relationship that prevailed in some cases, and several qualitative studies suggest that this has not always occurred. Unfortunately, the CAS form data do not provide information on the families’ psycho-social competence, which is an important component of CS. Qualitative studies suggest that only a fraction of families developed skills that would allow them to take part in economic and social networks in an autonomous manner.Footnote 10
The Chile Solidario System
The origins of Chile Solidario date from the early 2000s, when officials at the Ministerio de Planificación (Ministry of Planning, MIDEPLAN) began to postulate that there was a sort of ‘hard’ poverty that did not respond to economic growth or social policy.Footnote 11 This observation was made in a context in which the extreme poverty rate had remained practically unchanged between 1996 and 2000, after having dropped from 12.9 per cent to 5.7 per cent between 1990 and 1996.Footnote 12 The discussion was influenced by local experiences that included programmes directed at poor families launched by local governments and NGOs. Based on these programmes, the Programa Puente (Bridge Programme) was designed to provide comprehensive support for such families. The centre of the initiative was the family support professional, who would help participants join social networks and achieve a set of minimum living conditions in education, health and family dynamics. The Programa Puente was presented to the Budgeting Office for funding but was rejected initially. It was only following the direct intervention of the minister of MIDEPLAN that funding was provided for a pilot programme to be implemented in 57 municipalities for 14,000 families. MIDEPLAN assigned the Fondo de Solidardid e Inversión Social (Solidarity and Social Investment Fund, FOSIS) the task of implementing the pilot programme based on the agency's experience.
While the Programa Puente was being put in place, the Budgeting Office was designing an anti-poverty policy with the technical support of the World Bank to create a network of social services and bring together the plans and programmes introduced by different ministries and public-sector agencies. The diffuse and sectoral structure of social programmes made it hard to access services and was thought to be one of the main causes of the stagnation of the extreme poverty rate. The new system was meant to offer a ‘single-window’ system of social services directed at the poorest members of society. The unit of intervention was to be the family (in contrast to the previous system), and the programme was to have integrated institutional management and information systems.
In April 2002, President Lagos created a commission of representatives from MIDEPLAN, FOSIS and the Budgeting Office and asked its members to prepare a proposal for an integrated programme for combating poverty. The commission's proposal was based on the Programa Puente and included the work of the Budgeting Office. The president approved the initiative, and CS was born. Taking advantage of the pilot programme and using existing legal structures – a proposal for a law that would give the new policy its own legislation was postponed until October 2002 – allowed CS to be implemented immediately.
CS was thus the result of the superimposition of a set of existing anti-poverty initiatives developed by the state and civil society and with the political will to develop a strategy for combating poverty. Its launch benefited from a high degree of consensus among stakeholders regarding the advantages of an intersectoral anti-poverty programme. At this point discussions focused on two aspects related to the initiative's implementation: increasing the role of the municipalities and ensuring that family support professionals did not become political proponents of the government.Footnote 13 Supporting legislation was eventually passed unanimously by Parliament in May 2004, two years after the programmes had begun. The legal agreement provided the programme with greater institutional stability.
The objectives of CS can be synthesised into three main components: first, to achieve social integration for families living in extreme poverty; second, to provide families that face adverse conditions with services that mitigate losses of well-being; and third, to help families living in extreme poverty gain access to the government's social network.Footnote 14 To achieve these objectives, CS promotes the achievement of 53 minimum conditions for well-being in seven areas, namely health, education, housing, employment, income, family dynamic and identification. This wide range of objectives is related to a multidimensional vision of poverty.Footnote 15
The CS system has three principal forms of intervention. First, psycho-social support consists of two years of care provided by a professional or technician through 21 home visits.Footnote 16 The family support professional establishes a plan designed to help families achieve the 53 minimum quality-of-life conditions. This stage is implemented by the Programa Puente and executed by the municipalities. Technical support and supervision are provided by FOSIS. Second, CS provides member families with preferential access to social programmes. These can be grouped into the following seven areas:
1. Personal identification: Participants are partially exempt from the cost of obtaining identity documents and are fully exempt from the cost of obtaining the Military Service Certificate and Criminal Record Certificate.
2. Health: Participants have guaranteed access to a health plan, comprehensive diagnosis and treatment of depression in clinics, preferential access to dental programmes and health care for seniors, mental health services, oral health services for children, and drug use prevention and rehabilitation. Technical support is provided to those with disabilities.
3. Education: Participants have preferential access to childcare, preschools and extended school days as well as programmes that offer extra help and services within the school system.
4. Family dynamics: Participants have preferential access to social development programmes as well as services focused on domestic violence and the strengthening of the links between at-risk children and their parents.
5. Housing: Participants have preferential access to CS housing and social development services, informational services and land ownership certificates.
6. Employment and income: Participants have preferential access to labour reinsertion and employment programmes, support for economic activities, training programmes for domestic workers and local agricultural development schemes.
Third, CS participants enjoy guaranteed access to government subsidies including the Subsidio Único Familiar (a family subsidy for minors, SUF), the pension assistance programme for the elderly and disabled and those with mental disabilities (Pensión Asistencial, PASIS), a subsidy designed to keep young people in high school, and a potable water subsidy that covers 100 per cent of the recipient's water bill for up to 15 cubic metres per month.Footnote 17 Finally, families receive a monthly payment that is allocated in decreasing amounts while they participate in the Programa Puente. The payment is made to female household heads or the female partners of male household heads, and is worth an average of US$ 20.Footnote 18 A post-intervention transfer of US$ 8 per month is given to each family for 36 months after exiting the Programa Puente. The goal of the cash transfer is to cover transaction costs associated with the families’ access to social services networks. The cash transfer amount is low compared with the payments used in anti-poverty programmes elsewhere in Latin America.Footnote 19
Between 2002 and 2006, families living in extreme poverty were selected for the CS programme based on data from the CAS form. This means-test targeting instrument was introduced in the early 1980s and underwent a series of changes in accordance with changes in living conditions throughout the country.Footnote 20 CS beneficiaries were selected using the CAS 2 form, which was used from 1998 to 2006 (henceforth referred to as the CAS form).Footnote 21 The CAS form evaluates households based on 13 variables that measure housing, assets (durable goods and income), employment and education. The CAS index is a weighted average of these variables.
The families and individuals selected based on the CAS scores are invited to participate in the CS programme. In order to do so they must agree to meet the conditions set out by the programme. Approximately 95 per cent of the families who are invited to participate in CS do so.Footnote 22
The selection procedure establishes CAS form cut-off points at the municipal level as follows: (1) the percentage of the population in extreme poverty in each municipality (pm) is estimated in the CASEN survey, which is representative of the majority of municipalities; (2) the CAS form cut-off point for each municipality is the CAS score of the corresponding pmth household with the lowest CAS score in municipality m (that is, the household that corresponds to the pmth percentile of the distribution of CAS scores within municipality m); (iii) families whose CAS score is lower than the cut-off point for their municipality are selected. If the municipality has no representativeness in the CASEN survey, the regional cut-off point is used.
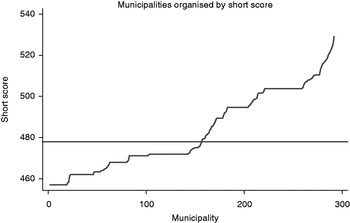
The disadvantage of this approach is that the estimate of extreme poverty at the municipal level is subject to high sample error given that the number of households surveyed in the CASEN survey is low at the municipal level (around 200 observations on average). This introduces a significant loss of accuracy in the selection of beneficiaries and can cause errors of inclusion and exclusion.Footnote 23 Although it did not aim to do so, the procedure has proven functional for the construction of control groups given that it is possible to find untreated households that have similar initial CAS scores to treated households.Footnote 24Figure 1 shows the distribution of the municipal cut-off score, which varies between 458 and 525 points, excluding outliers. These values are equivalent to the seventh and 45th percentiles of the CAS score distribution in 2002. The reference line at 470 points illustrates the application of a national cut-off score that corresponds to the percentage of the population living in extreme poverty (6 per cent).
Minimum CAS Score for Entry into Chile Solidario
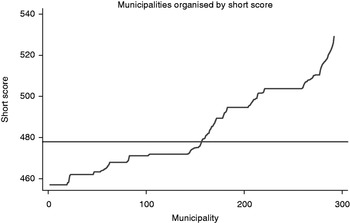
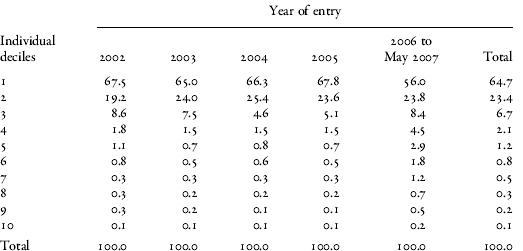
Table 1 shows the breakdown of CS participants in the distribution of CAS scores. The procedure is based on the CAS database of each calendar year as the annual selection process is based on current CAS scores for each period. Approximately two-thirds of CS beneficiaries belong to the first decile of CAS distribution, and nearly 90 per cent belong to the first two deciles. The CAS scores from the 2003 CASEN survey are inputted in order to determine what this means for the population living in extreme poverty.Footnote 25 The results show that the CAS score that corresponds to the threshold of extreme poverty was 470 points in 2002, which corresponds to the tenth percentile of CAS form distribution.
Distribution of CS Entrants by CAS Score Decile
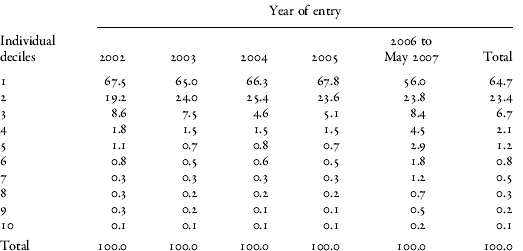
Source: authors’ calculations using CAS form database and CS records.
The CAS form remains valid for two years, at which point the family must update the information in order to renew or apply for additional benefits. Each individual's national identification code (Rol Único Nacional, or RUN) is recorded so that the information from the CAS forms from different time periods can be linked. This also makes it possible for the CAS form to be linked to the CS database and other databases that use a RUN identifier.
This study's evaluation is based on a database constructed using CAS form records from different years.Footnote 26 The output is a longitudinal panel of CAS data that allows CS families to be identified and monitored. The population with a current CAS form in a specific year represents approximately 40 per cent of the national population. This includes all CS families as well as a large potential universe of controls.
Our methodology is based on the calculation of difference-in-difference estimators using a matching propensity score for the selection of the control group. Difference-in-difference estimators measure the programme's impact as the change in outcomes of participant and control groups between the pre- and post-treatment periods.Footnote 27 Propensity score matching proposes that if selection is based on observable variables, treated individuals can be paired with control subjects with a similar likelihood of participation. Specifically, the method uses the predicted likelihood of participation to pair each treated individual with one or more people who did not participate (from the group of potential controls). All impact estimates are based on common support such that there are no controls outside of the range of the propensity score of treated individuals. The evaluation uses the five closest neighbours as controls for each participant.
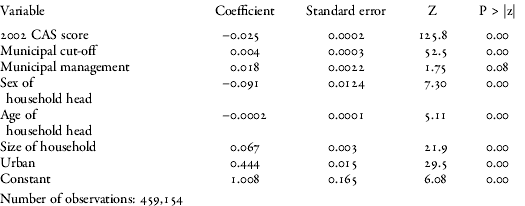
The likelihood of access is modelled through a probit regression model based on two types of variables: (1) household characteristics, including initial CAS form score, single-parent or two-parent home, rural or urban location and the age of the transfer recipient; and (2) variables related to the municipality of residence such as the cut-off CAS form score for programme eligibility and an indicator of municipal management efficiency.Footnote 28Table 2 presents the results of the probit regression for participation in CS. The likelihood of participation depends negatively on the CAS form cut-off score in 2002, which is by far the most important variable. The effect of the CAS form cut-off score for the municipality is positive given that a higher cut-off score provides more vacancies for entering the CS programme. Controlling for the CAS score, the likelihood of entry depends positively on household size, having a female household head, living in urban areas and the municipal management indicator, and depends negatively on the age of the household head.
Probit Estimate for Participation in CS
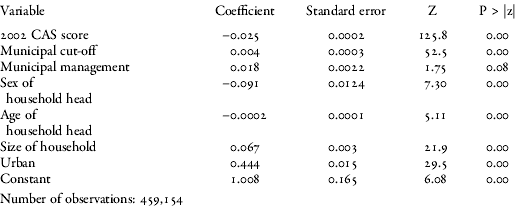
Source: authors’ calculations using CAS form database and CS records.
Finally, it is important to consider that all CS families must have a CAS evaluation on file from no more than two years prior to their entry into the programme. CS also requires that the family have a valid CAS evaluation when it exits the programme.
Treated and control subjects
The present evaluation considers treated subjects to be households that have an ‘initial’ CAS measurement during the six months prior to entry and a ‘final’ measurement during a period greater than 12 months following entry. The first condition ensures that the initial measurement will be close to but prior to the start point so that it will not be contaminated by the programme. The second condition establishes a minimum stay of one year so that the programme's impact for different ‘treatment doses’ can be evaluated.
The control group receives a similar treatment in terms of the initial and final CAS measurements in order to unify the temporal aspect in the impact evaluation. The potential universe of controls thus includes those who have initial and final measurements in periods that are comparable to those of the treated subjects. The effective set of control subjects is selected from this universe as those whose likelihood of having been selected for CS is most similar to that of the participants. This is done to ensure that households most similar to the treated households are chosen so that they serve as the latter's counterfactuals.
The evaluation considers as treated the first cohort that entered the programme between June 2002, when the policy was implemented, and December of that year. The six-month requirement means that the treated group includes subjects that have an initial CAS form measurement from 2002. The potential universe of control subjects thus includes all households with an initial measurement in 2002. These include (1) households that enter the CS programme later as long as their final CAS measurement preceding their entry comes later than June 2003, when the first participants finish their first year; and (2) households that do not enter the programme and have a final measurement later than June 2003.
Other cohorts are not considered for two reasons: (1) the limitation of the existence of a CAS form through mid-2006 means that later cohorts would have a shorter period of participation on average, limiting the period of intervention that is subject to the impact evaluation; and (2) those who enter later can be used as possible controls for the first cohort, as they are the best potential control subjects. Readers who are interested in the details of the procedure are referred to the Appendix to this essay.
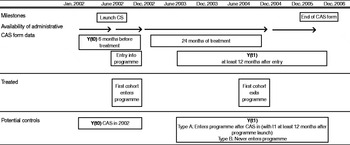
Structure of Administrative Data
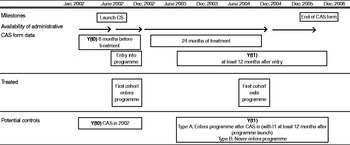
Figure 2 shows the use of available data and the definition of treated households and potential controls. As noted above, CS began in June 2002 and the first cohort of treated subjects entered the programme between June and December of that year. Treated subjects are those for whom CAS form data are available. The information must be less than six months old and dated between January and December 2002. Potential control subjects did not participate in CS but did have a 2002 CAS form. The treatment lasts 24 months, with the most intensive part taking place during the first year. As a result, the CAS form that is used to measure the monitoring line is generated at least 12 months after entering the programme; that is, between June 2003 and December 2006. The same window is used for potential controls.
As household composition changes over time, households are monitored through the CS cash transfer recipient – that is, the household head in single-parent cases and the female in the case of one-couple households. The same criterion is used for monitoring possible controls.
The evaluation horizon is between 2002 and mid-2006. The first year is determined by the launch of CS and the final year by the replacement of the CAS form, which is the building block of the database. The effective measurement interval fluctuates between 15 and 52 months, with an average duration of 35 months.
Descriptive statistics
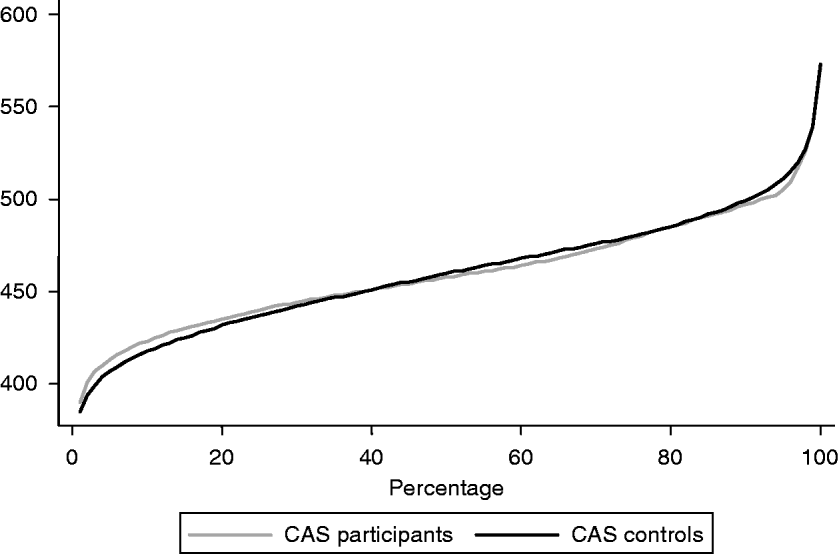
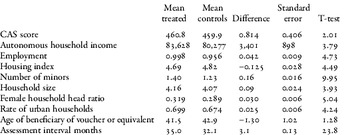
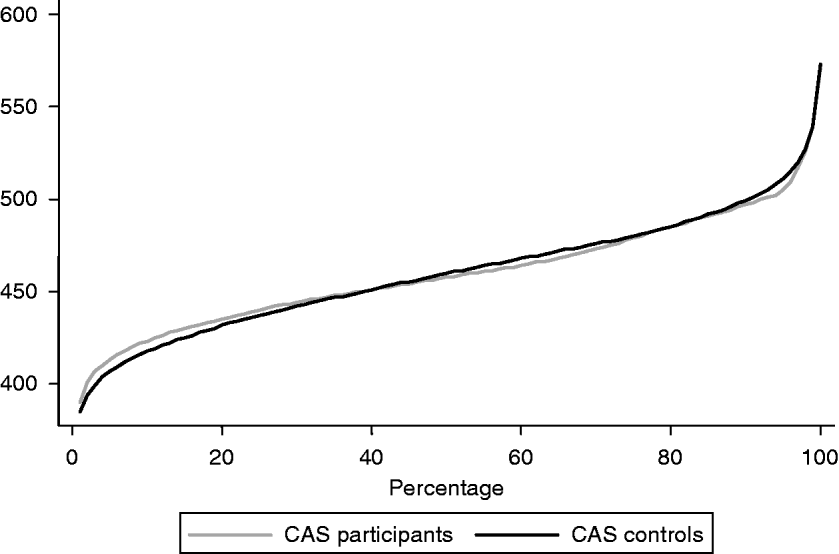
Table 3 presents descriptive statistics for the initial value of a set of socio-economic characteristics of treated and control subjects. The groups are quite similar, as shown by the average values of the characteristics, although the statistical tests tend to reject the hypothesis of equality due to the large number of underlying observations. The similarity between the treated and control groups can be illustrated by the distribution functions of the 2002 CAS score in Figure 3, which is the most important variable used in participant selection. The distributions practically overlap, showing that the control group is an almost exact replica of the participant group with regard to the CAS score (and the underlying socio-economic assessment of households).
Initial CAS Score Percentiles
Descriptive Pre-Treatment Statistics, CAS Form Database, 2002 Cohort
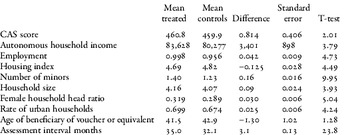
Source: authors’ calculations using CAS form database and CS records.
The outcome variables are self-generated income, the number of household members employed and a housing quality index. The latter is constructed using the number of housing dimensions that meet minimum conditions considering the construction materials used for the roof, floor and walls; access to public electricity, potable water and sewage disposal systems; and the number of bedrooms compared to the number of residents.
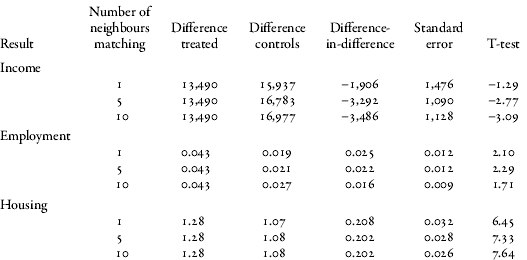
Table 4 shows how the results for the samples of participants and control subjects and the difference between the two (difference-in-difference) change over time. There are three specifications for control subjects according to the number of closest neighbours to each treated subject set in the propensity score: 1, 5 and 10. The results are relatively robust to the selection of the number of control subjects, such that the results will be presented in the case of the five closest neighbours.
In absolute terms (not relative to the control group), the first cohort presents important progress in all outcome variables during the evaluation period. Self-generated income grew by CL$ 13,490 (US$ 27) in real currency from 2007, employment increased by 0.043 individuals per household and the housing index increased by 1.28 points. All of this corresponds to averages of the set of treated households and is statistically different from 0 (t-tests not reported on the table). In terms relative to their initial values, shown in Table 5, the respective values are 16, 4 and 27 per cent.
Impact of CS by Number of Neighbours Matching
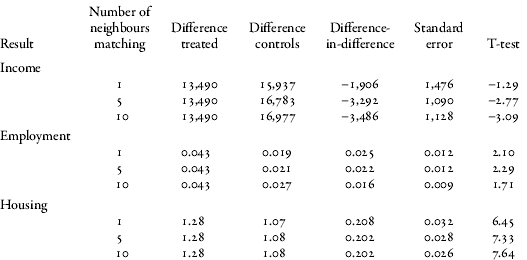
Note: the number of observations in the estimates is 8,495.
Source: authors’ calculations using CAS form database and CS records.
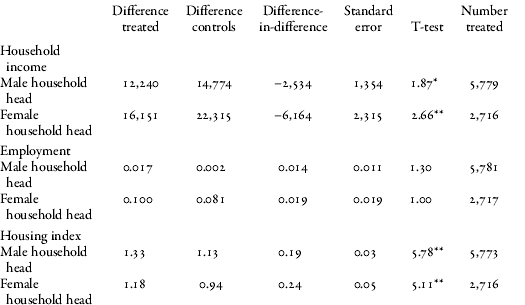
Impact of CS by Gender of Household Head (5 Closest Neighbours)
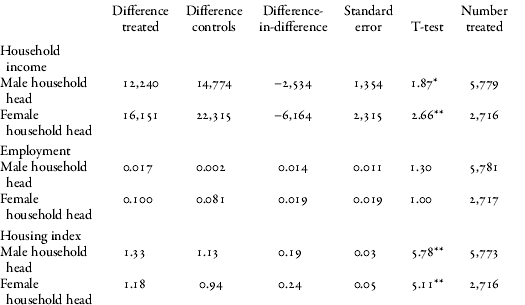
* Parameter significant at 10%.
** Parameter significant at 5%.
Source: authors’ calculations using CAS form database and CS records.
The attribution of results to the CS programme is quantified in the difference-in-difference parameter, which measures the net gain over time of participants compared to that of controls. The gains that can be attributed to the programme drop to 0.022 employed individuals and 0.2 points in the housing index, while self-generated income drops by CL$ 3,292 (US$ 6). Thus, the results that can be attributed to CS are positive but small for employment and housing. The absolute gains are more important and suggest that CS participants benefit from changes in the economic environment. In the case of self-generating income, the gain that can be attributed to the programme is negative. One possible explanation for this is that the income evaluated excludes subsidies. Given that CS guarantees access to monetary subsidies when the eligibility requirements are met and provides cash transfers, it is very likely that the households’ total income has experienced a net gain that can be attributed to the programme. Moreover, the increase in income through subsidies could cause a decrease in other sources given that families can substitute one form of income for another.
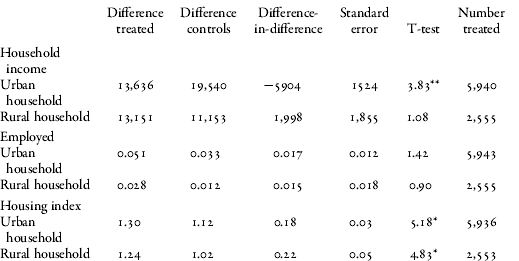
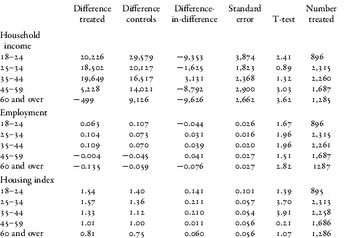
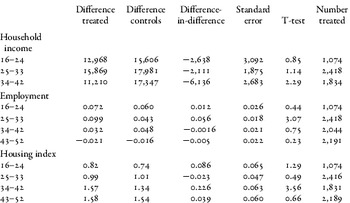
The results are also examined at the level of subgroups including urban and rural households, male and female household heads, ages of cash transfer recipients and the measurement interval or proxy of the treatment dose. Tables 5–8 show the impact estimators for each outcome variable.
The results for subgroups do not come from the simple disaggregation of the results of the set in Table 4 insofar as the control group is defined for each grouping. For example, the control group for rural households is the closest neighbours within the subsample of rural households, and the equivalent is true for urban households. Controls chosen in this manner are not necessarily the same ones selected at the sample level.
The comparison between participant and control subjects establishes that the general impact of the CS programme is similar for male and female household heads. The impact is negative for self-generated income and positive for employment and the housing index. However, the parameters of impact associated with employment are not statistically significant and lose their statistical relevance in smaller samples. We note that female household heads present greater absolute increases in income and employment than their male counterparts for both groups (Table 5), a result which is driven by large increases in the overall number of employed women during this period.
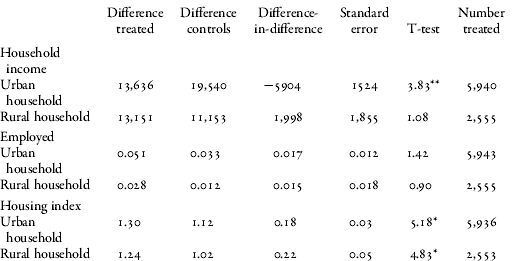
Impact of CS by Urban or Rural Household (5 Closest Neighbours)
* Parameter significant at 5%.
Source: authors’ calculations using CAS form database and CS records.
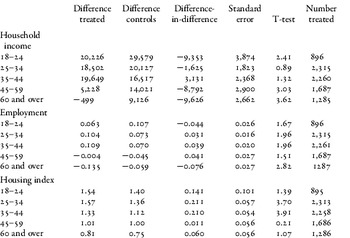
Impact of CS by Age of Benefit Recipient (5 Closest Neighbours)
Source: authors’ calculations using CAS form database and CS records.
The estimate of the impact of CS at the level of urban and rural households is presented in Table 6. The results are fairly homogeneous for employment and housing, and there are no differential impacts by geographic area (rural/urban). The estimated coefficients of difference-in-difference are statistically significant for housing, but not employment. Results for income differ significantly between rural and urban areas. CS participants in rural areas do show net gains in income as compared to their control group, whereas those who live in cities perform less well compared with the control group.Footnote 29
The age of the transfer recipient is used as a proxy for the household's life cycle. The analysis is performed on the basis of five age subgroups: 18–24, 24–34, 35–44, 45–59 and 60 and over (Table 7). Households with recipients up to age 44 obtain greater absolute benefits than those with recipients aged 45 or older. This is valid for CS participants and the control group and can be interpreted in terms of the life cycle. Specifically, it is not surprising that there are absolute drops in employment in households with the oldest recipients because of retirement.
In terms of the impact that can be attributed to the CS programme, households with recipients in the subgroups 25–34 and 35–44 present the best results. These households demonstrate gains in both employment and housing that are statistically greater than those presented by the control group. Households with recipients between 25 and 34 are the only ones that present a positive difference-in-difference coefficient for income, though it is not statistically significant.
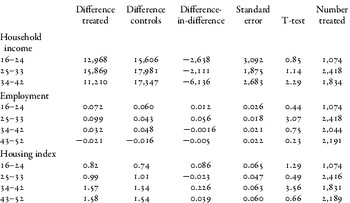
Impact of CS by Measurement Interval (Months)
Source: authors’ calculations using CAS form databases and CS records.
In order to examine the impact of CS by treatment dose, the population is divided into four nine-month subperiods according to the interval between initial and final CAS form measurements and compared with controls with the same characteristic. The resulting measurement intervals in terms of months are 16–24, 25–33, 34–42 and 43–52. We note that this variable approximates but does not coincide exactly with the duration of the intervention given that the initial measurement occurs three months prior to entry into CS on average.Footnote 30
The results show that the gain in income that can be attributed to CS is negative but small for the first two periods – approximately CL$ 2,600 (US$ 5) to CL$ 2,100 (US$ 4) – and without statistical significance. During the third period, the negative difference increases by over CL$ 6,000 (US $12) and is statistically significant. The most interesting result, however, is the decrease in absolute gains in participants’ incomes during the third period. After having grown by between CL$ 12,000 (US$ 23) and CL$ 15,000 (US$ 29) during the first two periods, it drops to CL$ 11,200 (US$ 22) during the third. On the other hand, control subjects show a continuous increase in income, as one would expect in the context of economic growth.Footnote 31
Increases in employment are also concentrated in the first two periods, which is when CS participants show important gains that are both absolute and relative to the control group. As the evaluation horizon extends, net employment gains decrease and eventually turn negative, though they are not significant. Diverse qualitative evaluations show that the psycho-social support element received the best evaluations from CS families in terms of allowing for the establishment of a closer relationship with public institutions and positive changes in family dynamics, empowerment and access to information.Footnote 32 However, the removal of family support after two years may generate an information vacuum and a lack of connection to institutional networks.Footnote 33 This could help explain the drop in income and employment gains.Footnote 34
By contrast, the housing quality index presents increasing absolute gains for both groups. This is the expected result of a variable of stock in which it is unlikely that the gains obtained will be lost during the next period. CS housing programmes provide appropriate materials for exterior and interior walls and floors, and household equipment for kitchens and bedrooms (beds, blankets, etc.). The gains in housing improvement tend to remain given that they consist of durable goods that continue to be present in the years following their acquisition.
Discussion and Recommendations
The results establish that first-generation CS participants present absolute gains in self-generated income, employment and housing. However, the gains that can be attributed to CS are relatively small in employment and housing, and negative for self-generated income. Estimates at the subgroup level show that CS would have had a greater impact in households with transfer recipients aged between 25 and 44 during the first stage and in rural areas. There are no statistically significant differences in terms of the gender of household heads.
The analysis is valid for the first cohort, and the dimensions evaluated correspond to the subset of outcomes measured by the CAS form. This excludes the subsidies, which, given the guaranteed access offered to CS participants, could have contributed to increases in total household income for participants over control subjects’ income. Moreover, increases in subsidies may lead to decreased self-generated income if there is some level of substitution between the two. In addition, the CAS data do not allow researchers to evaluate potential CS results in health and education or adults’ psycho-social status. Qualitative studies show high valorisation of family support professionals among beneficiary families as ‘bridges’ to social programmes and in promoting self-esteem and faith in the beneficiaries’ abilities, and these are necessary elements in an anti-poverty policy.
It is important to ask what factors made the CS results less positive than expected. The CS programme's ability to meet its objectives depends on the model underlying the programme design and the quality of the policy implementation. CS is based on three main premises: (1) that a group of families is marginalised from economic growth and the social network and lives in a situation of indigence or extreme poverty; (2) that existing public programmes can provide the assistance and encouragement these families need in order to overcome extreme poverty; and (3) that social integration of very poor families requires a ‘bridge’ to social programmes, establishing commitments and generating skills in the psycho-social area. The validity of each of these postulates is discussed below, based on the results of the impact evaluation presented in this article and information from other studies.
First, the initial CS assessment refers to families in extreme poverty as a marginalised group that experiences difficulty accessing social programmes as a result of chronic poverty. However, empirical evidence produced after this assessment introduces a more nuanced understanding of poverty. A sample of homes that had been surveyed in 1996 was re-interviewed for CASEN on two separate occasions (2001 and 2006). The data show considerable mobility of household income over time that can reflect changes in employment, individual income, the composition of the household and other situations.Footnote 35
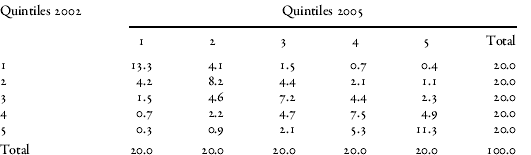
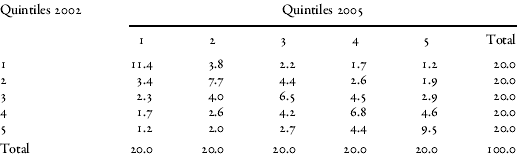
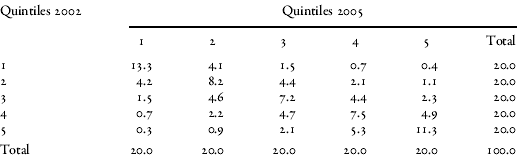
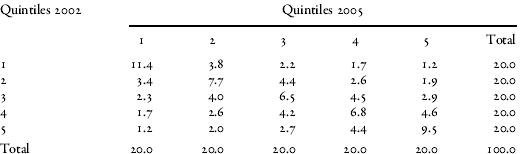
Similar evidence is provided by the CAS data. Tables 9 and 10 present data on transition of CAS score and household income for families with CAS assessments in 2002 and 2005. During those three years, considerable movement is observed in both directions between the quintiles of each variable. Specifically, one-third of those in the first quintile in 2002 rose to a higher quintile in 2005, while an equivalent number dropped to the first quintile.Footnote 36 Mobility is even greater for income, as over 40 per cent moved out of the first quintile and another group descended into it. The results tend to show, therefore, that households in the CS target population are exposed to a large degree of income instability, which causes them to experience movement into and out of poverty. These results raise doubts about the validity of the assessment that led to the programme's creation.
Household Transition by CAS Form Score Quintile, 2002 and 2005
Source: authors’ calculations using CAS database.
Household Transition by Income Quintile, 2002 and 2005
Source: authors’ calculations using CAS database.
The programme's effectiveness is compromised if it does not address the issue of income instability. Poverty reduction strategies should address not only the poor, but all of those at risk of falling into poverty. While strengthening a household's assets is functional for a reduction of vulnerability because it broadens the basis of economic resources, there is a need for instruments that can mitigate the impact of income shocks. Increasing employability, improving salaries and creating good unemployment insurance mechanisms helps mitigate shocks. Rather than limiting this universe to the 6 per cent of Chileans living in extreme poverty during the base year, then, the target population should cover the larger group of households that takes turns occupying the lower part of the socio-economic spectrum.
The second premise behind CS is that individuals living in extreme poverty were not accessing the benefits of economic growth or social programmes. However, the results of the control group show that families with the same socio-economic profile as programme participants experienced significant gains in income, employment and housing during the evaluation period. This suggests that CS participants would have obtained similar gains in the absence of the intervention, calling into question the validity of the marginalisation hypothesis. The fact that the poorest families can benefit from a more dynamic economy is good news and does not rule out the need for anti-poverty policies, but again, the scope and orientation of policies depend on the assessment of the problem.
The third premise is that social programmes can provide much-needed services and support. The results suggest that this premise does not necessarily hold true. Several qualitative studies have identified coordination problems among social programmes and rigidities in their ability to adapt contents and methodologies to participants’ needs. These findings are not surprising considering the weaknesses presented by health and education service providers, including private organisations.
Specifically, there is evidence that employment programmes associated with CS have had positive effects such as ‘facilitating the first step’ towards training and employment, ‘facilitating job search’ and providing beneficiaries with ‘options for getting out of poverty’.Footnote 37 However, there is a need to make training and employment programmes more relevant to local labour market needs and to provide more personalised tracks, coordination and access to job intermediation. The studies also show that CS faces challenges regarding the prevailing culture of public officials and employees who work in social programmes. One critical point of the housing programme's implementation was the move to install a logic of citizen rights among municipal employees. The employees, however, continue operating under a logic of ‘emergency solutions’ that was traditionally used to handle problems in this area. In this case, CS's approach would have conflicted with officials’ deeply rooted practices.Footnote 38
Conclusion
The CS programme was meant to allow families to develop skills in order to overcome conditions of extreme poverty. This mechanism stands in contrast to conditional income transfer programmes which emphasise the intergenerational component of poverty and provide resources to alleviate current poverty. Qualitative evaluations conducted in Chile demonstrate that the family support professionals played an important role in the development of the psycho-social capacities of families living in extreme poverty. However, the present evaluation demonstrates that this approach was insufficient to generate substantive gains in employment or income, at least during the period studied. This outcome is due in part to deficiencies in the public supply of training, micro-entrepreneurship and labour intermediation programmes, which are illustrative of the significant institutional challenges faced by a public policy that posits an intersectoral approach. There is a need for more direct instruments for providing income to families in extreme poverty in the short term through the design of capacity-building programmes that generate the necessary levels of economic autonomy.
Appendix
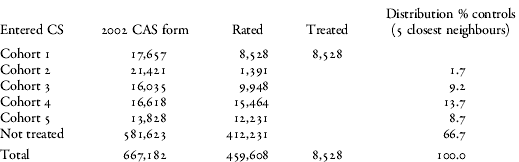
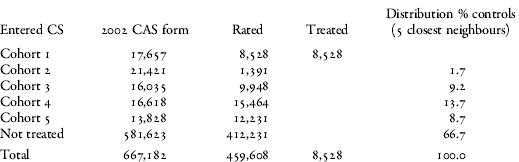
Table A1 presents statistics on the selection of treated and control subjects. The first column shows the number of households that were subject to a CAS form evaluation during 2002. The households are divided into subgroups by cohort (year) of entry into CS, along with a subgroup that did not participate in the programme: these households represent a subset because not all of them have a 2002 CAS measurement. The second column shows the total number of families with a 2002 CAS form who met the requirements for the initial and final measurements. Approximately 47 per cent of the treated subjects had an initial measurement in the six months prior to entry and a final measurement 12 months later. Only 5 per cent of control subjects that entered CS in 2003 met these conditions, although this figure increased to approximately 85 per cent of entrants in 2005 and 2006. This is because the final measurement must occur prior to the household's entry. This condition is more restrictive for those who enter earlier. Finally, two-thirds of the potential control subjects that did not enter the programme met the time requirement.
The third and fourth columns of Table A1 show the treated and control subjects that were considered. The control subjects are selected as the five closest neighbours of each treated subject and the data are robust to the number of neighbours selected as controls. One-third of control subjects correspond to families that entered later, while two-thirds come from the group that did not enter. Note that the likelihood of being chosen as a control subject is much higher for the group of future entrants (7.8 per cent versus 1.8 per cent). The inclusion of future treated subjects as control subjects from the first cohort reduces potential selection bias. Consider that the cohort of treated subjects is associated with a preferred set of controls selected according to the propensity score criterion. Some of these controls will see their economic situation worsen, which will cause the likelihood that they will enter CS to increase. Excluding them from the set of control subjects would cause participants to be compared to control subjects experiencing better socio-economic progress, leading to an underestimation of the programme's results.
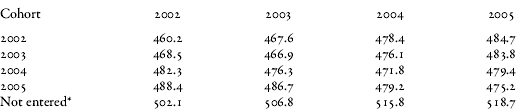
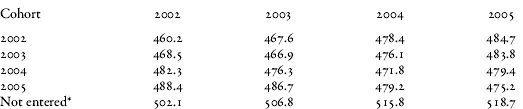
Table A2 presents the average CAS score of entering cohorts during different years, as well as that of households that do not participate and that have an initial CAS score of less than 540 (those with a greater likelihood of being selected as effective controls). The data show that the average CAS score of future treated subjects (2003–5) tends to decrease while the average CAS score of non-participants tends to increase. These data show the need to include cohorts that enter the programme later as controls to avoid selection bias. The one-year requirement makes sense because longer periods restrict the selection of future treated subjects as control subjects for the first cohort.
Number of Households in Evaluation of the Impact of CS
Source: authors’ calculations using CAS form database and CS records.
Average CAS Score by Cohort and Year of Assessment
* Comprises those who did not enter the programme and had a 2002 CAS score of less than 540 (99th percentile for 2002).
Source: authors’ calculations using CAS form database and CS records.