Introduction
Local goat breeds constitute a valuable source of income in rural areas, and they play a crucial role in economic, environment and social domains. FAO (2007) reported that traditional production systems required multipurpose animals, which, although less productive than high-output breeds, may contain valuable functional traits. Modern agriculture has developed specialized breeds, optimizing specific production traits. Modern animal breeders have achieved striking productivity increases in high external input production systems. Livestock currently contribute about 30 percent of agricultural gross domestic production in developing countries. Only 14 of the more than 30 domesticated mammalian and bird species provide 90 percent of human food supply from animals. The five main livestock species: cattle, sheep, goats, pigs and chickens provide the majority of food produced worldwide. Among these, a small number of international transboundary breeds account for an ever-increasing share of total production (FAO, 2007).
External appearance (morphology) is still commonly used by researchers and practitioners in identifying, characterization and selection of farm animals (Khan et al., Reference Khan, Muhammad, Ahmad, Nawaz and Zubair2006; Dossa, Wollny and Gauly, Reference Dossa, Wollny and Gauly2007; Alade, Raji and Atiku, Reference Alade, Raji and Atiku2008; Nafti et al., Reference Nafti, Khaldi, Rekik and Ben2009; Jimmy et al., Reference Jimmy, David, Donald and Dennis2010). Observations on the outside view traits are the easiest to do, but this morphology is heavily influenced by external environmental factors such as availability of food and climate (Anderson, Reference Anderson2001; Lanari et al., Reference Lanari, Taddeo, Domingo, Centeno and Gallo2003; Salako, Reference Salako2006; Jing et al., Reference Jing, Ren-jun, Guo-rong, Qing-ran and Hua-ming2010). Animal presence (existence) is due to their ability of adaptation with their environments or ecosystems. This property of being able to live in different areas and climates is explained by the production of more than one alternative form of morphology, physical status and or behaviour. This is considerate as a reaction or adaptation to environment changes (in the form of regulation of gene expression) and changes in shape (phenotype). (Karna, Koul and Bisht, Reference Karna, Koul and Bisht2001; Noor, Reference Noor2002; Riva et al., Reference Riva, Rizzi, Marelli and Gavalchini2004; Mansjoer, Kertanugraha and Sumantri, Reference Mansjoer, Kertanugraha and Sumantri2007).
Thus genetic and phenotypic characterization remains the most powerful tools to detect, quantify and try to improve or develop these domestic mammalian species. In this context, the aim of our paper is the multivariate characterization of morphological traits in local Tunisian oases goats, which is a contribution to the study of the diversity of goat populations in Tunisia.
Material and methods
Experimental animals and location of study
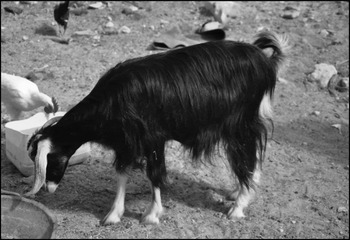
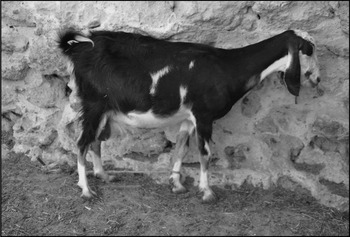
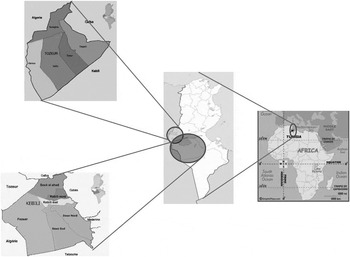
Sampling was carried out on 202 local (Arbi (Figure 1) and Serti (Figure 2) goat flocks, selected at random, located in 17 different locations (rural areas and towns) in the two main Tunisian oases regions (Jérid and Nefzawa areas) (Figure 3). The study was conducted in four subpopulations (Arbi Jérid, Arbi Nefzawa, Serti Jérid and Serti Nefzawa) in the two regions (in localities of; El Hamma Jérid, Tozeur, Ibn Chabat, Degueche, Legwifla, Nefta and Tamerza in the first region and Bechri, Souk Lahad, Fatnassa, Kébili, Douz, Rjim Maàtoug, Jemna, Bechni, Fawar and Gataâya & Tombar in the second region).
Arbi Nefzawa doe.

Serti Nefzawa doe.

Different areas of study.

A total of 1 247 caprine individuals were measured, 698 belonging to the first region (404 and 294, respectively for Arbi Jerid and Serti Jerid) and 549 from the second region (242 and 307 for Arbi Nefzawa and Serti Nefzawa, respectively). In total, 98 and 104 flocks were measured for the Jerid and Nefzawa areas, respectively. The sample was constituted by 85 male and 1 162 female adult goats (age > 2 years). Six body measurements or quantitative traits were determined, in addition to eight qualitative traits or variables. Data collected on each goat included: body length, wither height, heart girth, ear length, hair length and horn length for the quantitative variables, as well as the colour of hair, ear form and curling, presence and shape of horns, wattle presence, beard presence and the facial profile as qualitative traits.
The methodology used for measuring the morphological traits was those described by Lauvergne (Reference Lauvergne1986), Cogovica (1987), Lauvergne, Renieri and Audiot (Reference Lauvergne, Renieri and Audiot1987) and (FAO, 2012).
Statistical analysis
Before the collected physical measurements were subjected to analysis using multivariate methods, they were submitted to preliminary univariate analyses using the procedures UNIVARIATE and FREQ from SAS statistical package SAS 9.0 (SAS, 2002, SAS Institute Inc., Cary, NC, USA). Biometric data were first analysed using simple descriptive statistics (mean, mode, median, variance, standard deviation and coefficient of variation). Quantitative variables were then submitted to principal component analysis (PCA) (PROC PRINCOMP) to so reduce data dimensionality and enable facilitates analysis by grouping the data into smaller sets as first differentiation between subpopulations. The multiple correspondence analysis (MCA – PROC CORRESP) was used with qualitative variables to allow further distinction within subpopulations. Stepwise discriminant procedure was applied using PROC STEPDISC to determine which morphological traits have more discriminant power. The relative importance of the morphometric variables in discriminating the four subpopulations of goats was assessed using the level of significance (p < 0.05) and partial R 2 values ≥ 0.01. The CANDISC procedure was used to enable differentiation between subpopulations, calculating the Mahalanobis distances of the morphological traits, and derived canonical functions. Mahalanobis distances generated during the canonical discriminant analysis were used to construct a dendrogram using the unweighted pairs group method analysis (UPGMA). All measurements were analysed under the following linear model:
 $$\eqalign{&{{Y}_{{ijkl}}}{\rm = {\it \mu} + localit}{{\rm y}_{i}} + {\rm bree}{{\rm d}_{\,j}} + {\rm se}{{\rm x}_{k}} + {\rm ag}{{\rm e}_{l}} \cr &\quad\quad\;\, + {\rm breed}\,{{\rm (locality)}_{{ij}}} + {\rm sex}\,{{\rm (breed)}_{{\,jk}}} \cr &\quad\quad\;\,+ {\rm sex}\,{({\rm locality})_{{ik}}} + {\rm }{{\rm \varepsilon }_{{ijkl}}}}$$
where Y ijkl is a quantitative variable (body length, wither height, heart girth, ear length, horns length and hair length); μ the general mean of subpopulation or population; locality i the effect of the ith locality; breed j the effect of the jth subpopulation; sex k the effect of the kth sex; age l the effect of the lth age; breed (locality) ij the effect of subpopulation within locality; sex (breed) jk the effect of sex within subpopulation; sex (locality) ik the effect of sex within locality and ε ijkl the residual error of a null average and a constant variance.
The locality, breed, sex, age, breed (locality), sex (breed) and sex (locality) effects were contrasted by procedure GLM du SAS followed by the Student Newman–Keuls multiple comparison test, implemented in the General Linear Model procedure of SAS 9.0 (SAS, 2002, SAS Institute Inc., Cary, NC, USA).
Results and discussion
Results
Morphological diversity
In our study, a relative moderate variability was seen (Coefficient of variation (CV) ranging between 7 and 16 percent) for the traits: height at withers, heart girth and body length. The highest CVs were obtained for hair (61.63 percent) and horn (29.53 percent) length (Table 1). The smaller is the coefficient of variation better is the accuracy of the test and smaller is the errors of the results (Acourene et al., Reference Acourene, Belguedj, Tam and Taleb2001).
Descriptive statistics of morphological traits of the overall population in the two regions.

The body length did not show any significant differences between subpopulations Arbi and Serti while the horn and hair lengths displayed significant difference only between subpopulations of Arbi and Serti, i.e. neither significant difference between the Arbi Jerid and Arbi Nefzawa nor between Serti Jerid and Serti Nefzawa, but the differences are between Arbi and Serti groups (Table 2). It is expected that all animal populations have certain variability between groups or subpopulations. These differences could be attributed to the geographic location and specific feeding conditions of each location, combined with morphostructural differences.
Descriptive statistics of morphological traits (raw mean and standard deviation) of Arbi Jérid & Arbi Nefzawa and Serti Jérid & Serti Nefzawa goats.

Letters in rows indicate significant differences (p ≤ 0.05) upon applying the multiple comparison of means test (Student–Newman–Keuls test).
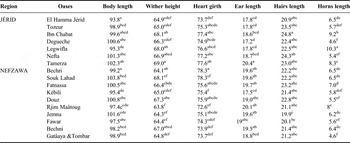
The four analysed subpopulations the wither height and the heart girth were the most significantly different parameters within and between the subpopulations (Table 3).
Descriptive statistics of morphological traits (mean) within the studied localities.

Letters in rows indicate significant differences (p ≤ 0.05) upon applying the multiple comparison of means test (Student–Newman–Keuls test).
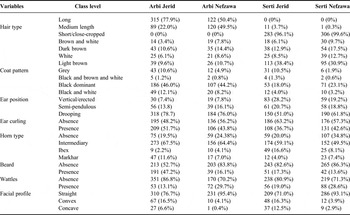
The native Tunisian oases goats where characterized by an important morphological diversity between localities (Tables 3 and 4). The Arbi goats are mainly black, black and white or brown (together representing 78.64 percent of the population), with “Intermediary” horn type (67.57 percent for the Arbi Jerid goat and 64.46 percent the Arbi Nefzawa), frequent absence of beard 70.8 percent (Arbi) and wattles 78.56 percent (Arbi). With long hair 64.19 percent (Arbi) and dropping ears (more than 75 percent). Some characteristics such as short hairs were found (96.16 and 99.67 percent) for the Serti Jerid and Serti Nefzawa subpopulations, respectively, to distinguish between Serti and Arbi subpopulations.
Total frequency (and percentage in brackets) for each level of the qualitative traits scored in Arbi Jérid & Arbi Nefzawa and Serti Jérid & Serti Nefzawa goats.

Serti goats, with short hairs, are mostly light brown to dark brown, 34.69 and 14.99 percent, respectively, and they are white for 10 percent of goats. These subpopulations have drooping ears in 56 percent of individuals where 23.5 percent of the animals present erected ears. Their ears are not curly (60 percent) in both subpopulations. The intermediary horn type is the most frequent (58.34 percent). Generally these goats do not have beards (84.48 percent) and without wattles (76.15 percent) and their facial profile are straight (82.12 percent).
Principal components analysis
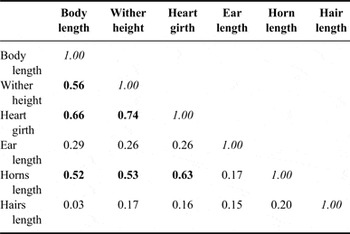
The PCA allowed us to spatially characterize the relationships among goat subpopulations from different localities according to a plan delimited by two main axes, PC1 and PC2, which accounted for 50.1 and 16.8 percent of the phenotypic variance, respectively. PC1 axis (Table 5) could be linked to the variables related to higher wither measurement, larger heart girth, longer body length of the animals, whereas the PC2 axis gave a major relevance to the hair lengths. Some traits were highly correlated whereas; others weakly correlated (Table 6). The variables with the highest correlations were chest circumference, height at withers, body length and horn length. The highest correlations were between chest girth and height at withers (0.740), thoracic perimeter and body length (0.664) and between thoracic perimeter and horn length (0.636). Hair length was the less correlated trait with all others: 0.03 with body length and with length of the ears and chest girth were 0.15 and 0.16, respectively (Table 6).
Eigenvectors.

Phenotypic correlations among body measurements of the overall population.

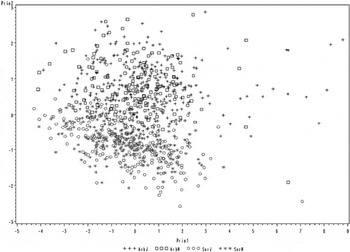
Nevertheless, as can be seen in the graphical representation of goats according to principal components 1 and 2 (Figure 4), goats from the subpopulation Arbi Jerid and Arbi Nefzawa occupied the upper part of the representation and the Serti Jerid and Serti Nefzawa were grouped in the lower part of the graphic except they overlap in the middle of the distribution. So, the results from the PCA did not allow for a clear-cut grouping of all of the different subpopulations but showed a certain degree of homogeneity between the groups Arbi and Serti, which would suggest that current flocks could be a mixture of animals from different origins with a heterogeneous contribution from each original subpopulation.
Graphical dispersion of scores of 4 subpopulations of goats in Tunisian oasis, related to principal components (PC) 1 (abscissa) and 2 (ordinate). ArbJ: Arbi Jerid goat, ArbN: Arbi Nefzawa, goat SerN: Serti Nefzawa goat, SerJ: Serti Jerid goat.

Multiple correspondence analyses of qualitative traits
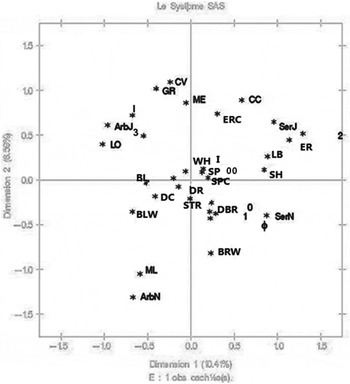
Figure 5 shows association among the categories of the different variables considered. The first and the second dimensions, respectively, explained 10.41 and 6.59 percent of the total variation.
Association among qualitative variables revealed by multiple correspondence analyses (MCA). ArbJ: Arbi Jérid goat. CV, CC and STR: convex, concave and straight facial profile. ArbN: Arbi Nefzawa goat. LO: long hairs, ML: medium-long hairs, SH: short hairs. SerJ: Serti Jérid goat. DR, DC: dropping and dropping curly ears. SerN: Serti Nefzawa goat. SP, SPC: semi-pendulous and semi-pendulous curly ears. 1: presence of bear. ER, ERC: erected and erected curly ears. I: presence of wattles. ϕ: absence of bear; 00: absence of wattles; 0: absence of horns. I: intermediary form of horns.2, 3: Ibex and markhar forms of horns. ME: mixture colour of goats. DB, BRW and LB: dark Brown, brown and white and light brown colours of goats. WH, BLW and BL: white, black and white and dominant black colours of goats.

Two first dimensions (Figure 5) show clear relationship between the traits, in which the subpopulations are divided onto two main groups. The first including animals belonging to subpopulations Arbi Jerid and Arbi Nefzawa having essentially long or medium length hairs that are gray, black or black and white. While the second unites Serti animals (Serti Jerid and Serti Nefzawa) with erected ears, ibex horns and light brown close-cropped hairs.
The straight facial profile, within the studied subpopulations showed very low quality of representation, being very close to the middle line. This low quality of representation is explained by the fact that this head profile is predominant in all subpopulations.
Discriminant analyses of the quantitative variables
Results of the stepwise discriminant analysis are presented in Table 7. The discriminant analysis based on significant F-values indicated hair length, ear length and wither height as the linear measures permitting discrimination between goat subpopulations. When the three most important morphometric traits for separating the two goat subpopulations were selected, Wilk's Lambda dropped to 0.484, with a significant difference between the goat subpopulations (F = 2.59; P < 0.001). The unstandardized stepwise discriminant function was used to classify individual goats (Table 7). The discriminating variables earlier extracted were the variables included in the discriminant (D) equation:
Summary of stepwise selection of traits.

***: P < 0.001; **: P < 0.05.
HL, hair length; EL, ear length; WH, wither height.
 $$\eqalign{{D}=& 0{\rm .38 \times hair}\, {\rm length+0}{\rm .043 \times ear}\, {\rm length} \cr & - 0{\rm .02 \times wither}\, {\rm height}}$$
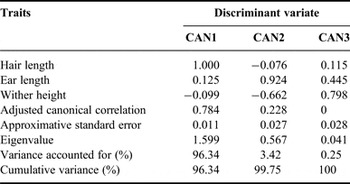
In the canonical discriminant analysis, all the three canonical variables generated (CAN1, CAN2 and CAN3) were significant (p < 0.0001). The CAN1 and CAN2 accounted for 99.75 percent of the total variation (Table 8). CAN1 was dominated essentially by the hair length and a smaller loading for ear length and CAN2 was dominated by large loadings from the ear length and relatively important loading from the wither height.
Standardized coefficients for the canonical discriminant function, the canonical correlation, the eigenvalue and the total variance percentage.

The canonical discriminant analysis allowed a good distinction between the studied individuals in the oasis regions (Jerid and Nefzawa). This analysis permitted a full view of the distribution of studied goat groups that distinguishes four independent zones (subpopulations) more or less distant from each other.
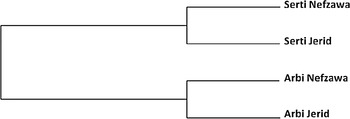
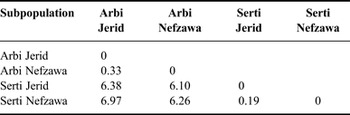
All pair wise distances were significant (p < 0.0001). The largest was between Arbi Jerid goats and Serti Nefzawa goats, whereas the closest distance was between Serti Jerid and Serti Nefzawa subpopulations. The dendrogram (Figure 6) shows two main populations. The first population includes the two Serti subpopulations which showed a Mahalanobis genetic distance of 0.19. The second population presents a distance of 0.33 between the two subpopulations Arbi Jerid and Arbi Nefzawa. Table 9 shows Mahalanobis genetic distances between different subpopulations.
UPGMA tree based on pair-wise Mahalanobis distances of four goat subpopulations.

Mahalanobis distances between the studied subpopulations.

Discussion
Morphological diversity
Type trait standards are needed to define specific breeds. Phenotypic description is based on measurements and qualitative traits and essential for defining these. In the four Tunisian oases goat subpopulations studied here, body measurements showed relative moderate degrees of variation for each trait except the body length.
Similar results were cited by Nafti et al. (Reference Nafti, Khaldi, Rekik and Ben2009) in studying same goat population in the Jerid area. Also these results were found with six Indonesian breeds (Benggala, Jawarandu, Kacang, Marica, Muara and Samosir) especially great similarities were noticed with Mura breed (Batubara et al., Reference Batubara, Noor, Farajallah, Tiesnamurtiand and Doloksaribu2011). Chacón et al. (Reference Chacón, Macedo, Velázquez, Rezende, Pineda and Concepta-McManus2011) and La O-Arias et al. (Reference La O-Arias, Guevara-Hernandez, Fonseca-Fuentes, Gomez-Castro, Pinto-Ruiz, Ley-De Coss, Medina-Jonapa, Coutino-Ruiz, Ruiz-Najera, Espinosa-Moreno and Rodriguez-Larramendi2012) reported smaller values of wither height, body length, ear length and coat length but higher measures of heart girth when they studied the morphological measurements and body indices for Cuban Creole goats and Traoré et al. (Reference Traoré, Tamboura, Kabore, Royo, Fernandez, Alvarez, Sangare, Bouchel, Poivey, Francois, Sawadogo and Goyache2008) within Burkina Faso goats. Also Dossa, Wollny and Gauly (Reference Dossa, Wollny and Gauly2007) found smaller measurements while studying goats from four vegetation zones ranging from south towards north Benin. The four populations studied here were characterized as distinct and may be referred to as ecotypes. Herrera et al. (Reference Herrera, Rodero, Gutierrez, Pena and Rodero1996), worked on Mediterranean goats with a total of 634 adult goats (>3 years old) from five Andalusian caprine breeds (Malaga, Granada, Florida, Andalusian White and Andalusian Black), had found greater withers height (ranged from 68.22 to 77.91 cm) and of chest girth (from 85.59 to 96.24 cm) but smaller values of body length (from 71.64 to 81.25 cm).
The coefficient of variation values of height at withers, heart girth and body length was similar to those found by Dossa, Wollny and Gauly (Reference Dossa, Wollny and Gauly2007) and Pires et al. (Reference Pires, Machado, Araújo, Olson, Da Silva, Torres and Costa2012). Traoré et al. (Reference Traoré, Tamboura, Kabore, Royo, Fernandez, Alvarez, Sangare, Bouchel, Poivey, Francois, Sawadogo and Goyache2008) cited higher values for the horns length, ear length and all other body measurements in Burkina Faso goats.
Principal components analysis
The graphical representation of the PCA allowed to first distinction goat subpopulations into two groups in the Jerid and Nefzawa areas. The exploitation of the multivariate techniques especially the principal components have been found useful for a quantitative measure of animal conformation which is desirable as it will enable reliable genetic parameters for these traits to be estimated and permits its inclusion in breeding programmes (Ibe, Reference Ibe1989; Mavule et al., Reference Mavule, Muchenjeb, Bezuidenhout and Kunene2012; Silva et al., Reference Silva, Lopesa, Vaz, Paulinic, Montesinosa, Fioravantia, Mcmanus and Sereno2013; Yakubu, Reference Yakubu2013). The graphical representation of PCA observations permits distinguishing among genetic groupings/breeds of goats, from the most similar to the most dissimilar. It also facilitates preliminary visualization of the uniformity or lack of uniformity among individuals within each subpopulation, similar results were reported by Pires et al. (Reference Pires, Machado, Araújo, Olson, Da Silva, Torres and Costa2012). Similar correlation values between same variables in the Jerid goats were mentioned by Nafti et al. (2009). Okpeku et al. (Reference Okpeku, Yakubu, Peters, Ozoje, Ikeobi, Adebambo and Imumorin2011) reported greater values of correlations between the measurements which allowed him to conclude that two factors were extracted for each sex of the two breeds, although with varying degrees of factor loadings. Besides, La O-Arias et al. (Reference La O-Arias, Guevara-Hernandez, Fonseca-Fuentes, Gomez-Castro, Pinto-Ruiz, Ley-De Coss, Medina-Jonapa, Coutino-Ruiz, Ruiz-Najera, Espinosa-Moreno and Rodriguez-Larramendi2012) reported that body dimensions of Creole goats were grouped also into two components, the first component 17 of 22 variables, all of them negatively correlated with this component and explained 62.5 percent and the second component explained 12.69 percent of the total variance and was positively correlated.
Correspondence analysis of qualitative traits
In the correspondences analysis the most important factors that distinguish the four studied subpopulations were the hairs length and type in one hand and the genetic group in the other hand. Similar result was found by Lanari et al. (Reference Lanari, Taddeo, Domingo, Centeno and Gallo2003) when they reported that Neuquen Criollo breed could be characterized in two ecotypes: Short and long hair goats, a mixed type area and a crossbred area fulfil the type's distribution. Carneiro et al. (Reference Carneiro, Louvandini, Paiva, Macedo, Mernies and McManus2010) cited that, in sheep, the most important factor that differentiate the animals measured and adult weight the most influenced by environment. While Dossa, Wollny and Gauly (Reference Dossa, Wollny and Gauly2007) revealed clear differences between the vegetation zones, goats from the northernmost vegetation zone being more associated with presence of wattles, beard, drooping ear and absence of supernumerary teats whereas those from southernmost zones had erected ears and were mainly characterized by very high incidence of supernumerary teats. Amao et al. (Reference Amao, Osinowo, Lakpini, Dipeolu, Abiola and Onwuka2003) reported slight different results.
Discriminant analyses
The best discriminant function model used in this study included three morphological measurements (hair length, ear length and wither height). This demonstrates that taking measurements on this trait could be sufficient in differentiating between these four goat subpopulations than acquiring numerous other measurements on morphometric traits. Some of the discriminating variables obtained in the present study are similar to earlier findings (Herrera et al., Reference Herrera, Rodero, Gutierrez, Pena and Rodero1996; Dossa, Wollny and Gauly, Reference Dossa, Wollny and Gauly2007; Yakubu et al., Reference Yakubu, Salako and Imumorin2011; Dekhili, Bounechada and Mannalah, Reference Dekhili, Bounechada and Mannalah2013; Yadav et al., Reference Yadav, Jain, Kulkarni, Govindaiah, Aswathnarayan and Sadana2013) in the morphostructural differentiation of sheep and goat breeds/populations. Some of the present discriminant variables are similar to those found by Dekhili, Bounechada and Mannalah (Reference Dekhili, Bounechada and Mannalah2013) working on Algerian goat population in Sétif area. Also Mahalanobis distances between Algerian populations were between 2.8 and 8.6 that are very close to our results.
The Mahalanobis distances differed between subpopulations. The highest distance between Arbi Jerid and Serti Nefzawa reflects differences in body size. Generally, such phenotypic divergence between breeds/populations might be partly associated with the differences in management practices, agro-climatic conditions and biophysical resources (Yadav et al., Reference Yadav, Jain, Kulkarni, Govindaiah, Aswathnarayan and Sadana2013).
Conclusion
Tunisian oases goat subpopulations are a medium-sized animal. Its morphology corresponds to the milk-type animal although it is used for both milk and meat productions. The study establishes the structure and the degree of variability between the four subpopulations. The application of univariate and multivariate statistical methods enabled us to discriminate between the goat subpopulation using morphometric traits. Wither height, heart girth, ear length, hair length and wither height were all determinant in the discrimination between subpopulations in the oases areas of Tunisia. Additionally, the use of cluster analysis is successful in differentiating the populations into similar groups on the basis of morphological traits. The low Mahalanobis distance between Arbi Jerid and Arbi Nefzawa and between Serti Jerid and Serti Nefzawa at the morphological level could be attributed to the genetic exchange that has taken place between these goat subpopulations. This information will be the basis of further characterization, conservation and selection strategies in Tunisian goats.