1 Introduction
Porous media flow plays an important role in many environmental and industrial applications. Depending on the application, length scales can vary from  $10^{-6}~\text{m}$ to
 $10^{-1}~\text{m}$ (Miller et al. Reference Miller, Christakos, Imhoff, McBride and Pedit1998) and velocity scales can be as small as
 $10^{-1}~\text{m}~\text{day}^{-1}$ (Kutsovsky, Scriven & Davis Reference Kutsovsky, Scriven and Davis1996). Moreover, for a single porous geometry, the pore sizes and velocities can range over several orders of magnitude. Numerical methods that resolve this range of scales offer the ability to (i) characterize dispersion (Saffman Reference Saffman1959), (ii) quantify mixing (Borgne et al. Reference Borgne, Dentz, Davy, Bolster, Carrera, de Dreuzy and Bour2011; Dentz et al. Reference Dentz, Borgne, Englert and Bijeljic2011), and (iii) develop meaningful constitutive relationships that link the microscopic and macroscopic realms (Miller et al. Reference Miller, Christakos, Imhoff, McBride and Pedit1998). Examples of coarse-grained models for porous media flow include tortuosities (Koponen, Kataja & Timonen Reference Koponen, Kataja and Timonen1996; Matyka, Khalili & Koza Reference Matyka, Khalili and Koza2008; Duda, Koza & Matyka Reference Duda, Koza and Matyka2011), geometry connectivity (Knudby & Carrera Reference Knudby and Carrera2005), anomalous dispersion (Dentz et al. Reference Dentz, Cortis, Scher and Berkowitz2004) and permeability-porosity relationships (Carman Reference Carman1937; Dardis & McCloskey Reference Dardis and McCloskey1998), where the porosity is the fraction of the geometry that is fluidized.
Flow in porous media is further complicated when boundaries evolve dynamically in response to the fluid flow. This coupling between geometry and flow occurs, for example, in applications involving melting (Beckermann & Viskanta Reference Beckermann and Viskanta1988; Rycroft & Bazant Reference Rycroft and Bazant2016; Jambon-Puillet, Shahidzadeh & Bonn Reference Jambon-Puillet, Shahidzadeh and Bonn2018; Favier, Purseed & Duchemin Reference Favier, Purseed and Duchemin2019; Morrow et al. Reference Morrow, King, Moroney and McCue2019), dissolution (Kang et al. Reference Kang, Zhang, Chen and He2002; Huang, Moore & Ristroph Reference Huang, Moore and Ristroph2015; Moore Reference Moore2017; Wykes, Huang & Ristroph Reference Wykes, Huang, Ristroph and Hajjar2018), deposition (Johnson & Elimelech Reference Johnson and Elimelech1995; Hewett & Sellier Reference Hewett and Sellier2018), biofilm growth (Tang, Valocchi & Werth Reference Tang, Valocchi and Werth2015) and crack formation (Cho et al. Reference Cho, Lu, Howard, Adams and Datta2019). We focus on erosion, a fluid-mechanical process that is prevalent in many geophysical, hydrological and industrial applications (Berhanu et al. Reference Berhanu, Petroff, Devauchelle, Kudrolli and Rothman2012; Ristroph et al. Reference Ristroph, Moore, Childress, Shelley and Zhang2012; Hewett & Sellier Reference Hewett and Sellier2017; Lachaussée et al. Reference Lachaussée, Bertho, Morize, Sauret and Gondret2018; López, Stickland & Dempster Reference López, Stickland and Dempster2018; Allen Reference Allen2019; Amin et al. Reference Amin, Huang, Hu, Zhang and Ristroph2019).
When a porous medium erodes, certain qualitative characteristics are unveiled that affect transport through the geometry. For example, an eroded geometry may contain channels of high porosity, which, though few in number and modest in volume fraction, transmit a large portion of the flux (Quaife & Moore Reference Quaife and Moore2018). This arrangement results in velocities that vary over several orders of magnitude (Alley et al. Reference Alley, Healy, LaBaugh and Reilly2002). Moreover, channelization creates heterogeneous and anisotropic medium properties, which affect the transport of tracers such as contaminants (Konikow & Bredehoeft Reference Konikow and Bredehoeft1978; Dagan Reference Dagan1987; Cvetkovic, Cheng & Wen Reference Cvetkovic, Cheng and Wen1996) and heat (Nilsen & Storesletten Reference Nilsen and Storesletten1990; Rees & Storesletten Reference Rees and Storesletten1995).
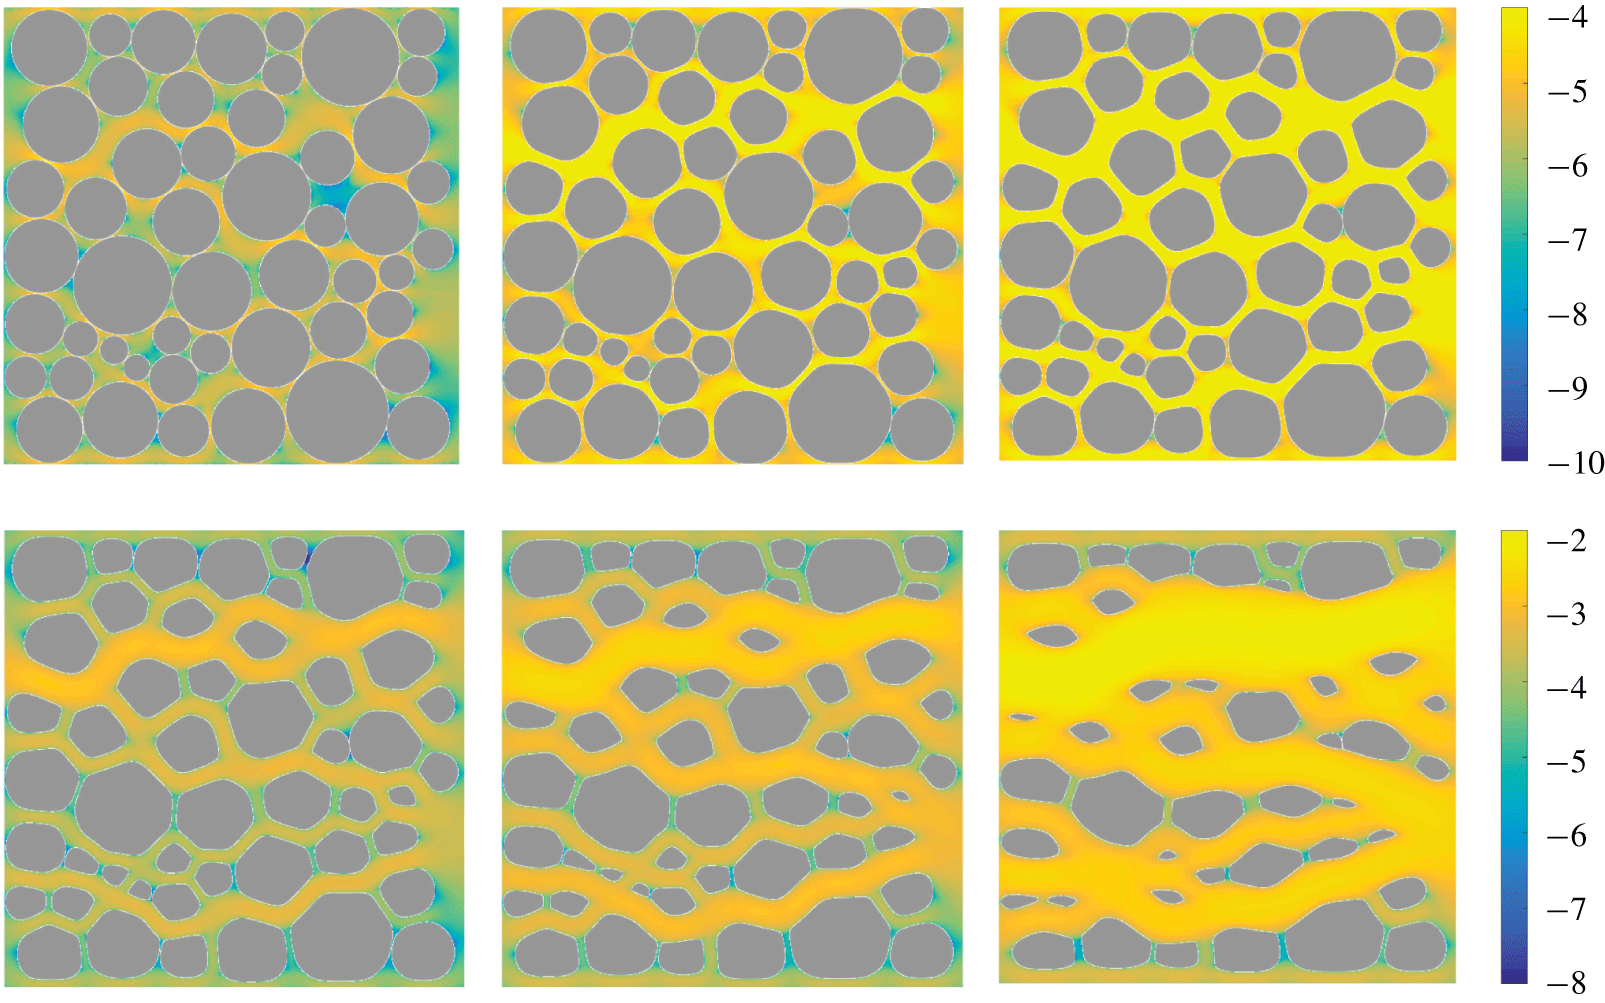
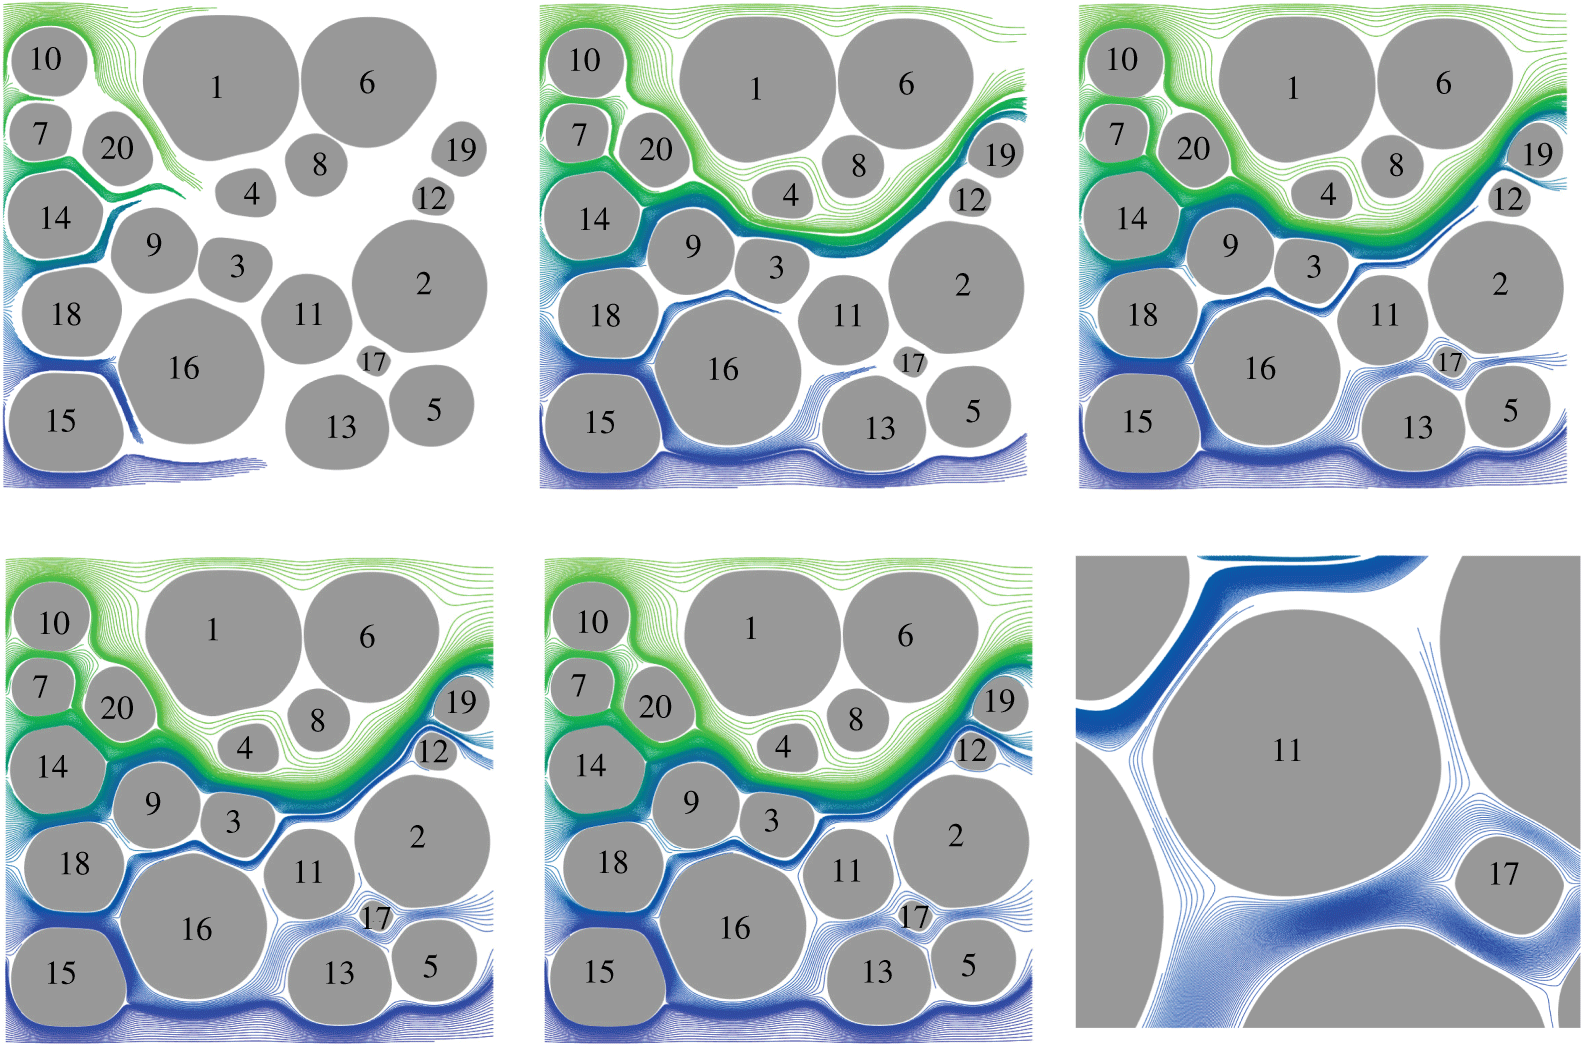
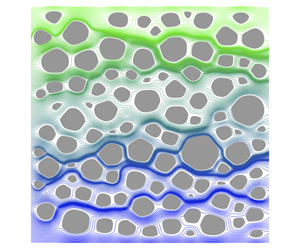
Fifty bodies eroding in a Hagen–Poiseuille flow. The six snapshots are equispaced in time, and the colour is the magnitude of the fluid velocity in a logarithmic scale. The flow velocity varies over several orders of magnitude, the grains form irregular shapes with large aspect ratios, and the geometry becomes channelized and anisotropic.

This study consists of two main undertakings: first, high-fidelity simulations of eroding porous media and, second, characterization of tracer transport through the resulting eroded geometries. Our modelling efforts build on previous work (Ristroph et al. Reference Ristroph, Moore, Childress, Shelley and Zhang2012; Moore et al. Reference Moore, Ristroph, Childress, Zhang and Shelley2013; Moore Reference Moore2017), in particular recent numerical methods developed to simulate erosion in the Stokes-flow regime (Quaife & Moore Reference Quaife and Moore2018). We, however, make key improvements to the numerical methods to enable simulations of more realistic, dense suspensions of eroding grains (figures 1 and 2). Then, to characterize transport through these configurations, we examine coarse-grained variables through statistical analysis of tracer trajectories.
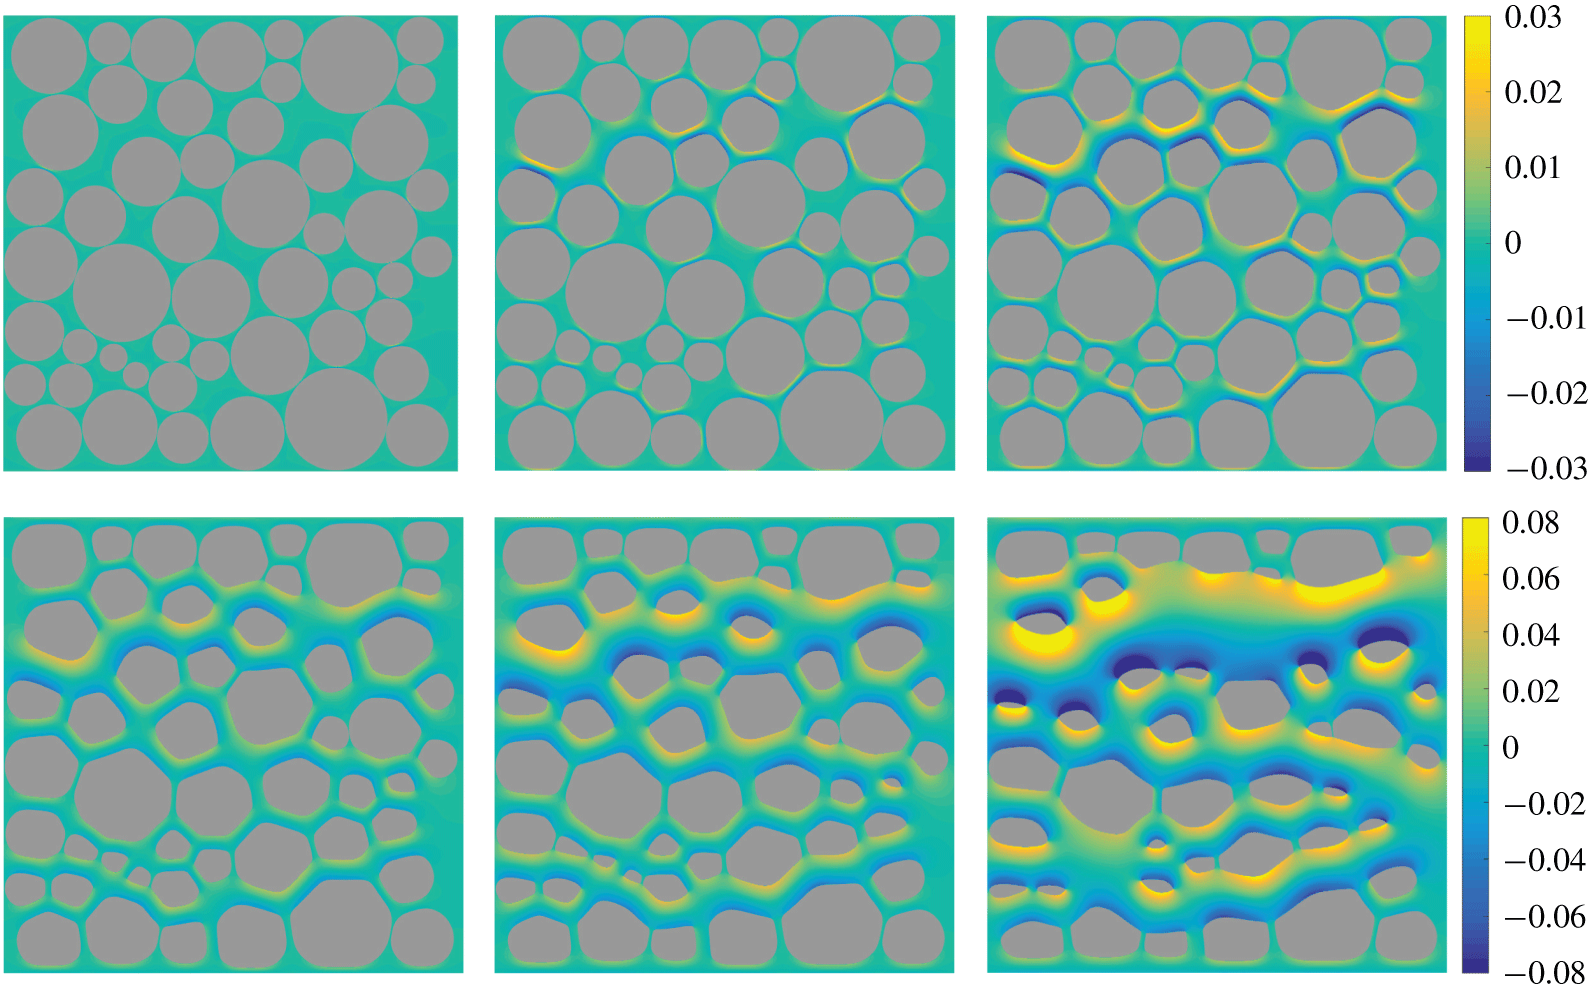
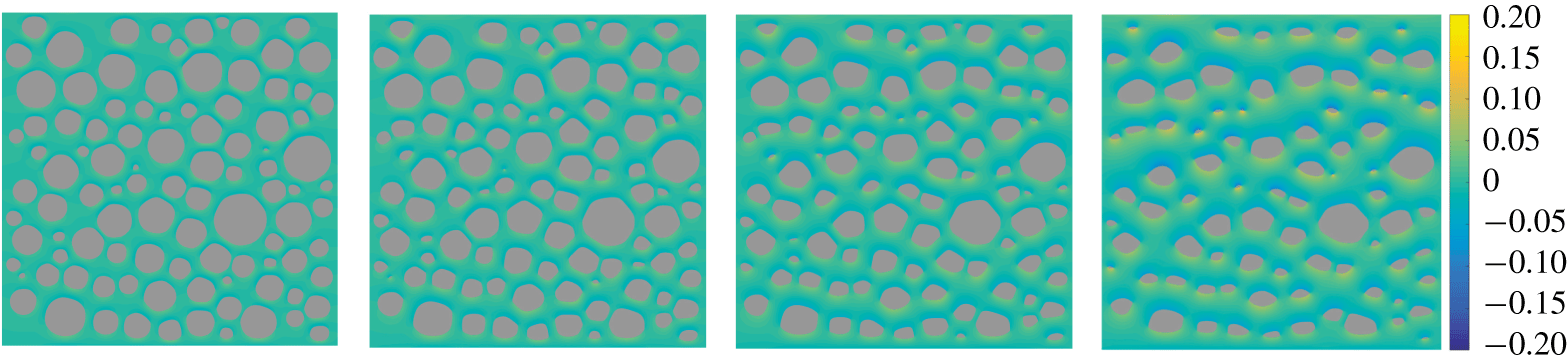
Owing to the scales present in groundwater flow (Bear Reference Bear1972), we model the hydrodynamics with the two-dimensional incompressible Stokes equations. Meanwhile, individual grains erode at a rate proportional to the hydrodynamic shear stress (Parker & Izumi Reference Parker and Izumi2000; Wan & Fell Reference Wan and Fell2004; Ristroph et al. Reference Ristroph, Moore, Childress, Shelley and Zhang2012; Moore et al. Reference Moore, Ristroph, Childress, Zhang and Shelley2013). Since the fluid equations are linear and homogeneous, they are converted to a boundary integral equation (BIE), and this allows us to naturally resolve the non-negligible interactions between bodies. We also compute the vorticity in the fluid bulk since, on solid boundaries, vorticity reduces to shear and thus provides a convenient way to simultaneously visualize local erosion rates and changes in the surrounding flow (figure 2).
The same six snapshots as figure 1. The colour is the vorticity of the fluid. Since the rate of erosion is equivalent to the magnitude of the vorticity, erosion is fastest in the yellow and blue regions and slowest in the green regions.

To compute stable simulations of erosion, we use high-order methods in both space and time. The time integration is unchanged from previous work (Quaife & Moore Reference Quaife and Moore2018). We apply a mild regularization and a smoothing term to eliminate numerical instabilities that can be triggered by changes in sign of the shear stress, and we use a stable second-order Runge–Kutta method applied to the  $\unicode[STIX]{x1D703}$–
 $L$ coordinates (Hou, Lowengrub & Shelley Reference Hou, Lowengrub and Shelley1994) of the eroding grains. In previous work (Quaife & Moore Reference Quaife and Moore2018), the BIE is discretized with the trapezoid rule, and this is acceptable if the grains are sufficiently separated (Trefethen & Weideman Reference Trefethen and Weideman2014). However, when grains are close, the result is a nearly singular integrand and the error of the trapezoid rule is no longer acceptable. One of the earliest quadrature methods for nearly singular integrands was developed by Baker & Shelley (Reference Baker and Shelley1986) and, in recent years, many other schemes have followed (Beale & Lai Reference Beale and Lai2001; Helsing & Ojala Reference Helsing and Ojala2008; Klöckner et al. Reference Klöckner, Barnett, Greengard and O’Neil2013; Beale, Ying & Wilson Reference Beale, Ying and Wilson2016; Carvalho, Khatri & Kim Reference Carvalho, Khatri and Kim2018; af Klinteberg & Tornberg Reference af Klinteberg and Tornberg2018). We use a Barycentric quadrature method (Barnett Reference Barnett2014; Barnett, Wu & Veerapaneni Reference Barnett, Wu and Veerapaneni2015) since it is a non-intrusive modification of the trapezoid rule, and the error is guaranteed to be uniformly bounded. We use this quadrature method to compute the velocity gradient, which is needed to evaluate the shear stress and the fluid vorticity.
Since high-order methods have never been used to study transport in eroding porous media, we consider, as a first step, two-dimensional and immobile grains. These assumptions allow us to simulate large densely packed suspensions (up to  $100$ in this manuscript), and to clearly interpret the results. More realistic three-dimensional and mobile configurations would require overcoming a few challenges. First, a three-dimensional extension of the
 $\unicode[STIX]{x1D703}$–
 $L$ formulation exists (Ambrose, Siegel & Tlupova Reference Ambrose, Siegel and Tlupova2013), but the Barycentric quadrature method used here relies on a complex variable formulation of the BIE, making it inherently two-dimensional. Therefore, a different quadrature method would be required, such as methods that use asymptotic expansions near the singularity (Lee & Leal Reference Lee and Leal1982). Additional challenges include spectral representations of three-dimensional geometries and efficiently solving discretizations of the BIE. While high-order methods for three-dimensional BIEs have been developed, their computational cost limits the number of bodies that can be practically simulated. Lastly, mechanisms such as sedimentation play a role in realistic media and affect the pore structure. Simulating mobile grains introduces the additional challenge of resolving contact, which we plan to address in future work.
To characterize transport through the resulting configurations, particle trajectories must be computed. Depending on the application, microscale transport can be modelled as pure advection (Cvetkovic et al. Reference Cvetkovic, Cheng and Wen1996; de Anna et al. Reference de Anna, Quaife, Biros and Juanes2018; Puyguiraud, Gouze & Dentz Reference Puyguiraud, Gouze and Dentz2019), advection-diffusion (Dagan Reference Dagan1987; Cushman, Hu & Deng Reference Cushman, Hu and Deng1995; Dentz, Icardi & Hidalgo Reference Dentz, Icardi and Hidalgo2018) or with a random walk (Saffman Reference Saffman1959; Berkowitz, Scher & Silliman Reference Berkowitz, Scher and Silliman2000; Bijeljic & Blunt Reference Bijeljic and Blunt2006). In this work we assume trajectories to be governed by pure advection (i.e. no diffusion), so the particle trajectories are identical to the streamlines. We compute trajectories  $\boldsymbol{s}(t)$ that are initialized at
 $\boldsymbol{s}_{0}$ by solving the advection equation
 $$\begin{eqnarray}\frac{\text{d}\boldsymbol{s}}{\text{d}t}=\boldsymbol{u}(\boldsymbol{s},t),\quad \boldsymbol{s}(0)=\boldsymbol{s}_{0},\end{eqnarray}$$
where  $\boldsymbol{u}$ is the fluid velocity. Since there is no stiff diffusive term, we solve (1.1) with a fourth-order explicit Runge–Kutta time-stepping method. The Barycentric quadrature rule is used to accurately compute trajectories that are close to an eroding grain.
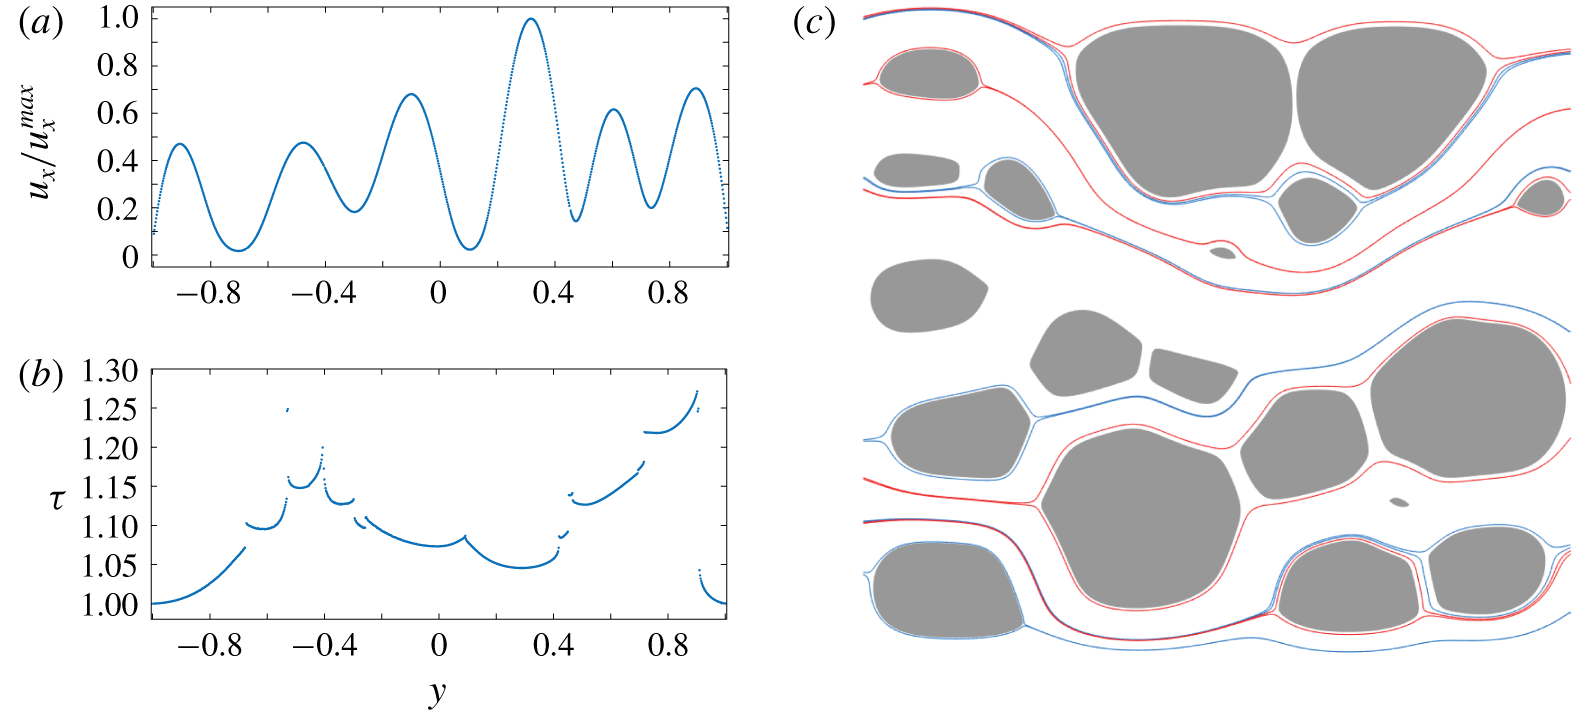
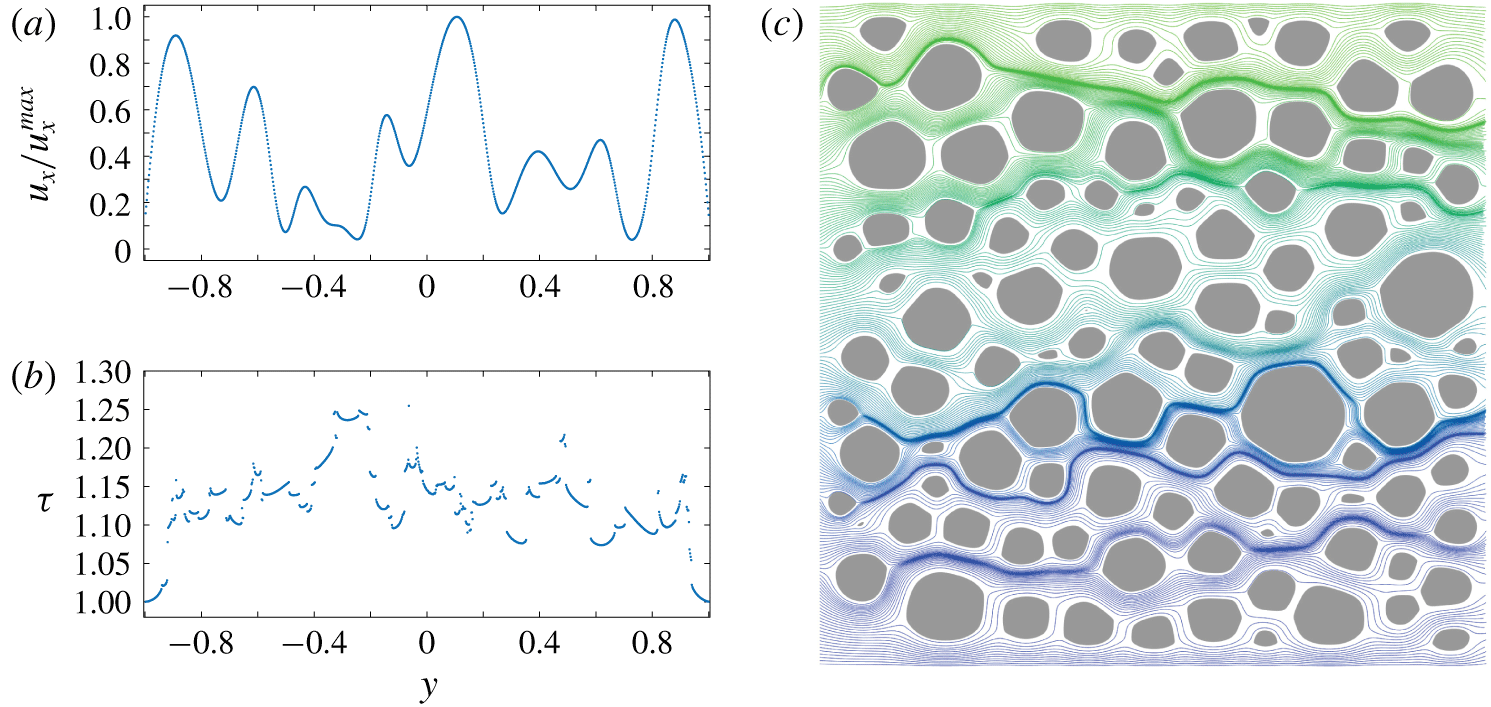
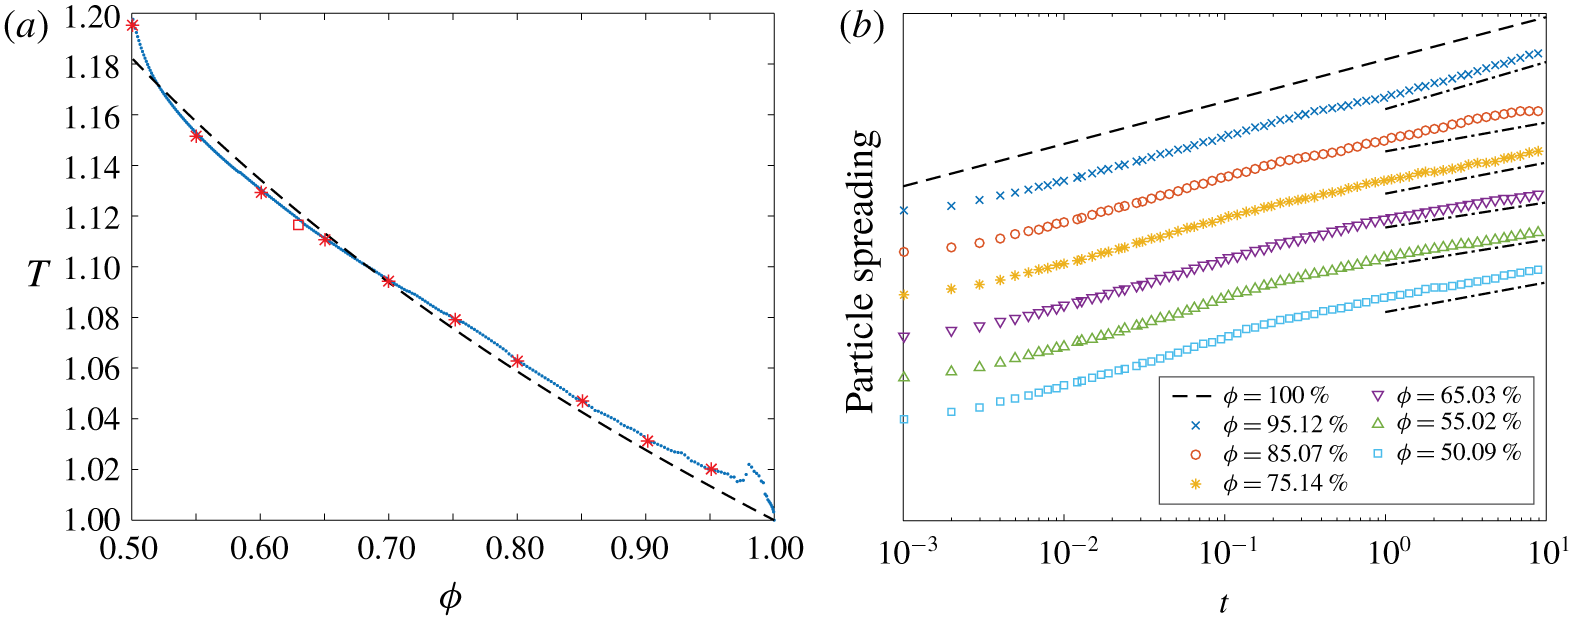
Once the streamlines are computed, we characterize transport by analyzing three different metrics: the tortuosity, the anomalous dispersion and the pore size distribution. The local tortuosity of a streamline that connects the inlet to the outlet is defined as the streamline’s length normalized by the linear inlet-to-outlet distance. In porous media, the local tortuosity can be greater than 1.5 (Koponen et al. Reference Koponen, Kataja and Timonen1996; Matyka et al. Reference Matyka, Khalili and Koza2008) or even 2 (Duda et al. Reference Duda, Koza and Matyka2011), depending on several factors such as the porosity. The tortuosity of a geometry is defined by averaging the local tortuosity over all streamlines initialized at the inlet, and the geometry’s tortuosity characterizes average particle motions (Hakoun, Comolli & Dentz Reference Hakoun, Comolli and Dentz2019). To characterize spreading, the fluid dispersion is defined as the variance of the streamline lengths. In porous media, this spreading is often super-dispersive (Cushman et al. Reference Cushman, Hu and Deng1995; de Anna et al. Reference de Anna, Borgne, Dentz, Tartakovsky, Bolster and Davy2013; Kang et al. Reference Kang, de Anna, Nunes, Bijelic, Blunt and Juanes2014). Since anomalous dispersion results from streamlines spending time in both the high and low velocity regimes (Berkowitz & Scher Reference Berkowitz and Scher2001), it is crucial to accurately resolve streamlines near grain boundaries, as achieved in this work. Finally, we construct the pore-size distribution throughout the erosion process. These distributions are required to quantify velocity distributions (Alim et al. Reference Alim, Parsa, Weitz and Brenner2017; de Anna et al. Reference de Anna, Quaife, Biros and Juanes2018), channelization (Siena et al. Reference Siena, Ilievand, Prill, Riva and Guadagnini2019), connectivity (Western, Blöschl & Grayson Reference Western, Blöschl and Grayson2001; Knudby & Carrera Reference Knudby and Carrera2005) and to develop network models (Bryant, King & Mellor Reference Bryant, King and Mellor1993a; Bryant, Mellor & Cade Reference Bryant, Mellor and Cade1993b; Bijeljic & Blunt Reference Bijeljic and Blunt2006).
This paper is organized as follows. In § 2 we summarize the erosion model that is described in more detail in previous work (Quaife & Moore Reference Quaife and Moore2018). In § 3 we recast all the governing equations as layer potentials defined in both  $\mathbb{R}^{2}$ and in
 $\mathbb{C}$. In § 4 we describe measures for characterizing the geometry and transport. In § 5 we describe the numerical methods, with special attention paid to the quadrature method for computing the shear stress and the vorticity. In § 6 we present numerical examples for a variety of dense packings of bodies. Finally, concluding remarks are made in § 7.
2 Governing equations
We start by defining the main variables used to model erosion. We only briefly summarize the model, a more detailed description can be found in previous work (Quaife & Moore Reference Quaife and Moore2018). We consider flows inside a confined geometry  $\unicode[STIX]{x1D6FA}$ that contains
 $M$ eroding bodies with boundaries
 $\unicode[STIX]{x1D6FE}_{\ell }$,
 $\ell =1,\ldots ,M$. The boundary of the fluid domain is
 $\unicode[STIX]{x2202}\unicode[STIX]{x1D6FA}=\unicode[STIX]{x1D6E4}\cup \unicode[STIX]{x1D6FE}_{1}\cup \cdots \cup \unicode[STIX]{x1D6FE}_{M}$, where
 $\unicode[STIX]{x1D6E4}$ is the outer boundary, taken to be a slightly smoothed version of the boundary of
 $[-3,3]\times [-1,1]$. All eroding bodies are placed in
 $[-1,1]\times [-1,1]$ to create a buffer region that allows the flow profile imposed at the inlet to transition to the more complex flow intervening between the bodies. Neglecting inertial forces, the governing equations are
 $$\begin{eqnarray}\left.\begin{array}{@{}cl@{}}\unicode[STIX]{x1D707}\unicode[STIX]{x0394}\boldsymbol{u}=\unicode[STIX]{x1D735}p,\quad \boldsymbol{x}\in \unicode[STIX]{x1D6FA}, & \text{conservation of momentum},\\ \unicode[STIX]{x1D735}\boldsymbol{\cdot }\boldsymbol{u}=0,\quad \boldsymbol{x}\in \unicode[STIX]{x1D6FA}, & \text{conservation of mass},\\ \boldsymbol{u}=\mathbf{0},\quad \boldsymbol{x}\in \unicode[STIX]{x1D6FE}, & \text{no slip on the eroding bodies},\\ \boldsymbol{u}=\boldsymbol{U},\quad \boldsymbol{x}\in \unicode[STIX]{x1D6E4}, & \text{outer wall velocity},\\ V_{\boldsymbol{n}}=C_{E}|\unicode[STIX]{x1D70F}|,\quad \boldsymbol{x}\in \unicode[STIX]{x1D6FE}, & \text{erosion model}.\end{array}\right\}\end{eqnarray}$$
Here  $\boldsymbol{u}$ is the fluid velocity,
 $p$ is the pressure,
 $\boldsymbol{U}$ is a prescribed Hagen–Poiseuille velocity field and
 $V_{\boldsymbol{n}}$ is the normal velocity of
 $\unicode[STIX]{x1D6FE}$. Since the rate of erosion is much slower than the background flow, a quasi-steady approximation justifies the no-slip boundary condition. Parameters include the fluid viscosity
 $\unicode[STIX]{x1D707}$ and the material-dependent erosion constant
 $C_{E}$. By non-dimensionalizing (2.1) (Quaife & Moore Reference Quaife and Moore2018), we set both these parameters to one. The shear stress on
 $\unicode[STIX]{x1D6FE}$ is
 $$\begin{eqnarray}\unicode[STIX]{x1D70F}=-(\unicode[STIX]{x1D735}\boldsymbol{u}+\unicode[STIX]{x1D735}\boldsymbol{u}^{\text{T}})\boldsymbol{n}\boldsymbol{\cdot }\boldsymbol{s},\end{eqnarray}$$
where  $\boldsymbol{n}$ is the normal vector pointing into the body and
 $\boldsymbol{s}$ is the unit tangent vector pointing in the counterclockwise direction. We simulate erosion by alternating between solving the fluid equations and advancing the eroding grains. The strength of
 $\boldsymbol{U}$ is adjusted at each time step to achieve a constant pressure drop across the channel, motivated by the geological situation of a porous medium connecting two regions of fixed hydraulic heads.
3 Boundary integral equation formulation
To accurately solve the governing equations (2.1) in complex two-dimensional geometries, we reformulate the equations as a BIE. This has the advantage that only the one-dimensional boundary of the domain must be discretized and, with appropriate quadrature formulae and fast summation methods, the result is a high-fidelity numerical simulation with near-optimal computational complexity.
3.1 Double-layer potential formulation in  $\mathbb{R}^{2}$

Applying the same approach as our previous work (Quaife & Moore Reference Quaife and Moore2018), we start with the double-layer potential
 $$\begin{eqnarray}\boldsymbol{{\mathcal{D}}}[\boldsymbol{\unicode[STIX]{x1D702}}](\boldsymbol{x})=\int _{\unicode[STIX]{x2202}\unicode[STIX]{x1D6FA}}D(\boldsymbol{x},\boldsymbol{y})\boldsymbol{\unicode[STIX]{x1D702}}(\boldsymbol{y})\,\text{d}s_{\boldsymbol{y}}=\frac{1}{\unicode[STIX]{x03C0}}\int _{\unicode[STIX]{x2202}\unicode[STIX]{x1D6FA}}\frac{\boldsymbol{r}\boldsymbol{\cdot }\boldsymbol{n}}{\unicode[STIX]{x1D70C}^{2}}\frac{\boldsymbol{r}\otimes \boldsymbol{r}}{\unicode[STIX]{x1D70C}^{2}}\boldsymbol{\unicode[STIX]{x1D702}}(\boldsymbol{y})\,\text{d}s_{\boldsymbol{y}},\quad \boldsymbol{x}\in \unicode[STIX]{x1D6FA},\end{eqnarray}$$
where  $D$ is the kernel of the integral operator,
 $\boldsymbol{r}=\boldsymbol{x}-\boldsymbol{y}$,
 $\unicode[STIX]{x1D70C}=\Vert \boldsymbol{r}\Vert$,
 $\boldsymbol{n}$ is the unit outward normal at
 $\boldsymbol{y}$ and
 $\boldsymbol{\unicode[STIX]{x1D702}}$ is an unknown density function. We complete the integral equation formulation by adding the
 $M$ Stokeslets,
 $S[\unicode[STIX]{x1D740}_{\ell },\boldsymbol{c}_{\ell }](\boldsymbol{x})$, and
 $M$ rotlets,
 $R[\unicode[STIX]{x1D709}_{\ell },\boldsymbol{c}_{\ell }](\boldsymbol{x})$, where
 $\boldsymbol{c}_{\ell }$ is a point inside the
 $\ell$th body (Power & Miranda Reference Power and Miranda1987). Here
 $\unicode[STIX]{x1D740}_{\ell }$ and
 $\unicode[STIX]{x1D709}_{\ell }$ are the Stokeslet and rotlet strengths, respectively, corresponding to the
 $\ell$th body. Then, for any sufficiently smooth geometry
 $\unicode[STIX]{x1D6FA}$, the solution of the incompressible Stokes equation with a Dirichlet boundary condition
 $\boldsymbol{f}$ is
 $$\begin{eqnarray}\boldsymbol{u}(\boldsymbol{x})=\boldsymbol{{\mathcal{D}}}[\boldsymbol{\unicode[STIX]{x1D702}}](\boldsymbol{x})+\mathop{\sum }_{\ell =1}^{M}S[\unicode[STIX]{x1D740}_{\ell },\boldsymbol{c}_{\ell }](\boldsymbol{x})+\mathop{\sum }_{\ell =1}^{M}R[\unicode[STIX]{x1D709}_{\ell },\boldsymbol{c}_{\ell }](\boldsymbol{x}),\quad \boldsymbol{x}\in \unicode[STIX]{x1D6FA},\end{eqnarray}$$
where the density function, Stokeslets and rotlets satisfy
 $$\begin{eqnarray}\displaystyle \boldsymbol{f}(\boldsymbol{x}) & = & \displaystyle -\frac{1}{2}\boldsymbol{\unicode[STIX]{x1D702}}(\boldsymbol{x})+\boldsymbol{{\mathcal{D}}}[\boldsymbol{\unicode[STIX]{x1D702}}](\boldsymbol{x})+{\mathcal{N}}_{0}[\boldsymbol{\unicode[STIX]{x1D702}}](\boldsymbol{x})\nonumber\\ \displaystyle & & \displaystyle +\,\mathop{\sum }_{\ell =1}^{M}S[\unicode[STIX]{x1D740}_{\ell },\boldsymbol{c}_{\ell }](\boldsymbol{x})+\mathop{\sum }_{\ell =1}^{M}R[\unicode[STIX]{x1D709}_{\ell },\boldsymbol{c}_{\ell }](\boldsymbol{x}),\quad \boldsymbol{x}\in \unicode[STIX]{x2202}\unicode[STIX]{x1D6FA},\end{eqnarray}$$
 $$\begin{eqnarray}\displaystyle & \displaystyle \unicode[STIX]{x1D740}_{\ell }=\frac{1}{2\unicode[STIX]{x03C0}}\int _{\unicode[STIX]{x1D6FE}_{\ell }}\boldsymbol{\unicode[STIX]{x1D702}}(\boldsymbol{y})\,\text{d}s_{\boldsymbol{y}},\quad \ell =1,\ldots ,M, & \displaystyle\end{eqnarray}$$
 $$\begin{eqnarray}\displaystyle & \displaystyle \unicode[STIX]{x1D709}_{\ell }=\frac{1}{2\unicode[STIX]{x03C0}}\int _{\unicode[STIX]{x1D6FE}_{\ell }}(\boldsymbol{y}-\boldsymbol{c}_{\ell })^{\bot }\boldsymbol{\cdot }\boldsymbol{\unicode[STIX]{x1D702}}(\boldsymbol{y})\,\text{d}s_{\boldsymbol{y}},\quad \ell =1,\ldots ,M. & \displaystyle\end{eqnarray}$$
 $\boldsymbol{f}$ is addressed with
 ${\mathcal{N}}_{0}$, which is the integral operator with kernel
 $N_{0}(\boldsymbol{x},\boldsymbol{y})=\boldsymbol{n}(\boldsymbol{x})\otimes \boldsymbol{n}(\boldsymbol{y})$,
 $\boldsymbol{x},\boldsymbol{y}\in \unicode[STIX]{x1D6E4}$. In this work,
 $\boldsymbol{f}$ is the prescribed velocity, which is equal to
 $\boldsymbol{U}$ on the outer wall,
 $\unicode[STIX]{x1D6E4}$, and equal to zero on the eroding bodies,
 $\unicode[STIX]{x1D6FE}_{\ell }$,
 $\ell =1,\ldots ,M$.
Once (3.3) is solved for the density function  $\boldsymbol{\unicode[STIX]{x1D702}}$, the corresponding deformation tensor, pressure and vorticity at
 $\boldsymbol{x}\in \unicode[STIX]{x1D6FA}$ are written in terms of layer potentials (Quaife & Moore Reference Quaife and Moore2018). To compute the deformation tensor for
 $\boldsymbol{x}\in \unicode[STIX]{x1D6FE}$, we include the jump term
 $$\begin{eqnarray}\frac{1}{2}\left(\frac{\unicode[STIX]{x2202}\boldsymbol{\unicode[STIX]{x1D702}}}{\unicode[STIX]{x2202}\boldsymbol{s}}\boldsymbol{\cdot }\boldsymbol{s}\right)\left[\begin{array}{@{}cc@{}}s_{x}^{2}-s_{y}^{2} & 2s_{x}s_{y}\\ 2s_{x}s_{y} & s_{y}^{2}-s_{x}^{2}\end{array}\right].\end{eqnarray}$$
Finally, the deformation tensor, pressure and vorticity due to the Stokeslets and rotlets are readily available (Pozrikidis Reference Pozrikidis1992). Having computed the deformation tensor on  $\unicode[STIX]{x1D6FE}$, the shear stress is computed using (2.2).
3.2 Cauchy integral representation of the double-layer potential
The velocity double-layer potential (3.1), and its corresponding deformation tensor, pressure and vorticity are all written as layer potentials in  $\mathbb{R}^{2}$. However, the quadrature method we introduce in § 5 requires complex-valued representations. The first step to form a complex representation is to write the Laplace double-layer potential as the complex integral
 $$\begin{eqnarray}{\mathcal{D}}[\boldsymbol{\unicode[STIX]{x1D702}}](\boldsymbol{x})=\frac{1}{2\unicode[STIX]{x03C0}}\int _{\unicode[STIX]{x2202}\unicode[STIX]{x1D6FA}}\frac{\boldsymbol{r}\boldsymbol{\cdot }\boldsymbol{n}}{\unicode[STIX]{x1D70C}^{2}}\boldsymbol{\unicode[STIX]{x1D702}}(\boldsymbol{y})\,\text{d}s_{\boldsymbol{y}}=\text{Re}(v(x)),\end{eqnarray}$$
where
 $$\begin{eqnarray}v(x)=\frac{1}{2\unicode[STIX]{x03C0}\text{i}}\int _{\unicode[STIX]{x2202}\unicode[STIX]{x1D6FA}}\frac{\unicode[STIX]{x1D702}(y)}{x-y}\,\text{d}y,\quad x\in \unicode[STIX]{x1D6FA}.\end{eqnarray}$$
Here  $x=x_{1}+\text{i}x_{2},y=y_{1}+\text{i}y_{2}\in \mathbb{C}$ are the complex counterparts of
 $\boldsymbol{x}=(x_{1},x_{2}),\boldsymbol{y}=(y_{1},y_{2})\in \mathbb{R}^{2}$, and
 $\unicode[STIX]{x1D702}=\unicode[STIX]{x1D702}_{1}+\text{i}\unicode[STIX]{x1D702}_{2}$ is the complex counterpart of
 $\boldsymbol{\unicode[STIX]{x1D702}}=(\unicode[STIX]{x1D702}_{1},\unicode[STIX]{x1D702}_{2})$. Therefore, depending on the formulation of the layer potential,
 $\unicode[STIX]{x1D6FA}$ is interpreted as a subset of
 $\mathbb{R}^{2}$ or
 $\mathbb{C}$. Equation (3.6) is converted to a Cauchy integral by first finding the boundary data of
 $v$. If
 $\unicode[STIX]{x1D6FA}$ is a simply connected interior domain then the boundary data of
 $v$ satisfies the Sokhotski–Plemelj jump relation
 $$\begin{eqnarray}v(x)=-\frac{1}{2}\unicode[STIX]{x1D702}(x)+\frac{1}{2\unicode[STIX]{x03C0}\text{i}}\int _{\unicode[STIX]{x2202}\unicode[STIX]{x1D6FA}}\frac{\unicode[STIX]{x1D702}(y)}{x-y}\,\text{d}y,\quad x\in \unicode[STIX]{x2202}\unicode[STIX]{x1D6FA}.\end{eqnarray}$$
For exterior domains, the jump term changes from  $-1/2$ to
 $1/2$ and, for multiply connected domains, such as a porous media,
 $\unicode[STIX]{x2202}\unicode[STIX]{x1D6FA}$ is decomposed into its different connected components and the appropriate jump relation is applied. Having computed the boundary data of the holomorphic function
 $v$, by the Cauchy integral theorem we have
 $$\begin{eqnarray}\displaystyle & \displaystyle v(x)=\frac{1}{2\unicode[STIX]{x03C0}\text{i}}\int _{\unicode[STIX]{x2202}\unicode[STIX]{x1D6FA}}\frac{v(y)}{y-x}\,\text{d}y, & \displaystyle\end{eqnarray}$$
 $$\begin{eqnarray}\displaystyle & \displaystyle v^{\prime }(x)=\frac{1}{2\unicode[STIX]{x03C0}\text{i}}\int _{\unicode[STIX]{x2202}\unicode[STIX]{x1D6FA}}\frac{v(y)}{(y-x)^{2}}\,\text{d}y, & \displaystyle\end{eqnarray}$$
 $$\begin{eqnarray}\displaystyle & \displaystyle v^{\prime \prime }(x)=\frac{1}{\unicode[STIX]{x03C0}\text{i}}\int _{\unicode[STIX]{x2202}\unicode[STIX]{x1D6FA}}\frac{v(y)}{(y-x)^{3}}\,\text{d}y, & \displaystyle\end{eqnarray}$$
 $x\in \unicode[STIX]{x1D6FA}$. Since
 $v(x)$ depends on the complex-valued density function
 $\unicode[STIX]{x1D702}$, we use the notation
 $v[\unicode[STIX]{x1D702}](x)$ for the holomorphic function defined in (3.6), and its first two derivatives are written as
 $v^{\prime }[\unicode[STIX]{x1D702}](x)$ and
 $v^{\prime \prime }[\unicode[STIX]{x1D702}](x)$.
Finally, the Stokes double-layer potential (3.1) can be written using a Laplace double-layer potential (3.6) and its gradients
 $$\begin{eqnarray}\displaystyle \boldsymbol{{\mathcal{D}}}[\boldsymbol{\unicode[STIX]{x1D702}}](\boldsymbol{x}) & = & \displaystyle \frac{1}{2\unicode[STIX]{x03C0}}\int _{\unicode[STIX]{x2202}\unicode[STIX]{x1D6FA}}\frac{\boldsymbol{n}}{\unicode[STIX]{x1D70C}^{2}}(\boldsymbol{r}\boldsymbol{\cdot }\boldsymbol{\unicode[STIX]{x1D702}})\,\text{d}s_{\boldsymbol{y}}+\frac{1}{2\unicode[STIX]{x03C0}}\unicode[STIX]{x1D735}\int _{\unicode[STIX]{x2202}\unicode[STIX]{x1D6FA}}\frac{\boldsymbol{r}\boldsymbol{\cdot }\boldsymbol{n}}{\unicode[STIX]{x1D70C}^{2}}(\boldsymbol{y}\boldsymbol{\cdot }\boldsymbol{\unicode[STIX]{x1D702}})\,\text{d}s_{\boldsymbol{y}}\nonumber\\ \displaystyle & & \displaystyle -\,\frac{1}{2\unicode[STIX]{x03C0}}x_{1}\unicode[STIX]{x1D735}\int _{\unicode[STIX]{x2202}\unicode[STIX]{x1D6FA}}\frac{\boldsymbol{r}\boldsymbol{\cdot }\boldsymbol{n}}{\unicode[STIX]{x1D70C}^{2}}\unicode[STIX]{x1D702}_{1}(\boldsymbol{y})\,\text{d}s_{\boldsymbol{y}}-\frac{1}{2\unicode[STIX]{x03C0}}x_{2}\unicode[STIX]{x1D735}\int _{\unicode[STIX]{x2202}\unicode[STIX]{x1D6FA}}\frac{\boldsymbol{r}\boldsymbol{\cdot }\boldsymbol{n}}{\unicode[STIX]{x1D70C}^{2}}\unicode[STIX]{x1D702}_{2}(\boldsymbol{y})\,\text{d}s_{\boldsymbol{y}}.\end{eqnarray}$$
Therefore, the Stokes double-layer potential can be written as a sum of Cauchy integrals and its first derivative (Barnett et al. Reference Barnett, Wu and Veerapaneni2015)
 $$\begin{eqnarray}\left.\begin{array}{@{}c@{}}u_{1}(x)=\text{Re}(v[\unicode[STIX]{x1D713}_{1}](x))+\text{Re}(v^{\prime }[y\cdot \unicode[STIX]{x1D702}](x))-x_{1}\text{Re}(v^{\prime }[\unicode[STIX]{x1D702}_{1}](x))-x_{2}\text{Re}(v^{\prime }[\unicode[STIX]{x1D702}_{2}](x)),\\ u_{2}(x)=\text{Re}(v[\unicode[STIX]{x1D713}_{2}](x))-\text{Im}(v^{\prime }[y\cdot \unicode[STIX]{x1D702}](x))+x_{1}\text{Im}(v^{\prime }[\unicode[STIX]{x1D702}_{1}](x))+x_{2}\text{Im}(v^{\prime }[\unicode[STIX]{x1D702}_{2}](x)),\end{array}\right\}\end{eqnarray}$$
where  $y\cdot \unicode[STIX]{x1D702}=y_{1}\unicode[STIX]{x1D702}_{1}+y_{2}\unicode[STIX]{x1D702}_{2}$,
 $$\begin{eqnarray}\displaystyle & \displaystyle \unicode[STIX]{x1D713}_{1}=(\unicode[STIX]{x1D702}_{1}+\text{i}\unicode[STIX]{x1D702}_{2})\frac{\text{Re}(n)}{n}, & \displaystyle\end{eqnarray}$$
 $$\begin{eqnarray}\displaystyle & \displaystyle \unicode[STIX]{x1D713}_{2}=(\unicode[STIX]{x1D702}_{1}+\text{i}\unicode[STIX]{x1D702}_{2})\frac{\text{Im}(n)}{n}, & \displaystyle\end{eqnarray}$$
and  $n\in \mathbb{C}$ is the complex counterpart of the outward unit normal
 $\boldsymbol{n}\in \mathbb{R}^{2}$.
3.3 Cauchy integral representation for the gradient of the double-layer potential
Computing the shear stress and vorticity requires a complex-valued layer potential representation of the velocity gradient. The deformation tensor at  $x\in \unicode[STIX]{x1D6FA}$ is found by computing the derivatives of the expressions for
 $u_{1}$ and
 $u_{2}$ in (3.10),
 $$\begin{eqnarray}\left.\begin{array}{@{}c@{}}\displaystyle \begin{array}{@{}rcl@{}}\displaystyle \frac{\unicode[STIX]{x2202}u_{1}}{\unicode[STIX]{x2202}x_{1}}\; & =\; & \displaystyle +\text{Re}(v^{\prime }[\unicode[STIX]{x1D713}_{1}](x))+\text{Re}(v^{\prime \prime }[y\cdot \unicode[STIX]{x1D702}](x))-\text{Re}(v^{\prime }[\unicode[STIX]{x1D702}_{1}](x))\\ \; & \; & -\,\displaystyle x_{1}\text{Re}(v^{\prime \prime }[\unicode[STIX]{x1D702}_{1}](x))-x_{2}\text{Re}(v^{\prime \prime }[\unicode[STIX]{x1D702}_{2}](x)),\end{array}\\ \displaystyle \begin{array}{@{}rcl@{}}\displaystyle \frac{\unicode[STIX]{x2202}u_{1}}{\unicode[STIX]{x2202}x_{2}}\; & =\; & \displaystyle -\text{Im}(v^{\prime }[\unicode[STIX]{x1D713}_{1}](x))-\text{Im}(v^{\prime \prime }[y\cdot \unicode[STIX]{x1D702}](x))+x_{1}\text{Im}(v^{\prime \prime }[\unicode[STIX]{x1D702}_{1}](x))\\ \; & \; & \,\displaystyle -\text{Re}(v^{\prime }[\unicode[STIX]{x1D702}_{2}](x))+x_{2}\text{Im}(v^{\prime \prime }[\unicode[STIX]{x1D702}_{2}](x)),\end{array}\\ \displaystyle \begin{array}{@{}rcl@{}}\displaystyle \frac{\unicode[STIX]{x2202}u_{2}}{\unicode[STIX]{x2202}x_{1}}\; & =\; & \displaystyle +\text{Re}(v^{\prime }[\unicode[STIX]{x1D713}_{2}](x))-\text{Im}(v^{\prime \prime }[y\cdot \unicode[STIX]{x1D702}](x))+\text{Im}(v^{\prime }[\unicode[STIX]{x1D702}_{1}](x))\\ \; & \; & +\,\displaystyle x_{1}\text{Im}(v^{\prime \prime }[\unicode[STIX]{x1D702}_{1}](x))+x_{2}\text{Im}(v^{\prime \prime }[\unicode[STIX]{x1D702}_{2}](x)),\end{array}\\ \displaystyle \begin{array}{@{}rcl@{}}\displaystyle \frac{\unicode[STIX]{x2202}u_{2}}{\unicode[STIX]{x2202}x_{2}}\; & =\; & -\text{Im}(v^{\prime }[\unicode[STIX]{x1D713}_{2}](x))-\text{Re}(v^{\prime \prime }[y\cdot \unicode[STIX]{x1D702}](x))+x_{1}\text{Re}(v^{\prime \prime }[\unicode[STIX]{x1D702}_{1}](x))\\ \; & \; & +\,\text{Im}(v^{\prime }[\unicode[STIX]{x1D702}_{2}](x))+x_{2}\text{Re}(v^{\prime \prime }[\unicode[STIX]{x1D702}_{2}](x)).\end{array}\end{array}\right\}\end{eqnarray}$$
The same expressions are used to compute the deformation tensor for  $x\in \unicode[STIX]{x2202}\unicode[STIX]{x1D6FA}$, except that the jump condition (3.4) is included. Finally, to compute the shear stress, the deformation tensor on
 $\unicode[STIX]{x2202}\unicode[STIX]{x1D6FA}$ is applied to the normal and tangent vectors as in (2.2). The velocity gradient is also used to compute the vorticity in the fluid bulk. For
 $x\in \unicode[STIX]{x1D6FA}$, the Cauchy integral representation of the vorticity at
 $x\in \unicode[STIX]{x1D6FA}$ is
 $$\begin{eqnarray}\unicode[STIX]{x1D714}(x)=\text{Re}(v^{\prime }[\unicode[STIX]{x1D713}_{2}](x))+\text{Im}(v^{\prime }[\unicode[STIX]{x1D713}_{1}](x))+\text{Re}(v^{\prime }[\unicode[STIX]{x1D702}_{2}](x))+\text{Im}(v^{\prime }[\unicode[STIX]{x1D702}_{1}](x)).\end{eqnarray}$$
4 Transport, tracers and tortuosity
Erosion in porous media leads to phenomena such as channelization (Berhanu et al. Reference Berhanu, Petroff, Devauchelle, Kudrolli and Rothman2012), and we are interested in characterizing transport in such geometries. In our previous work (Quaife & Moore Reference Quaife and Moore2018), we examined the effect of erosion on the area fraction, flow rate and the total drag. However, to characterize macroscopic signatures of the transport, other quantities must be examined. Here, we compute the anomalous dispersion rate, the tortuosity and the distribution of the pore sizes. The first two metrics are defined in terms of streamlines governed by the autonomous advection equation (1.1).
4.1 Anomalous dispersion
The spreading of fluid in a porous media is often characterized in terms of anomalous dispersion (Dentz et al. Reference Dentz, Cortis, Scher and Berkowitz2004; Klages, Radons & Sokolov Reference Klages, Radons and Sokolov2008). The anomalous dispersion rate depends on the porosity and permeability (Koch & Brady Reference Koch and Brady1988), but is also affected by the distribution and shape of the grains. We calculate the anomalous dispersion rates by analyzing the streamlines governed by (1.1) in eroded geometries. Given a set of  $N_{p}$ trajectories, we define
 $\unicode[STIX]{x1D706}_{j}(t)$ to be the arclength of the trajectory
 $$\begin{eqnarray}\unicode[STIX]{x1D706}_{j}(t)=\int _{0}^{t}\Vert \boldsymbol{s}_{j}^{\prime }(\tilde{t})\Vert \,\text{d}\tilde{t},\quad j=1,\ldots ,N_{p}.\end{eqnarray}$$
Then, the first and second ensemble moments are
 $$\begin{eqnarray}\displaystyle & \displaystyle \langle \unicode[STIX]{x1D706}\rangle (t)=\frac{1}{N_{p}}\mathop{\sum }_{j=1}^{N_{p}}\unicode[STIX]{x1D706}_{j}(t), & \displaystyle\end{eqnarray}$$
 $$\begin{eqnarray}\displaystyle & \displaystyle \unicode[STIX]{x1D70E}_{\unicode[STIX]{x1D706}}^{2}(t)=\frac{1}{N_{p}}\mathop{\sum }_{j=1}^{N_{p}}[\unicode[STIX]{x1D706}_{j}(t)-\langle \unicode[STIX]{x1D706}\rangle (t)]^{2}, & \displaystyle\end{eqnarray}$$
 $\unicode[STIX]{x1D70E}_{\unicode[STIX]{x1D706}}$ characterizes the dispersion. At early times, the particles have not explored much of the geometry, and we expect a ballistic motion
 $\unicode[STIX]{x1D70E}_{\unicode[STIX]{x1D706}}\sim t$. However, as the particles pass the grains, their trajectories are altered, and we expect that
 $\unicode[STIX]{x1D70E}_{\unicode[STIX]{x1D706}}\sim t^{\unicode[STIX]{x1D6FC}}$, with
 $\unicode[STIX]{x1D6FC}\in (0.5,1)$, indicating that the flow is super-dispersive.
To establish an asymptotic anomalous dispersion rate, the trajectories must pass several grains. The geometries that we consider are too short to observe asymptotic dispersion, so we use a reinsertion method to form longer trajectories. Similar to the work of others (de Anna et al. Reference de Anna, Quaife, Biros and Juanes2018; Puyguiraud et al. Reference Puyguiraud, Gouze and Dentz2019), once a particle reaches the outlet of the porous region, it is reinserted at the inlet. To minimize errors caused by reinsertion, the particle is initialized at the discretization point that has the closest velocity to the particle’s velocity at the outlet. This method of reinsertion does not artificially decorrelate the particle velocities (Puyguiraud et al. Reference Puyguiraud, Gouze and Dentz2019), and this allows us to reliably use the statistical moments (4.2) to characterize the anomalous dispersion. After a single trajectory is formed, it has undergone a collection of reinsertions. Then, as a post-processing step, the trajectory is made continuous by attaching the tail of each segment to the origin of the next segment.
4.2 Tortuosity
The tortuosity is a dimensionless number that quantifies the amount of twisting of streamlines. Unlike the dispersion calculations, we do not use reinsertion to form long trajectories. The local tortuosity is
 $$\begin{eqnarray}\unicode[STIX]{x1D70F}(y_{0})=\frac{\unicode[STIX]{x1D706}(y_{0})}{d}.\end{eqnarray}$$
Here the streamline originates on the inlet cross-section  $x=x_{0}$ at
 $(x_{0},y_{0})$ and its arclength,
 $\unicode[STIX]{x1D706}(y_{0})$, is calculated until the streamline passes the parallel outlet cross-section
 $x=x_{0}+d$. In this work, we consider streamlines originating at
 $x=-1$ and terminating at
 $x=1$, so
 $d=2$. However, other choices for the terminal point when computing the tortuosity are sometime used (Duda et al. Reference Duda, Koza and Matyka2011). We note that if a streamline originates in a recirculation zone, which is possible in two dimensions (Higdon Reference Higdon1985), then the local tortuosity will be infinite. However, in each of our numerical experiments, all the streamlines we consider connect the inlet to the outlet. Having only finite local tortuosities, the hydraulic tortuosity is defined by taking the average over all points on the inlet cross-section
 $$\begin{eqnarray}T=\frac{1}{d}\left(\int _{S}u_{1}(x_{0},y_{0})\unicode[STIX]{x1D706}(y_{0})\,\text{d}y_{0}\right)\left/\left(\int _{S}u_{1}(x_{0},y_{0})\,\text{d}y_{0}\right)\right.,\end{eqnarray}$$
where  $S$ is the inlet cross-section
 $x=-1$,
 $u_{1}(y_{0})$ is the
 $x$-component of the velocity at the initial point of the streamline and
 $d=2$ is the distance between the inlet and outlet. Note that
 $T\geqslant 1$, and
 $T=1$ only if no grains are present.
The tortuosity can also be computed with an area integral. Assuming that the flow is incompressible and not re-entrant, meaning that all streamlines connect the two cross-sections, the tortuosity in (4.4) is equivalent to (Duda et al. Reference Duda, Koza and Matyka2011)
 $$\begin{eqnarray}T=\left(\int _{\unicode[STIX]{x1D6FA}}\Vert \boldsymbol{u}(\boldsymbol{y})\Vert \,\text{d}\boldsymbol{y}\right)\left/\left(\int _{\unicode[STIX]{x1D6FA}}u_{1}(\boldsymbol{y})\,\text{d}\boldsymbol{y}\right)\right.,\end{eqnarray}$$
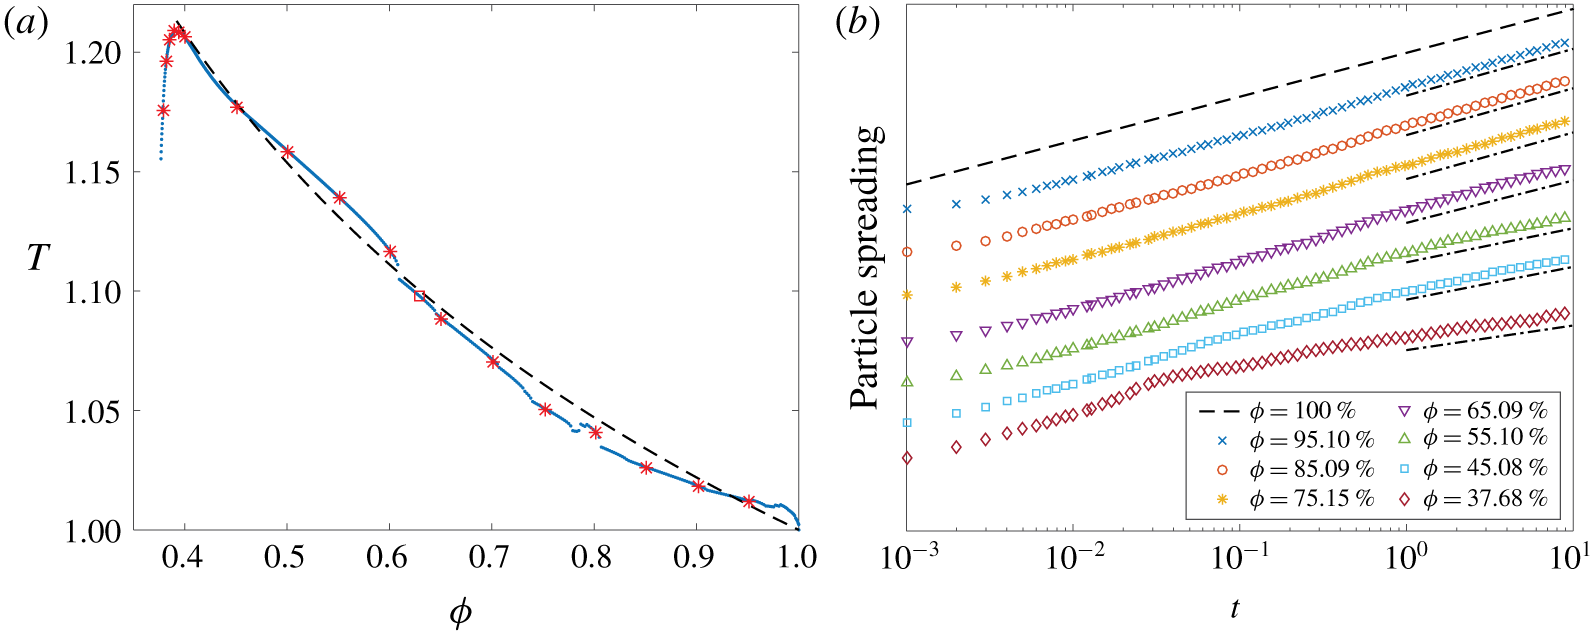
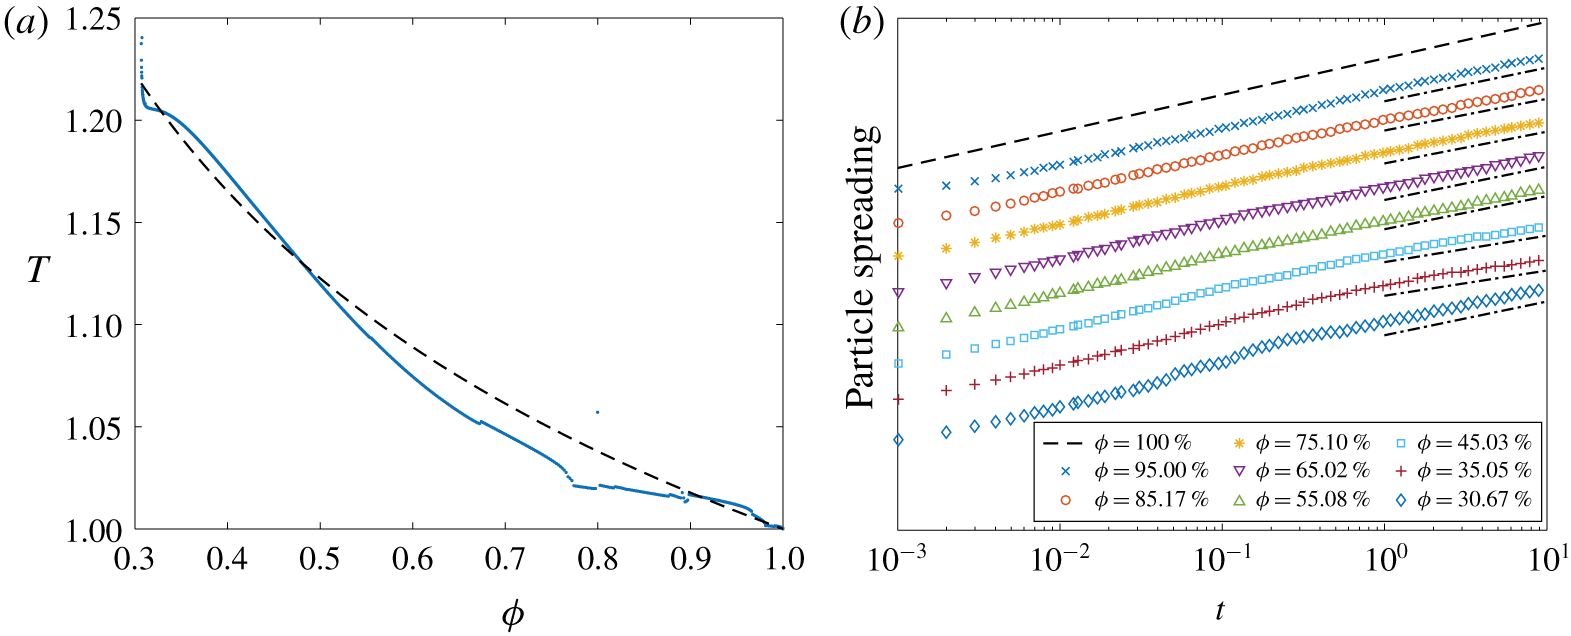
where  $\unicode[STIX]{x1D6FA}$ is the fluid region between the inlet and outlet cross-sections. Our examples do contain recirculation zones, but they are very small and have a negligible effect on the tortuosity. Since (4.5) does not require the additional work of computing particle trajectories at every time step, we use this definition for the majority of the tortuosity calculations. However, we do compare the two definitions for the tortuosity at several porosities in § 6.
There have been efforts to relate the tortuosity,  $T$, to the porosity,
 $\unicode[STIX]{x1D719}$. For example, Matyka et al. (Reference Matyka, Khalili and Koza2008) proposed the models
 $$\begin{eqnarray}\displaystyle & \displaystyle \widehat{T}(\unicode[STIX]{x1D719})=\unicode[STIX]{x1D719}^{-p}, & \displaystyle\end{eqnarray}$$
 $$\begin{eqnarray}\displaystyle & \displaystyle \widehat{T}(\unicode[STIX]{x1D719})=1-p\log \unicode[STIX]{x1D719}, & \displaystyle\end{eqnarray}$$
 $$\begin{eqnarray}\displaystyle & \displaystyle \widehat{T}(\unicode[STIX]{x1D719})=1+p(1-\unicode[STIX]{x1D719}), & \displaystyle\end{eqnarray}$$
 $$\begin{eqnarray}\displaystyle & \displaystyle \widehat{T}(\unicode[STIX]{x1D719})=(1+p(1-\unicode[STIX]{x1D719}))^{2}, & \displaystyle\end{eqnarray}$$
 $p>0$ is a fitting parameter. In § 6 we compare these four models with the tortuosity of eroding porous geometries.
4.3 Pore throat size
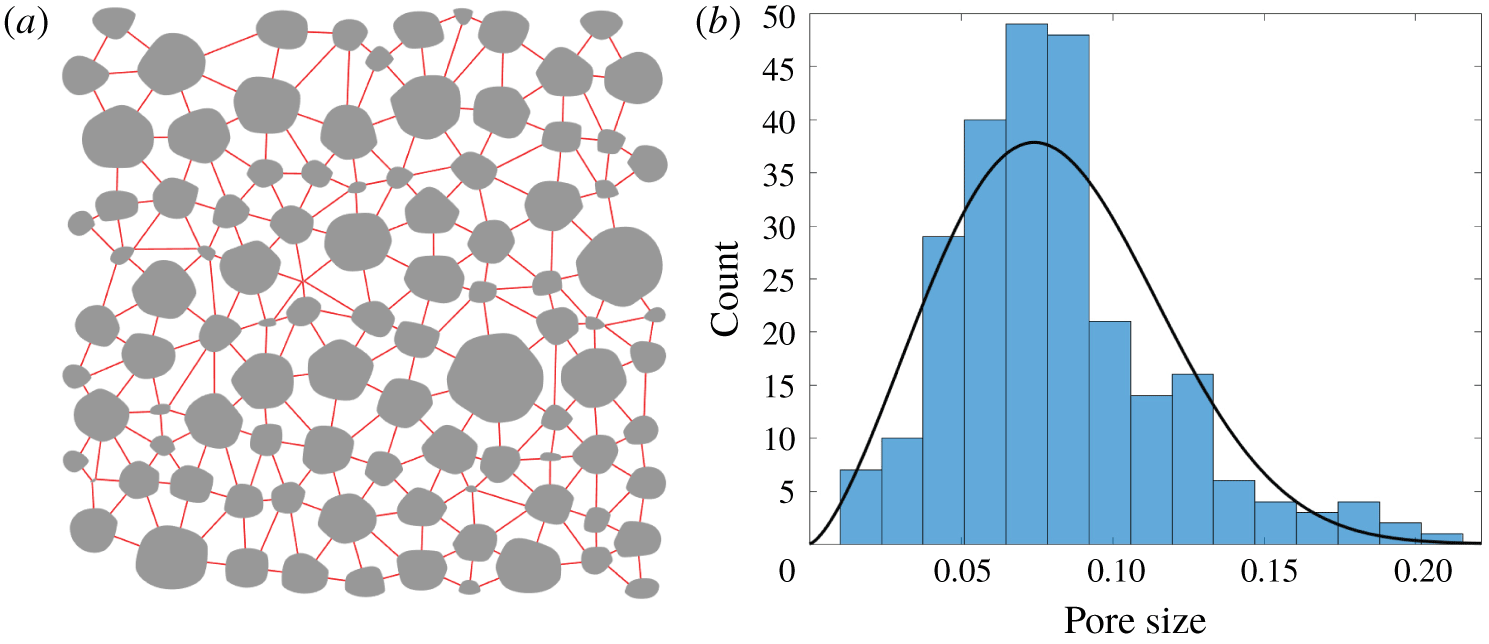
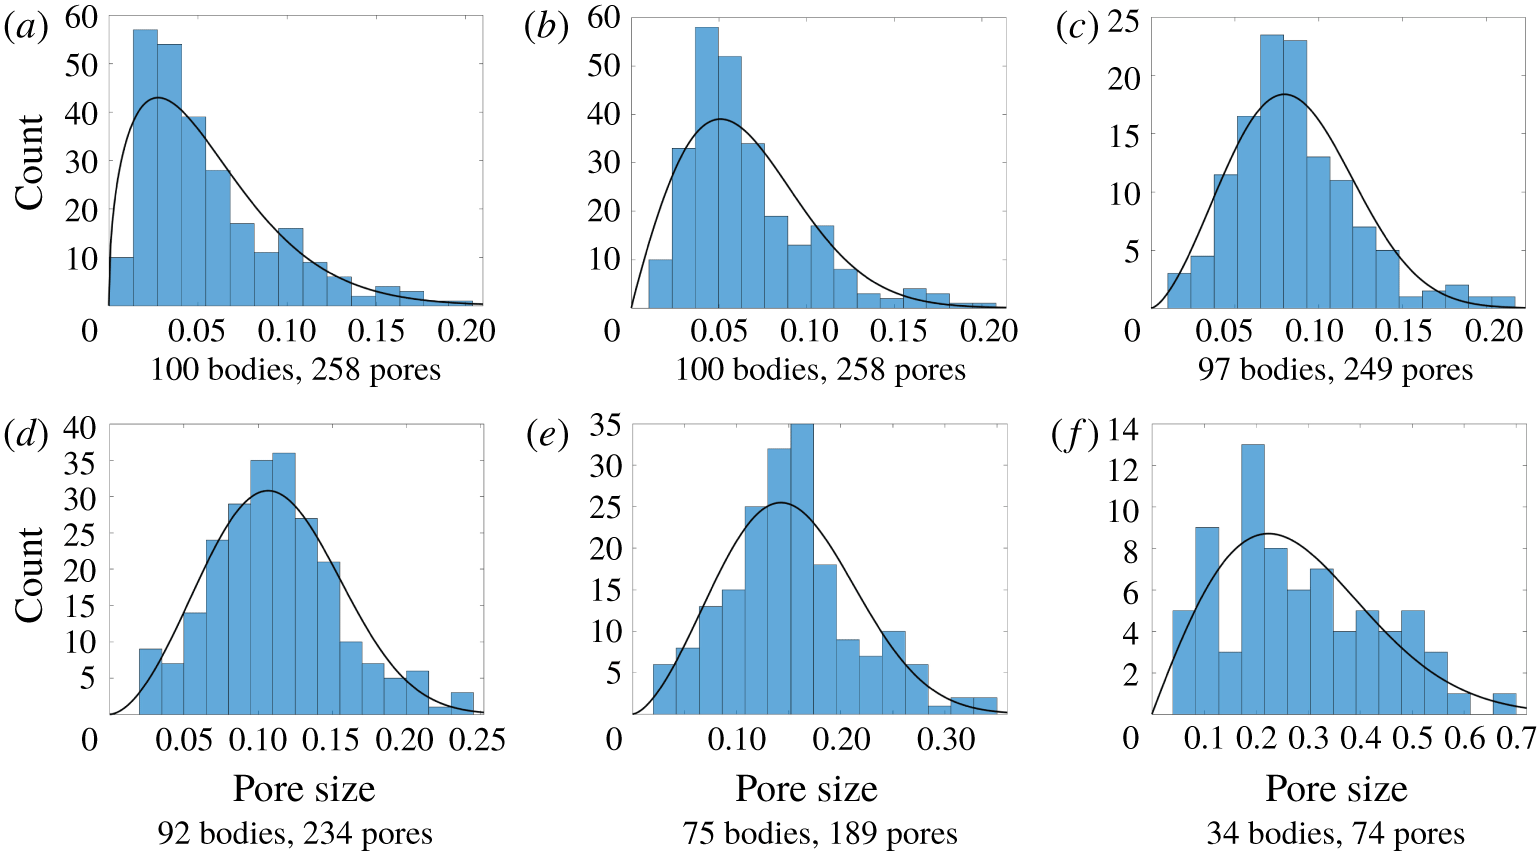
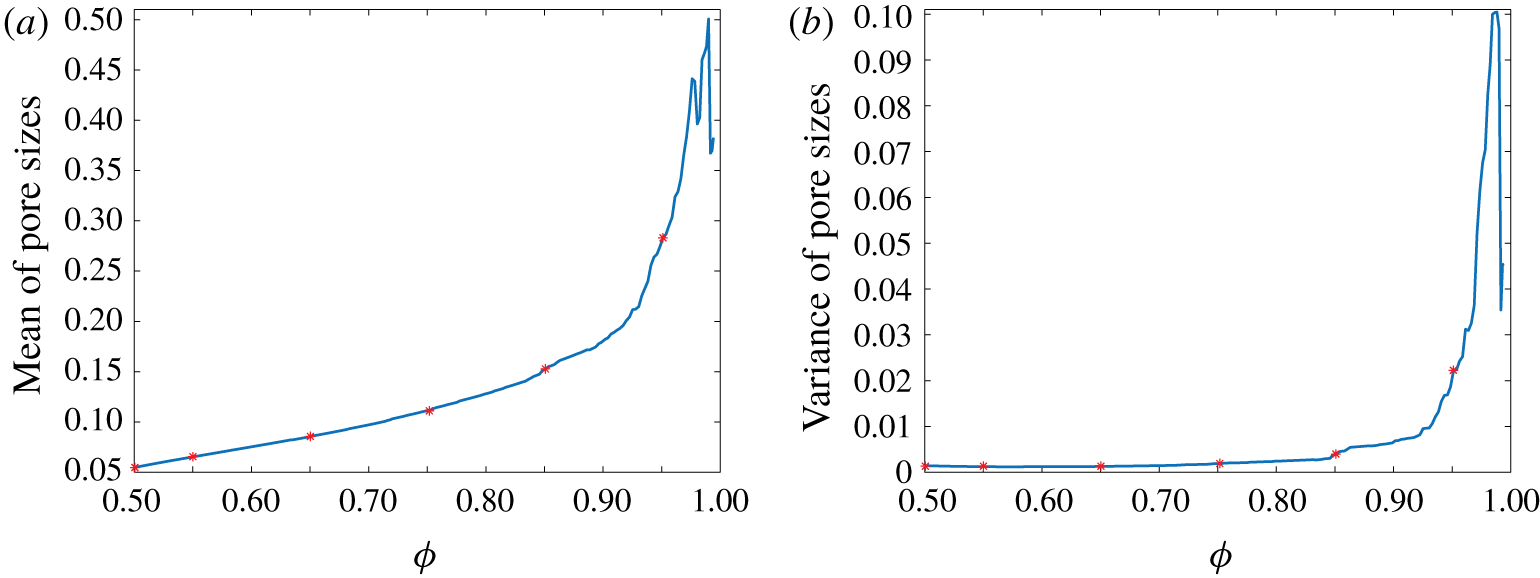
While transport in porous media depends on the porosity, it also depends on the placement of the grains. In particular, grain placement affects velocity scales (Alim et al. Reference Alim, Parsa, Weitz and Brenner2017), correlation structures (Borgne et al. Reference Borgne, de Dreuzy, Davy and Bour2007), contaminant transport (Knudby & Carrera Reference Knudby and Carrera2005), channelization (Berhanu et al. Reference Berhanu, Petroff, Devauchelle, Kudrolli and Rothman2012; Siena et al. Reference Siena, Ilievand, Prill, Riva and Guadagnini2019) and pore network models (Bryant et al. Reference Bryant, King and Mellor1993a,Reference Bryant, Mellor and Cadeb; Bijeljic & Blunt Reference Bijeljic and Blunt2006). To characterize the grain placement, we compute distributions of pore sizes between neighbouring grains. To define neighbouring grains, we form the Delaunay triangulation using nodes placed at the centre of each eroding grain and at a collection of points around the boundary of the porous media. Then, we say that two grains are neighbours if their centres share an edge of the triangulation (de Anna et al. Reference de Anna, Quaife, Biros and Juanes2018). Finally, we define the pore sizes to be the minimum distance between all pairs of neighbouring grains, and these distances are represented by the red line segments in figure 3(a). We do not consider pores between eroding bodies and the solid wall  $\unicode[STIX]{x1D6E4}$, so some of the grains near the porous region boundary only have two neighbours. Having defined the pore sizes, we plot its distribution in figure 3(b) and compare it with the Weibull distribution, a distribution used by others to characterize pore sizes (Ioannidis & Chatzis Reference Ioannidis and Chatzis1993). In § 6.4 we investigate the effect of erosion on the pore size distribution.
(a) The pore sizes, represented by the length of the red line segments, between neighbouring grains. Two grains are neighbours if they share an edge of the Delanuay triangulation with nodes at the centre of each eroding grain. (b) The pore sizes of an eroded geometry. The black curve is the Weibull distribution with the same first two moments as the data.

5 Numerical methods
In line with our previous work (Quaife & Moore Reference Quaife and Moore2018), we use two meshes to simulate erosion. The integral equation is solved by discretizing the boundary of the geometry at a set of collocation points distributed equally in arclength (§ 5.1). Depending on the proximity of the target point to the source points, the quadrature rule is either the trapezoid rule or the Barycentric quadrature rule (§ 5.2). The criteria that determines which quadrature method is applied is described in § 5.3. Once the shear stress is computed, the bodies are eroded a single time step by using a  $\unicode[STIX]{x1D703}$–
 $L$ discretization (Hou et al. Reference Hou, Lowengrub and Shelley1994; Moore et al. Reference Moore, Ristroph, Childress, Zhang and Shelley2013). The time-stepping methods for erosion and passive particles are described in § 5.4.
5.1 Spatial discretization
Since we use a BIE formulation, we only need to discretize the one-dimensional boundary of the domain. We discretize each eroding grain  $\unicode[STIX]{x1D6FE}_{k}$ with
 $N_{in}$ points and discretize the outer wall
 $\unicode[STIX]{x1D6E4}$ with
 $N_{out}$ points. The
 $j$th discretization point on
 $\unicode[STIX]{x1D6E4}$ and
 $\unicode[STIX]{x1D6FE}_{k}$ are denoted by
 $\boldsymbol{y}_{j}^{0}$ and
 $\boldsymbol{y}_{j}^{k}$, respectively. The discretization points are initially distributed evenly in arclength, and this equispacing is maintained throughout the entire simulation by using the
 $\unicode[STIX]{x1D703}$–
 $L$ formulation. In addition, we apply regularization (Quaife & Moore Reference Quaife and Moore2018) to slightly smooth the corners that inevitably develop during erosion.
Given the discretization points of  $\unicode[STIX]{x2202}\unicode[STIX]{x1D6FA}$, the trapezoid rule results in the collocation method for (3.3),
 $$\begin{eqnarray}\displaystyle \boldsymbol{U}_{\ell } & = & \displaystyle \mathop{\sum }_{j=1}^{N_{out}}w_{j}^{0}D(\boldsymbol{y}_{\ell }^{0},\boldsymbol{y}_{j}^{0})\boldsymbol{\unicode[STIX]{x1D702}}_{j}^{0}+\mathop{\sum }_{k=1}^{M}\mathop{\sum }_{j=1}^{N_{in}}w_{j}^{k}D(\boldsymbol{y}_{\ell }^{0},\boldsymbol{y}_{j}^{k})\boldsymbol{\unicode[STIX]{x1D702}}_{j}^{k}+\mathop{\sum }_{j=1}^{N_{out}}w_{j}^{0}N_{0}(\boldsymbol{y}_{\ell }^{0},\boldsymbol{y}_{j}^{0})\boldsymbol{\unicode[STIX]{x1D702}}_{j}^{0}\nonumber\\ \displaystyle & & \displaystyle +\,\mathop{\sum }_{k=1}^{M}S[\unicode[STIX]{x1D740}_{k},\boldsymbol{c}_{k}](\boldsymbol{y}_{\ell }^{0})+\mathop{\sum }_{k=1}^{M}R[\unicode[STIX]{x1D709}_{k},\boldsymbol{c}_{k}](\boldsymbol{y}_{\ell }^{0}),\quad \ell =1,\ldots ,N_{out},\end{eqnarray}$$
 $$\begin{eqnarray}\displaystyle \mathbf{0} & = & \displaystyle \mathop{\sum }_{j=1}^{N_{out}}w_{j}^{0}D(\boldsymbol{y}_{\ell }^{m},\boldsymbol{y}_{j}^{0})\boldsymbol{\unicode[STIX]{x1D702}}_{j}^{0}+\mathop{\sum }_{k=1}^{M}\mathop{\sum }_{j=1}^{N_{in}}w_{j}^{k}D(\boldsymbol{y}_{\ell }^{m},\boldsymbol{y}_{j}^{k})\boldsymbol{\unicode[STIX]{x1D702}}_{j}^{k}\nonumber\\ \displaystyle & & \displaystyle +\,\mathop{\sum }_{k=1}^{M}S[\unicode[STIX]{x1D740}_{k},\boldsymbol{c}_{k}](\boldsymbol{y}_{\ell }^{m})+\mathop{\sum }_{k=1}^{M}R[\unicode[STIX]{x1D709}_{k},\boldsymbol{c}_{k}](\boldsymbol{y}_{\ell }^{m}),\quad m=1,\ldots ,M,\ell =1,\ldots ,N_{in},\qquad\end{eqnarray}$$
 $$\begin{eqnarray}\displaystyle & \displaystyle \unicode[STIX]{x1D740}_{m}=\frac{1}{2\unicode[STIX]{x03C0}}\mathop{\sum }_{j=1}^{N_{in}}w_{j}^{m}\boldsymbol{\unicode[STIX]{x1D702}}_{j}^{m},\quad m=1,\ldots ,M, & \displaystyle\end{eqnarray}$$
 $$\begin{eqnarray}\displaystyle & \displaystyle \unicode[STIX]{x1D709}_{m}=\frac{1}{2\unicode[STIX]{x03C0}}\mathop{\sum }_{j=1}^{N_{in}}w_{j}^{m}(\boldsymbol{y}_{j}^{m}-\boldsymbol{c}_{m})^{\bot }\boldsymbol{\cdot }\boldsymbol{\unicode[STIX]{x1D702}}_{j}^{m},\quad m=1,\ldots ,M, & \displaystyle\end{eqnarray}$$
 $w_{j}^{k}$ are quadrature weights that depend on
 $N_{in}$,
 $N_{out}$ and the lengths of
 $\unicode[STIX]{x1D6FE}^{k}$ and
 $\unicode[STIX]{x1D6E4}$, and
 $D$ is the kernel of the Stokes double-layer potential defined in (3.1). Since the kernel is smooth, the diagonal terms
 $D(\boldsymbol{y}_{j}^{m},\boldsymbol{y}_{j}^{m})$ are replaced with the appropriate curvature-dependent limiting term. The linear system (5.1) is a well-conditioned second-kind integral equation and is solved iteratively with the generalized minimal residual (GMRES) method. If the number of discretization points is sufficiently large then the solution of (5.1) is an accurate approximation of the density function, Stokeslets and rotlets. Then, for
 $\boldsymbol{x}\in \unicode[STIX]{x1D6FA}$, the double-layer potential is approximated as
 $$\begin{eqnarray}\boldsymbol{u}(\boldsymbol{x})=\mathop{\sum }_{j=1}^{N_{out}}w_{j}^{0}D(\boldsymbol{x},\boldsymbol{y}_{j}^{0})\boldsymbol{\unicode[STIX]{x1D702}}_{j}+\mathop{\sum }_{k=1}^{M}\mathop{\sum }_{j=1}^{N_{in}}w_{j}^{k}D(\boldsymbol{x},\boldsymbol{y}_{j}^{k})\boldsymbol{\unicode[STIX]{x1D702}}_{j}^{k}.\end{eqnarray}$$
Similarly, the corresponding layer potentials for the deformation tensor and vorticity are approximated with the trapezoid rule. The contributions due to the Stokeslets and rotlets require no quadrature and are easily included in the velocity, deformation tensor and vorticity. Finally, Fourier differentiation is used to compute the jump term (3.4) of the shear stress, and then the tensor is applied to the normal and tangent vectors as defined in (2.2).
Once the velocity is computed in  $\unicode[STIX]{x1D6FA}$, the tortuosity can be computed with the Eulerian velocity field (4.5). We compute the velocity at
 $\boldsymbol{x}_{ij}=(-1+i\unicode[STIX]{x0394}x,-1+j\unicode[STIX]{x0394}y)$,
 $i,j=1,\ldots ,N$, where
 $\unicode[STIX]{x0394}x=\unicode[STIX]{x0394}y=2/N$, and the velocity at points inside an eroding body are assigned a value of 0. Then, the tortuosity is approximated as
 $$\begin{eqnarray}T=\left(\mathop{\sum }_{i,j=1}^{N}\Vert \boldsymbol{u}(\boldsymbol{x}_{ij})\Vert \unicode[STIX]{x0394}x\unicode[STIX]{x0394}y\right)\left/\left(\mathop{\sum }_{i,j=1}^{N}u_{1}(\boldsymbol{x}_{ij})\unicode[STIX]{x0394}x\unicode[STIX]{x0394}y\right)\right..\end{eqnarray}$$
5.2 Barycentric quadrature formulae
While the trapezoid rule is spectrally accurate for smooth, periodic functions (Trefethen & Weideman Reference Trefethen and Weideman2014), the derivative of the integrand grows as the target point  $\boldsymbol{x}$ approaches
 $\unicode[STIX]{x2202}\unicode[STIX]{x1D6FA}$. Therefore, if the trapezoid rule is applied when bodies are in near contact, or if a layer potential is evaluated at a point close to
 $\unicode[STIX]{x2202}\unicode[STIX]{x1D6FA}$, then the result becomes unreliable and the simulation ultimately becomes unstable. We thus desire a quadrature method whose error bound does not depend on the target location.
We showed in §§ 3.2 and 3.3 that the velocity, shear stress and vorticity of the double-layer representation can all be written as the sum of Cauchy integrals and its first two derivatives. Therefore, we require quadrature rules with a uniform error bound for Cauchy integrals and its derivatives (3.8). Ioakimidis, Papadakis & Perdios (Reference Ioakimidis, Papadakis and Perdios1991) developed quadrature rules, that we call Barycentric quadrature rules, to compute Cauchy integrals and their derivatives with an error bound that is independent of  $x\in \mathbb{C}$. Then, Barnett et al. (Reference Barnett, Wu and Veerapaneni2015) used these quadrature rules to compute the Stokes double-layer potential representation of the velocity (3.1). After briefly summarizing this method, we compute the second derivative so that the shear stress and vorticity can be accurately computed.
We present the quadrature rules for a simply connected interior domain  $\unicode[STIX]{x1D6FA}\subset \mathbb{C}$, with any point
 $a\in \unicode[STIX]{x1D6FA}$, and we consider target points
 $x\in \unicode[STIX]{x1D6FA}$ and
 $x\in \unicode[STIX]{x1D6FA}^{c}$. Then, the quadrature rules can be applied to individual components of a multiply connected domain to compute the velocity, vorticity and deformation tensor in an eroding porous media. The method starts with an underlying quadrature rule, and we use the spectrally accurate
 $N$-point trapezoid rule. Since the quadrature points are uniformly distributed, the quadrature weights are
 $w_{j}=L/N$,
 $j=1,\ldots ,N$, where
 $L$ is the length of
 $\unicode[STIX]{x2202}\unicode[STIX]{x1D6FA}$.
Again, given a complex-valued density function  $\unicode[STIX]{x1D702}$, the boundary data of
 $v[\unicode[STIX]{x1D702}](x)$, as defined in (3.6), satisfies the Sokhotski–Plemelj jump relation (3.7). Since the limiting boundary data of
 $v$ differs when considering
 $x\in \unicode[STIX]{x1D6FA}$ and
 $x\in \unicode[STIX]{x1D6FA}^{c}$, we denote the boundary data as
 $v^{-}$ for
 $x\in \unicode[STIX]{x1D6FA}$, and as
 $v^{+}$ for
 $x\in \unicode[STIX]{x1D6FA}^{c}$. Rather than directly applying the trapezoid rule to approximate
 $v(x)$ in (3.8), we start with the identity
 $$\begin{eqnarray}\int _{\unicode[STIX]{x2202}\unicode[STIX]{x1D6FA}}\frac{v^{-}(y)-v(x)}{y-x}\,\text{d}y=0,\quad x\in \unicode[STIX]{x1D6FA}.\end{eqnarray}$$
Since the integrand is bounded for all  $x\in \unicode[STIX]{x1D6FA}$, we can apply the trapezoid rule
 $$\begin{eqnarray}\mathop{\sum }_{j=1}^{N}\frac{v^{-}(y_{j})-v(x)}{y_{j}-x}w_{j}\approx 0,\end{eqnarray}$$
and the error is independent of  $x$. Rearranging for
 $v(x)$, we have the interior Barycentric quadrature rule
 $$\begin{eqnarray}v(x)=\left(\mathop{\sum }_{j=1}^{N}\frac{v^{-}(y_{j})}{y_{j}-x}w_{j}\right)\left/\left(\mathop{\sum }_{j=1}^{N}\frac{1}{y_{j}-x}w_{j}\right),\quad x\in \unicode[STIX]{x1D6FA}.\right.\end{eqnarray}$$
Using a similar construction and letting  $a$ be any point inside
 $\unicode[STIX]{x1D6FA}$, the exterior Barycentric quadrature rule is
 $$\begin{eqnarray}v(x)=\frac{1}{x-a}\left(\mathop{\sum }_{j=1}^{N}\frac{v^{+}(y_{j})}{y_{j}-x}w_{j}\right)\left/\left(\mathop{\sum }_{j=1}^{N}\frac{(y_{j}-a)^{-1}}{y_{j}-x}w_{j}\right),\quad x\in \unicode[STIX]{x1D6FA}^{c}.\right.\end{eqnarray}$$
Similar constructions can be used to derive quadrature rules for  $v^{\prime }(x)$. For
 $x\in \unicode[STIX]{x1D6FA}$, we have the identity
 $$\begin{eqnarray}\int _{\unicode[STIX]{x2202}\unicode[STIX]{x1D6FA}}\frac{v^{-}(y)-v(x)+(y-x)v^{\prime }(x)}{(y-x)^{2}}=0,\end{eqnarray}$$
and the integrand is bounded for all  $x\in \unicode[STIX]{x1D6FA}$. Therefore, after applying the trapezoid rule and rearranging for
 $v^{\prime }(x)$, we have the interior quadrature rule
 $$\begin{eqnarray}v^{\prime }(x)=\left(\mathop{\sum }_{j=1}^{N}\frac{v^{-}(y_{j})-v(x)}{(y_{j}-x)^{2}}w_{j}\right)\left/\left(\mathop{\sum }_{j=1}^{N}\frac{1}{y_{j}-x}w_{j}\right),\quad x\in \unicode[STIX]{x1D6FA}.\right.\end{eqnarray}$$
Using a similar construction, an exterior quadrature rule for the first derivative is
 $$\begin{eqnarray}v^{\prime }(x)=\frac{1}{x-a}\left(\mathop{\sum }_{j=1}^{N}\frac{v_{j}^{+}-v(x)}{(y_{j}-x)^{2}}w_{j}\right)\left/\left(\mathop{\sum }_{j=1}^{N}\frac{(y_{j}-a)^{-1}}{y_{j}-x}w_{j}\right),\quad x\in \unicode[STIX]{x1D6FA}^{c}.\right.\end{eqnarray}$$
Note that  $v(x)$ is required to compute
 $v^{\prime }(x)$ for both the interior and exterior case, and this is available using the Barycentric quadrature rules (5.6) and (5.7). As pointed out by Barnett et al. (Reference Barnett, Wu and Veerapaneni2015), equations (5.9) and (5.10) are not in a Barycentric form since the numerators suffer from catastrophic cancellation as
 $x$ approaches
 $\unicode[STIX]{x2202}\unicode[STIX]{x1D6FA}$. The result is that the quadrature error is not uniformly bounded. However, since these errors are sufficiently small for the geometries and resolutions we consider, we use these quadrature formulae nonetheless. We note that the quadrature formulae can be put into true Barycentric form (Barnett et al. (Reference Barnett, Wu and Veerapaneni2015), see equations (3.11) and (3.13)) but this increases the complexity for evaluating
 $v^{\prime }(x)$ to
 $O(N^{2})$ operations.
To compute the shear stress and vorticity, we require a quadrature rule for  $v^{\prime \prime }(x)$. The derivation is largely based on the work of Ioakimidis et al. (Reference Ioakimidis, Papadakis and Perdios1991, see equation (2.12)). We start with the second derivative of the Cauchy integral theorem
 $$\begin{eqnarray}0=\frac{1}{2\unicode[STIX]{x03C0}\text{i}}\int _{\unicode[STIX]{x2202}\unicode[STIX]{x1D6FA}}\frac{2v^{-}(y)}{(y-x)^{3}}\,\text{d}y-v^{\prime \prime }(x).\end{eqnarray}$$
For the interior case,  $x\in \unicode[STIX]{x1D6FA}$, we use the identity
 $$\begin{eqnarray}\frac{1}{2\unicode[STIX]{x03C0}\text{i}}\int _{\unicode[STIX]{x2202}\unicode[STIX]{x1D6FA}}\frac{1}{(y-x)^{n}}\,\text{d}y=\left\{\begin{array}{@{}ll@{}}1, & n=1,\\ 0, & n=2,3,\ldots .\\ \end{array}\right.\end{eqnarray}$$
Combining this identity with the Cauchy integral representation of  $v^{\prime \prime }(x)$, we have
 $$\begin{eqnarray}0=\frac{1}{2\unicode[STIX]{x03C0}\text{i}}\int _{\unicode[STIX]{x2202}\unicode[STIX]{x1D6FA}}\frac{2v^{-}(y)-v^{\prime \prime }(x)(y-x)^{2}-2v(x)-2(y-x)v^{\prime }(x)}{(y-x)^{3}}\,\text{d}y.\end{eqnarray}$$
This integrand is constructed so that it is bounded for all  $x\in \unicode[STIX]{x1D6FA}$, and applying the trapezoid rule, we have
 $$\begin{eqnarray}0\approx \mathop{\sum }_{j=1}^{N}\frac{2v^{-}(y_{j})-v^{\prime \prime }(x)(y_{j}-x)^{2}-2v(x)-2(y_{j}-x)v^{\prime }(x)}{(y_{j}-x)^{3}}w_{j},\end{eqnarray}$$
where the accuracy is independent of  $x$. Solving for
 $v^{\prime \prime }(x)$, the quadrature rule for the interior second derivative at
 $x\in \unicode[STIX]{x1D6FA}$ is
 $$\begin{eqnarray}v^{\prime \prime }(x)\approx \left(2\mathop{\sum }_{j=1}^{N}\frac{v_{j}^{-}-v(x)-(y_{j}-x)v^{\prime }(x)}{(y_{j}-x)^{3}}w_{j}\right)\left/\left(\mathop{\sum }_{j=1}^{N}\frac{1}{y_{j}-x}w_{j}\right)\right..\end{eqnarray}$$
For the exterior case,  $x\in \unicode[STIX]{x1D6FA}^{c}$, we start with the identity
 $$\begin{eqnarray}\frac{1}{x-a}=-\frac{1}{2\unicode[STIX]{x03C0}\text{i}}\int _{\unicode[STIX]{x2202}\unicode[STIX]{x1D6FA}}\frac{(y-a)^{-1}}{y-x}\,\text{d}y.\end{eqnarray}$$
Combining this identity with the Cauchy integral representation of  $v^{\prime \prime }(x)$, we have
 $$\begin{eqnarray}0=\frac{1}{2\unicode[STIX]{x03C0}\text{i}}\int _{\unicode[STIX]{x2202}\unicode[STIX]{x1D6FA}}\frac{2v^{+}(y)-2v(x)-2(y-x)v^{\prime }(x)+(y-a)^{-1}(x-a)(y-x)^{2}v^{\prime \prime }(x)}{(y-x)^{3}}.\end{eqnarray}$$
As in the interior case, the integrand is chosen so that it is bounded for all  $x\in \unicode[STIX]{x1D6FA}^{c}$. Therefore, after applying the trapezoid rule and solving for
 $v^{\prime \prime }(x)$, we have the quadrature rule for the exterior second derivative at
 $x\in \unicode[STIX]{x1D6FA}^{c}$,
 $$\begin{eqnarray}v^{\prime \prime }(x)\approx \frac{1}{x-a}\left(2\mathop{\sum }_{j=1}^{N}\frac{v_{j}^{+}-v(x)-(y_{j}-x)v^{\prime }(x)}{(y_{j}-x)^{3}}w_{j}\right)\left/\left(\mathop{\sum }_{j=1}^{N}\frac{(y_{j}-a)^{-1}}{y_{j}-x}w_{j}\right)\right..\end{eqnarray}$$
The quadrature rule for  $v^{\prime \prime }(x)$ requires
 $v(x)$ and
 $v^{\prime }(x)$, and these are computed using the quadrature rules in (5.6), (5.7), (5.9) and (5.10). These quadrature formulae are also not in a Barycentric form because of catastrophic cancellation in the numerator. As is the case when computing
 $v^{\prime }(x)$, this error is sufficiently small at the geometries and resolutions we consider, so we use these quadrature formulae.
In § 6 the quadrature rules (5.6), (5.7), (5.9), (5.10), (5.15) and (5.18) are used to form simulations of nearly touching eroding grains, and to study dynamics of the flow in regions arbitrarily close to eroding grains.
5.3 Efficiently applying the quadrature
By using these quadrature rules, the velocity, shear stress and vorticity are calculated at the target points to simulate erosion and transport. However, applied directly, it requires  $O(N^{2})$ operations, where
 $N$ is the total number of source and target points. By using a fast summation method, such as the fast multipole method (FMM) (Greengard & Rokhlin Reference Greengard and Rokhlin1987), the cost can be reduced to
 $O(N)$ operations. However, each application of the Barycentric quadrature rules involve several
 $N$-body calculations, rendering the computational cost prohibitive, so we introduce a hybrid method that combines the Barycentric quadrature rule and an accelerated trapezoid rule. Note that the source points of the layer potential are always one of the eroding bodies or the outer wall, but the target point can either be on another component of
 $\unicode[STIX]{x2202}\unicode[STIX]{x1D6FA}$ or it can be in the fluid bulk
 $\unicode[STIX]{x1D6FA}$.
To compute the velocity double-layer potential (3.1), we start by applying the trapezoid rule (5.2) accelerated with the FMM. This calculation requires  $O(N)$ operations, and we call the resulting velocity
 $\boldsymbol{v}_{trap}(\boldsymbol{x})$. Since the trapezoid rule is spectrally accurate, the error of
 $\boldsymbol{v}_{trap}(\boldsymbol{x})$ is small for points sufficiently far from
 $\unicode[STIX]{x2202}\unicode[STIX]{x1D6FA}$, and this region depends on the number of discretization points
 $N_{in}$ and
 $N_{out}$. However, the trapezoid rule needs to be replaced with a more accurate quadrature rule for points that are too close to
 $\unicode[STIX]{x2202}\unicode[STIX]{x1D6FA}$. Note that since a point is typically only close to one or two components of
 $\unicode[STIX]{x2202}\unicode[STIX]{x1D6FA}$, only the contribution of these nearby bodies needs to be replaced. Assuming that
 $\boldsymbol{x}$ is too close to
 $\unicode[STIX]{x1D6FE}_{k}$, we first subtract the inaccurate trapezoid rule approximation of the double-layer potential due to
 $\unicode[STIX]{x1D6FE}_{k}$. Then, the Barycentric quadrature rule is used to compute the velocity due to
 $\unicode[STIX]{x1D6FE}_{k}$ with more accuracy. Finally, the velocity at
 $\boldsymbol{x}$ is
 $$\begin{eqnarray}\boldsymbol{v}(\boldsymbol{x})=\boldsymbol{v}_{trap}(\boldsymbol{x})-\mathop{\sum }_{j=1}^{N_{in}}w_{j}^{k}D(\boldsymbol{x},\boldsymbol{y}_{j}^{k})\boldsymbol{\unicode[STIX]{x1D702}}(\boldsymbol{y}_{j})+\boldsymbol{v}_{bary}^{k}(\boldsymbol{x}),\end{eqnarray}$$
where  $\boldsymbol{v}_{bary}^{k}(\boldsymbol{x})$ is the velocity at
 $\boldsymbol{x}$ resulting from applying the Barycentric quadrature rule to the double-layer potential due to
 $\unicode[STIX]{x1D6FE}_{k}$. This strategy naturally extends to points that are close to
 $\unicode[STIX]{x1D6E4}$, and to points that are simultaneously close to multiple components of
 $\unicode[STIX]{x2202}\unicode[STIX]{x1D6FA}$. While the term
 $\boldsymbol{v}_{trap}(\boldsymbol{x})$ in (5.19) is computed for all target points using the FMM, the other two terms are computed with a direct summation. However, these terms are only required for target points near an eroding body or the outer wall, and these points make up only a small fraction of the total number of points.
An identical strategy is used to compute the vorticity and the deformation tensor. That is, the trapezoid rule is used as a first pass to form the vorticity and deformation tensor, and then local corrections are made to amend the inaccuracies of the trapezoid rule. However, since the shear stress and vorticity are only computed once per time step, the trapezoid rule is applied with a direct summation rather than the FMM. Relative to the cost of computing the velocity at each GMRES iteration with the FMM, the additional once-per-time-step costs to compute the vorticity and deformation tensor are minimal.
Per grid point, applying the Barycentric quadrature rules dominate the computational cost, so it is imperative that it is only applied when necessary. As a rule of thumb, the trapezoid rule due to  $\unicode[STIX]{x1D6FE}_{k}$ achieves machine epsilon accuracy if (Barnett Reference Barnett2014)
 $$\begin{eqnarray}d(\boldsymbol{x},\unicode[STIX]{x1D6FE}_{k})=\inf _{\boldsymbol{y}\in \unicode[STIX]{x1D6FE}_{k}}\Vert \boldsymbol{x}-\boldsymbol{y}\Vert >5\frac{L_{k}}{N_{in}}.\end{eqnarray}$$
The error of the Barycentric quadrature formula, trapezoid rule and other quadrature formulae can also be accurately estimated (af Klinteberg & Tornberg Reference af Klinteberg and Tornberg2017). Instead of checking if all target points  $\boldsymbol{x}$ satisfy (5.20), we first check, for all pairs of eroding grains, if
 $$\begin{eqnarray}\Vert \boldsymbol{c}_{i}-\boldsymbol{c}_{j}\Vert <\frac{L_{i}}{2\unicode[STIX]{x03C0}}+\frac{L_{j}}{2\unicode[STIX]{x03C0}}+\unicode[STIX]{x1D6FC}_{in}\left(\frac{L_{i}}{N_{in}}+\frac{L_{j}}{N_{in}}\right),\end{eqnarray}$$
where  $\boldsymbol{c}_{i}$ is the centre of grain
 $i$,
 $L_{i}$ is the length of its boundary and
 $\unicode[STIX]{x1D6FC}_{in}\geqslant 1$ is a parameter that needs to be determined. In this manner, rather than using an expensive all-to-all algorithm to compute the distance between pairs of discretization points, we compute the distance between pairs of circle centres. This criteria allows us to quickly determine bodies that contain discretization points where the Barycentric quadrature rule might need to be applied, and the parameter
 $\unicode[STIX]{x1D6FC}_{in}$ accounts for the approximation that the grains are circular. Assuming that the two bodies
 $\unicode[STIX]{x1D6FE}_{i}$ and
 $\unicode[STIX]{x1D6FE}_{j}$ satisfy condition (5.21), for each point
 $\boldsymbol{x}\in \unicode[STIX]{x1D6FE}_{j}$, we check if
 $$\begin{eqnarray}\Vert \boldsymbol{x}-\boldsymbol{c}_{i}\Vert <\frac{L_{i}}{2\unicode[STIX]{x03C0}}+\unicode[STIX]{x1D6FC}_{in}\left(\frac{L_{i}}{N_{in}}\right).\end{eqnarray}$$
To determine if points on  $\unicode[STIX]{x1D6FE}_{i}$ are too close to the outer wall, we recall that the eroding bodies are all contained in
 $[-1,1]\times [-1,1]$, so a target point can only be close to the lines
 $y=\pm 1$. Therefore, we first check if
 $$\begin{eqnarray}\left\Vert \boldsymbol{c}_{i}-\left[\begin{array}{@{}c@{}}x_{i}\\ \pm 1\end{array}\right]\right\Vert <\frac{L_{i}}{2\unicode[STIX]{x03C0}}+\unicode[STIX]{x1D6FC}_{out}\frac{L_{out}}{N_{out}},\end{eqnarray}$$
where  $x_{i}$ is the
 $x$-coordinate of
 $\boldsymbol{c}_{i}$. If body
 $\unicode[STIX]{x1D6FE}_{i}$ satisfies this condition, for each point
 $\boldsymbol{x}=(x,y)\in \unicode[STIX]{x1D6FE}_{i}$, we apply the Barycentric rule to points that satisfy
 $$\begin{eqnarray}|y\pm 1|<\frac{L_{i}}{2\unicode[STIX]{x03C0}}+\unicode[STIX]{x1D6FC}_{out}\frac{L_{out}}{N_{out}}.\end{eqnarray}$$
Finally, to determine if a target point  $\boldsymbol{x}$ in the fluid bulk requires the Barycentric quadrature rule, we only check conditions (5.22) and (5.24).
To determine appropriate values for  $\unicode[STIX]{x1D6FC}_{in}$ and
 $\unicode[STIX]{x1D6FC}_{out}$, we fixed an eroded geometry and computed an accurate solution by using the Barycentric quadrature rule for all discretization points. Then, for multiple values of
 $\unicode[STIX]{x1D6FC}_{in}$ and
 $\unicode[STIX]{x1D6FC}_{out}$, we computed the velocity field with the trapezoid rule for all points that do not satisfy conditions (5.22) and (5.24). By comparing these two velocities, we find that
 $\unicode[STIX]{x1D6FC}_{in}=4$ and
 $\unicode[STIX]{x1D6FC}_{out}=4$ give sufficient accuracy to maintain stability while keeping the number of points that require the expensive Barycentric quadrature rule to a minimum. We use these values for all of our numerical simulations.
5.4 Time integration
We use the time-stepping method outlined in our previous work (see Quaife & Moore Reference Quaife and Moore2018, § 3.3) which we briefly summarize here. The erosion rate loses differentiability if the shear stress changes sign, and this leads to corners developing on  $\unicode[STIX]{x1D6FE}$ and numerical instabilities. Therefore, we modify the erosion rate,
 $V_{\boldsymbol{n}}$ in (2.1), with
 $$\begin{eqnarray}V_{\boldsymbol{n}}=C_{E}\,|\unicode[STIX]{x1D70F}|+\unicode[STIX]{x1D716}\langle |\unicode[STIX]{x1D70F}|\rangle \left(\frac{L}{2\unicode[STIX]{x03C0}}\unicode[STIX]{x1D705}-1\right),\end{eqnarray}$$
where  $\unicode[STIX]{x1D716}\ll 1$,
 $\langle \cdot \rangle$ is the spatial average,
 $L$ is the length of
 $\unicode[STIX]{x1D6FE}$ and
 $\unicode[STIX]{x1D705}$ is the curvature of
 $\unicode[STIX]{x1D6FE}$. The new erosion model penalizes regions of high curvature, but does not change the total length of each body. Moreover, to increase the overall stability of the method, a narrow Gaussian filter is applied to the erosion rate at each time step.
Rather than tracking the  $(x,y)$ coordinates, the
 $\unicode[STIX]{x1D703}$–
 $L$ coordinates are tracked. In addition, tangential velocity fields are used to maintain an equispaced discretization. Time stepping is performed with a second-order implicit-explicit Runge–Kutta method. In particular, the diffusive term corresponding to the curvature penalization term is discretized implicitly, and all other terms, which are non-stiff, are treated explicitly. By using this time-stepping method in conjunction with the Barycentric rule, we stably evolve the eroding bodies.
To examine the tortuosity and the anomalous dispersion rates (§ 4), we require accurate streamlines governed by (1.1). If a low-order time-stepping method is used, or if  $\boldsymbol{u}(\boldsymbol{s}(t))$ is inaccurate, then a trajectory
 $\boldsymbol{s}(t)$ can unphysically enter a grain, rendering the trajectory meaningless. However, simply ignoring trajectories that pass close to a grain could significantly bias the characterization of transport. Therefore, we use high-order quadrature and time-stepping methods. In particular, depending on the proximity of
 $\boldsymbol{s}(t)$ to
 $\unicode[STIX]{x2202}\unicode[STIX]{x1D6FA}$ (§ 5.3), we apply the trapezoid rule or the Barycentric quadrature rule. For time stepping, we use a fourth-order explicit Runge–Kutta method. By using these high-order methods, we are able to simulate dynamics very close to the eroding bodies (see figures 8 and 14).
Once a collection of trajectories are formed, they are used to quantify the dispersion and the tortuosity. We use  $N_{p}=1000$ streamlines so that the statistics have converged (Bellin, Salandin & Rinaldo Reference Bellin, Salandin and Rinaldo1992). As described in § 4.1, a reinsertion method is used to compute trajectories that are sufficiently long to observe an asymptotic anomalous dispersion rate. To compute the tortuosity using (4.4), we consider trajectories crossing between the two cross-sections
 $x=-1$ and
 $x=1$, and approximate the tortuosity with
 $$\begin{eqnarray}T=\frac{1}{d}\left(\mathop{\sum }_{i=1}^{N_{p}}u_{1}(y_{i})\unicode[STIX]{x1D706}(y_{i})\unicode[STIX]{x0394}y\right)\left/\left(\mathop{\sum }_{i=1}^{N_{p}}u_{1}(y_{i})\unicode[STIX]{x0394}y\right)\right.,\end{eqnarray}$$
where  $\unicode[STIX]{x0394}y=2/(N_{p}+1)$ and
 $y_{i}=-1+i\unicode[STIX]{x0394}y$,
 $i=1,\ldots ,N_{p}$.
6 Numerical results
We now present numerical results of dense grain packings eroding in Stokes flow and analyze transport through the evolving geometries. Each body is initialized as a circle of centre  $\boldsymbol{c}_{i}$, radius
 $r_{i}$ and length
 $L_{i}=2\unicode[STIX]{x03C0}r_{i}$. The centre and radius are chosen at random, and the body is accepted if it is contained in
 $[-1,1]\times [-1,1]$ and is sufficiently separated from all other bodies. Owing to our adaptive quadrature rule, we can consider bodies that are separated by less than 10 % of an arclength spacing. The randomized method is repeated until the initial geometry reaches a desired initial porosity.
For all simulations, we discretize each eroding grain with  $N_{in}=256$ points and the outer wall
 $\unicode[STIX]{x1D6E4}$ with
 $N_{out}=1024$ points. A no-slip boundary condition is imposed on each eroding body
 $\unicode[STIX]{x1D6FE}_{i}$, and a Dirichlet boundary condition on
 $\unicode[STIX]{x1D6E4}$ is used to approximate a far-field boundary condition. For all but the first example, the Dirichlet boundary condition is a Hagen–Poiseuille flow, and the flow rate is adjusted at each time step to maintain a constant pressure drop. Since the fluid equations are linear, this is achieved by computing the pressure near the inlet and outlet at each time step, and then scaling the flow rate appropriately (Quaife & Moore Reference Quaife and Moore2018). We also compute the vorticity in the fluid bulk to help visualize the erosion rate.
The erosion rate loses regularity at stagnation points, which inevitably leads to corner formation on the bodies. As described in § 5.4 and our previous work (Quaife & Moore Reference Quaife and Moore2018), we ameliorate corner formation by introducing a curvature penalization term with parameter  $\unicode[STIX]{x1D700}$ and a Gaussian smoothing step with parameter
 $\unicode[STIX]{x1D70E}$. For all examples, we use the smoothing parameters
 $\unicode[STIX]{x1D700}=15/256$ and
 $\unicode[STIX]{x1D70E}=10/256$, and the time step size is
 $\unicode[STIX]{x0394}t=10^{-4}$.
The common characteristic of each of the numerical experiments is near-contact between the eroding bodies, outer walls and streamlines. We use our numerical methods to simulate, analyze and visualize the following examples.
(i) Single body close to a wall. We consider a single eroding body close to the outer wall at
$y=-1$. We impose a shear flow centred at $y=-1$ and compare the eroding body’s shape to a similar numerical experiment of Mitchell & Spagnolie (Reference Mitchell and Spagnolie2017).(ii) Twenty bodies at a medium porosity. We consider 20 eroding bodies with a medium initial porosity. After computing accurate streamlines, the tortuosity and anomalous dispersion rates are computed and compared to those of an open channel.
(iii) Twenty bodies at a low porosity. We consider 20 eroding bodies with a low initial porosity. We examine the effect of the lower porosity on the tortuosity and anomalous dispersion rates.
(iv) One hundred bodies at a medium porosity. We consider 100 eroding bodies with a medium porosity. We compute the tortuosity, anomalous dispersion rates and the pore throat size distributions.


6.1 A single body close to a wall
Consider a single eroding body close to a solid wall with the shear flow  $\boldsymbol{U}(\boldsymbol{x})=(y+1,0)$ imposed on
 $\unicode[STIX]{x1D6E4}$. Mitchell & Spagnolie (Reference Mitchell and Spagnolie2017) performed a similar three-dimensional numerical experiment using a second-order quadrature method. Their initial body is a sphere with its centre located
 $1.5$ radii above the solid wall. We initialize the two-dimensional eroding body with radius
 $r=0.4$, and we conduct numerical experiments where the initial distance between the grain and the solid wall is
 $h$,
 $h/2$ and
 $h/10$, where
 $h=2\unicode[STIX]{x03C0}r/N_{in}$. If we used the trapezoid rule and required an error that is comparable to the Barycentric quadrature rule, the body with an initial distance of
 $h/10$ from the solid wall would require
 $6400$ discretization points, and the outer wall would require
 $50\,000$ discretization points.
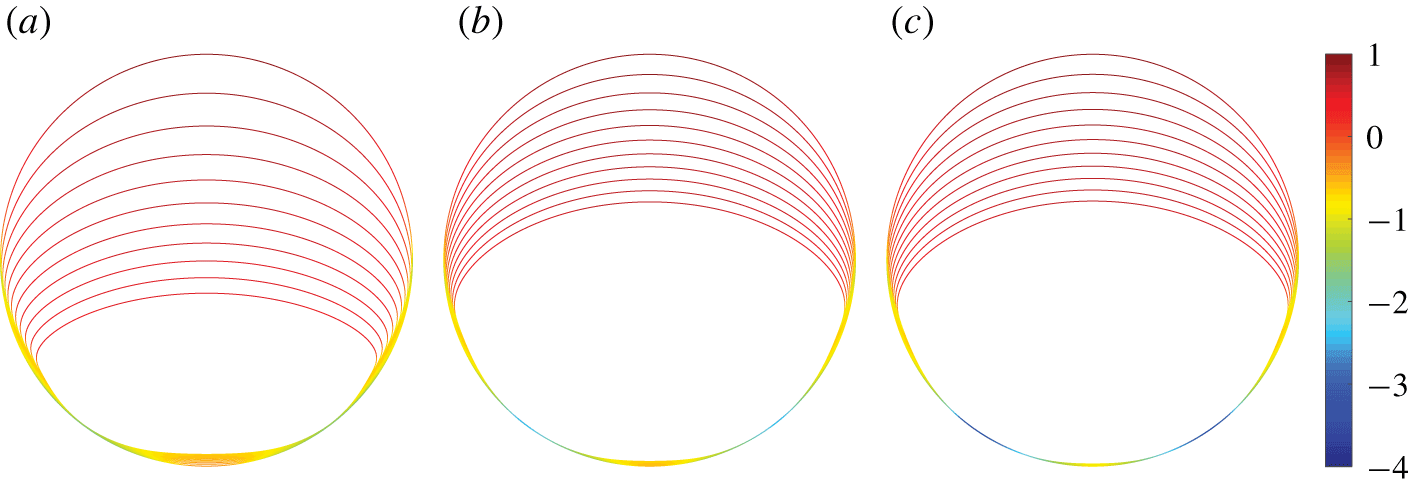
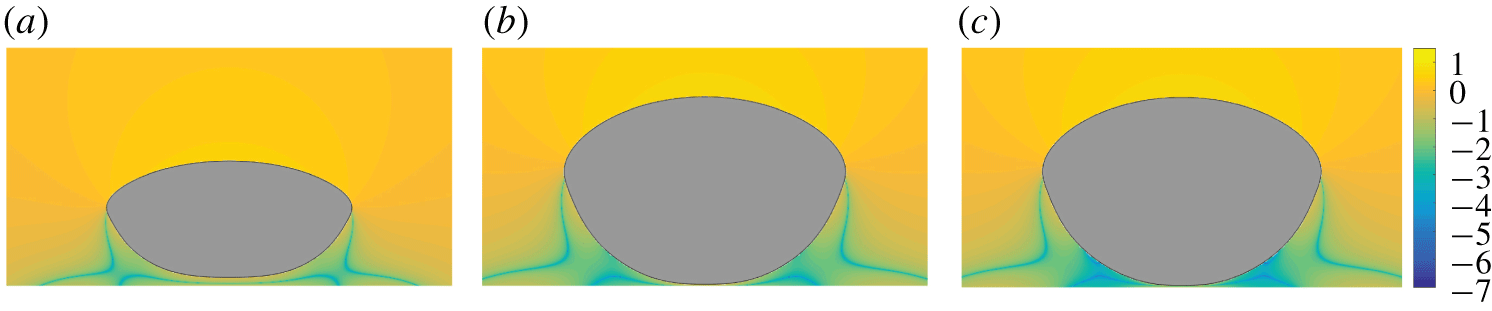
A single body eroding in a shearing Stokes flow. The colour is the logarithm of the shear stress. Therefore, erosion is fastest in the red regions (upper half) and slowest in the blue regions (lower half). The body is initialized at three different distances from the lower wall: (a)  $h$, (b)
 $h/2$ and (c)
 $h/10$.

The eroded bodies from figure 4 at time  $t=0.1$. The colour is the logarithm of the magnitude of the vorticity. The initial distances from the body to the solid wall are (a)
 $h$, (b)
 $h/2$, and (c)
 $h/10$.

In figure 4 we superimpose the eroding body’s shape at equispaced time steps. For all three initial configurations, the shear stress is positive for all time, but varies over several orders of magnitude. Therefore, we colour the eroding body’s boundary with the logarithm of the shear stress. Since the shear stress is always positive, the erosion rate is smooth and corners do not develop. However, in the top half of the body, there is a sudden increase in the shear stress, and this leads to a region of high curvature. This behaviour is also present in three dimensions (Mitchell & Spagnolie (Reference Mitchell and Spagnolie2017), see figure 7c). The biggest difference between the two- and three-dimensional results is the presence of a recirculation zone. In three dimensions, there is no recirculation between the solid wall and the spherical body (Chaoui & Feuillebois Reference Chaoui and Feuillebois2003), but recirculation is possible in two dimensions (Chwang & Wu Reference Chwang and Wu1975; Higdon Reference Higdon1985). To visualize the flow, in figure 5 we plot the logarithm of the absolute value of the vorticity from the final time step in figure 4. In these examples, a small recirculation zone, both in size and magnitude, is present in the region where the vorticity is smallest.
6.2 Twenty bodies at a medium porosity
We randomly initialize 20 eroding grains with an initial porosity of  $\unicode[STIX]{x1D719}=37.68\,\%$ and the Hagen–Poiseuille flow
 $\boldsymbol{U}(\boldsymbol{x})=U(1-y^{2},0)$ imposed on
 $\unicode[STIX]{x1D6E4}$. The flow rate
 $U$ is chosen so that the average pressure drop from
 $x=-2$ to
 $x=2$ is held fixed at 8. Therefore,
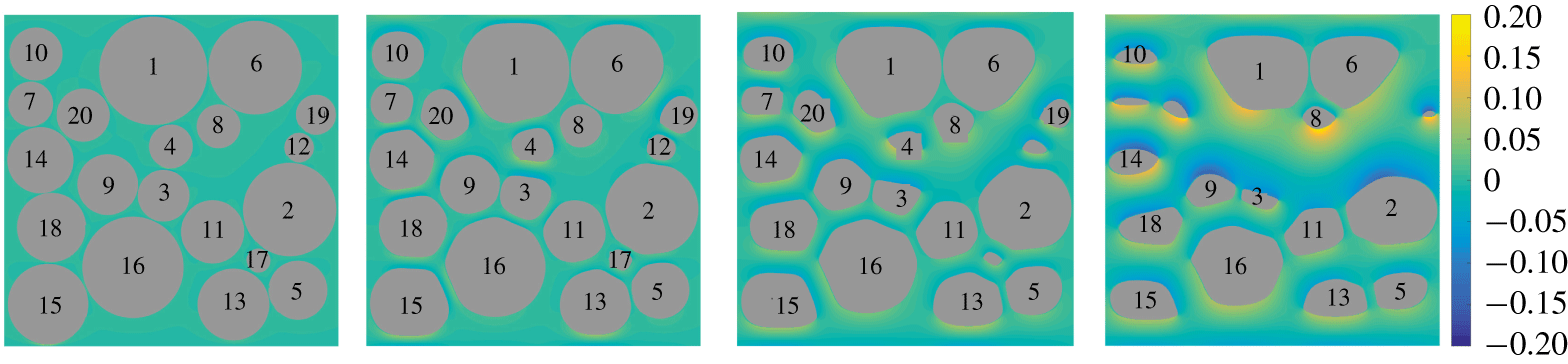
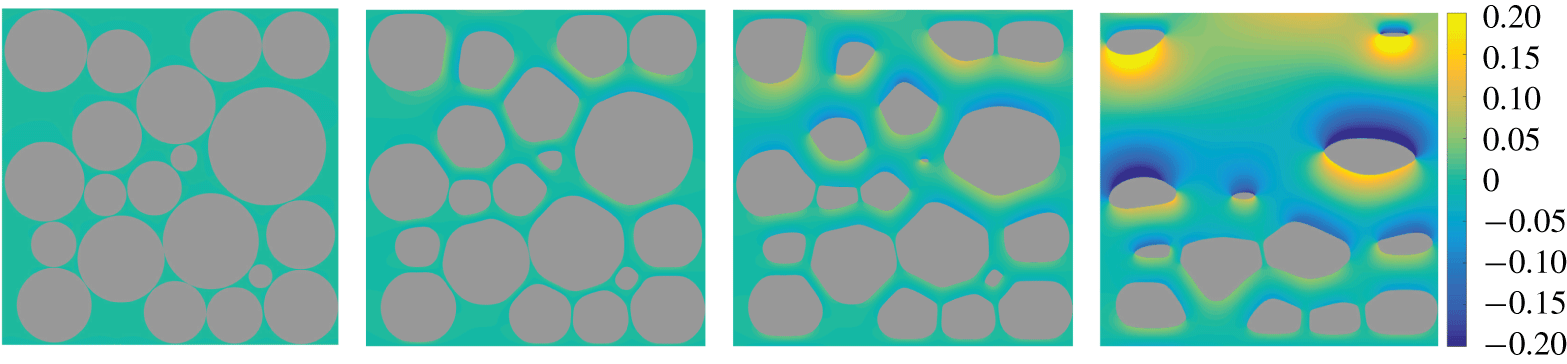
 $U=1$ once all the grains have vanished. The vorticity and grain configuration at four equispaced times are shown in figure 6. Initially, several of the grains are closer to the outer wall than the
 $5h$ threshold required for the trapezoid rule to achieve machine precision. In particular, the distance between bodies 1, 6, 13 and 15 and the outer wall is
 $1.3h$,
 $2.9h$,
 $2.8h$ and
 $1.3h$, respectively, where
 $h$ is the arclength spacing of the outer wall
 $\unicode[STIX]{x1D6E4}$. In addition, the distance between several pairs of eroding bodies, including 1 and 6, 3 and 9, 6 and 8, and 14 and 18, is too small to resolve with the trapezoid rule. By using the Barycentric quadrature rule, the interaction between these nearly touching bodies is resolved to the desired accuracy, and erosion can be simulated until all the bodies have vanished.
Twenty bodies eroding in a Hagen–Poiseuille flow. The four snapshots are equispaced in time and the colour is the fluid vorticity. In the fourth frame, bodies 4, 12 and 17 have vanished, and bodies 7, 19 and 20 have almost vanished.

Erosion causes some of the pore sizes to quickly grow, and flat faces develop along the regions of near contact. This qualitative behaviour is seen in figure 6 between bodies 3 and 4, 15 and 16, and was also observed in previous work (Quaife & Moore Reference Quaife and Moore2018). However, by resolving the interaction between bodies that are much closer together, we observe that very little erosion occurs between certain pairs of bodies, at least initially. For instance, the opening between bodies 1 and 6, 3 and 9, and 5 and 13 grow much slower than the opening between bodies 15 and 16. A common feature of the pores that grow slowly is that they are nearly perpendicular to the main flow direction, resulting in a small erosion rate.
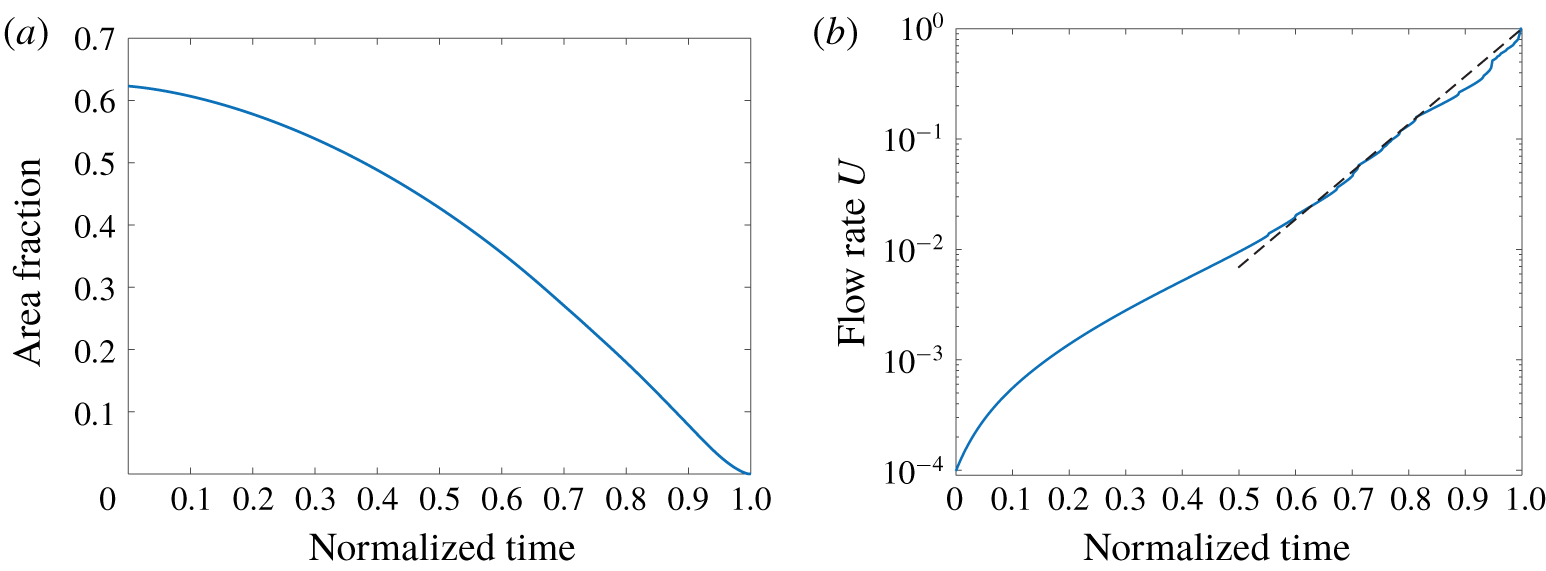
(a) The time-dependent area fraction of a geometry with 20 eroding bodies. (b) The time-dependent flow rate,  $U$, for a fixed pressure drop across the channel. The flow rate is initially small, but it eventually increases as an exponential law (dashed line) towards the maximum flow rate
 $U=1$.

In our previous work (Quaife & Moore Reference Quaife and Moore2018) we investigated the effects of erosion on the area fraction and flow rate of two different geometries. Here, we do the same analysis, but with the denser initial packing of the grains. In figure 7(a) we plot the area fraction as a function of normalized time. The general trend of the area fraction resembles our previous work (see Quaife & Moore (Reference Quaife and Moore2018), figure 10a) but with a larger initial area fraction. In figure 7(b) we plot the flow rate  $U$ required to maintain a constant pressure drop across the channel. Again, the trend of
 $U$ resembles that of our previous work (see Quaife & Moore (Reference Quaife and Moore2018), figure 10b) except that the initial flow rate is an order of magnitude smaller because of the larger initial area fraction. Starting around normalized time
 $0.2$, figure 7(b) is roughly linear which indicates that the flow rate can be written as an exponential law. The line of best fit is
 $U\approx \exp (9.94(t-t_{f})/t_{f})$, which is the dashed line in figure 7(b).
Two hundred particle trajectories in the second geometry from figure 6. The particles are initially equispaced at  $(-1,y)$, where
 $y\in (-1,1)$. The first five snapshots are equispaced in time. The bottom right frame is a magnification of the fifth snapshot, but with additional trajectories.

In figure 6 we observe that erosion creates a network of channels from the inlet to the outlet where the velocity and vorticity, and therefore erosion rate, are much larger relative to other regions. These channels can be further visualized with particle trajectories that trace out the streamlines. In figure 8 we freeze the geometry at the second snapshot from figure 6 and plot 200 trajectories that are initially equispaced along  $(-1,y)$, where
 $y\in (-1,1)$. The trajectories are shown at five different times, and the final plot is a zoom in of the lower right quadrant of the fifth time step, but with additional trajectories. Since we use a high-order quadrature rule and time-stepping method, we resolve the dynamics very close to the eroded bodies. There are three clear regions where the streamlines are most concentrated, corresponding to the regions of highest velocity. Two of these regions are located between the bodies and the solid walls at
 $y=\pm 1$, and the third cuts through the porous region with the upper part of the channel formed by bodies 1, 4, 6 and 8. Since the flow is fastest in these regions, the shearing is largest, and this causes the channels to continue to open fastest as observed in figure 6.
Next, we use the  $N_{p}=1000$ (Bellin et al. Reference Bellin, Salandin and Rinaldo1992) streamlines to compute the tortuosity of the eroding geometry. To compute the tortuosity, we require the velocity at the inlet
 $x=-1$. These normalized velocities are plotted in figure 9(a) for the eroded geometry at porosity
 $\unicode[STIX]{x1D719}=62.9\,\%$ (figure 9c). The velocities are similar to those of Matyka et al. (Reference Matyka, Khalili and Koza2008, see figure 4a), except that our cross-section, by construction, does not cut through any of the grains. Next, in figure 9(b) we plot the local tortuosity (4.3) by calculating the relative length of each streamline as it traverses the channel from
 $x=-1$ to
 $x=1$. The local tortuosity ranges from 1 to 1.27, meaning that one of the streamlines is 27 % longer than it would have been if the grains were absent. The average streamline is 9.79 % longer or, equivalently, the tortuosity of the geometry is
 $1.098$. Again, comparing the local tortuosity to Matyka et al. (Reference Matyka, Khalili and Koza2008, see figure 4b), the results are qualitatively similar. However, since our initial cross-section does not cut through the grains, the local tortuosity does not have any gaps. Discontinuities in local tortuosity occur when nearby streamlines diverge to circumvent a grain. In figure 9(c) we plot pairs of streamlines associated with the ten largest jumps in the local tortuosity, with each pair of corresponding streamlines plotted in the same colour.
The local tortuosity of a porous geometry initialized with 20 grains after eroding to a porosity of 62.9 %. (a) The  $x$-component of the velocity at the inlet,
 $u_{1}(-1,y)$, normalized by its maximum velocity of
 $2.98\times 10^{-3}$. (b) The local tortuosity
 $\unicode[STIX]{x1D70F}(y)$ on the cross-section
 $x=-1$. (c) The streamlines resulting in the ten largest differences of local tortuosity between neighbouring streamlines. Neighbouring streamlines have the same colour.

In figure 10(a) we plot the tortuosity as a function of the porosity. The initial porosity is  $\unicode[STIX]{x1D719}=37.68\,\%$ and the initial tortuosity is
 $T=1.16$. The tortuosity is computed with both the length of the streamlines (4.4) (red stars) and using the spatial average of the velocity on an Eulerian grid (4.5) (blue marks). The red square corresponds to the porosity of the geometry in figure 9(c). The two tortuosity formulae give similar results, and any discrepancy can be accounted for by slow regions of recirculation and from quadrature error incurred when computing the tortuosity. As the bodies erode, wide channels form where streamlines undergo only minor vertical deflections, and this explains why the tortuosity eventually decreases with porosity. We computed lines of best fit using the porosity-tortuosity models (4.6) and the power law (4.6a) minimizes the error. The black dashed line in figure 10(a) is the line of best fit
 $\widehat{T}(\unicode[STIX]{x1D719})=\unicode[STIX]{x1D719}^{-0.2064}$ with a root-mean-square error of
 $5.90\times 10^{-3}$. A slightly larger root-mean-square error of
 $6.70\times 10^{-3}$ is possible with the logarithmic porosity-tortuosity model (4.6b), but the other two models have a root-mean-square error that is an order of magnitude larger. Interestingly, at the low porosities, the tortuosity initially increases. This increase occurs because in the absence of erosion (left plot in figure 6) many of the streamlines, such as those initialized between bodies 15 and 18, only perform minor deflections to pass through the narrow regions, albeit, very slowly. However, as erosion starts to open the channels, the streamlines deflect into the fast regions, such as the region above body 11, and this increases the amount of vertical deflection and, therefore, the tortuosity. While this increase in tortuosity is interesting, in the next two examples we will see that the tortuosity does not initially increase.
We next use streamlines to investigate the temporal evolution of the particle spreading  $\unicode[STIX]{x1D70E}_{\unicode[STIX]{x1D706}}$. The spreading is computed for seven geometries of different porosities that are formed during the erosion process (figure 10b). So that the spreading reaches a statistical equilibrium, we use the reinsertion algorithm described in § 4.1 to form sufficiently long trajectories. For all the reported porosities, the particle dispersion exhibits two distinct power law regimes. Initially, the dispersion is ballistic (
 $\unicode[STIX]{x1D70E}_{\unicode[STIX]{x1D706}}\sim t$) since individual fluid particles have not yet explored enough space to significantly alter their velocity. However, once the particles have been subjected to a range of velocities their dispersion slows, and we observe super-dispersive (
 $\unicode[STIX]{x1D70E}_{\unicode[STIX]{x1D706}}\sim t^{\unicode[STIX]{x1D6FC}}$,
 $\unicode[STIX]{x1D6FC}\in (1/2,1)$) behaviour over at least one order of magnitude in time. Before any erosion takes place, the anomalous dispersion coefficient is
 $\unicode[STIX]{x1D6FC}=0.56$. Then, as the grains begin to erode, the dispersion rate grows towards the ballistic regime that occurs in the absence of grains. The monotonic increase in dispersion with respect to the porosity is explained by the onset of channels where many tracers experience less variability in their velocities.
(a) The tortuosity of an eroding geometry initialized with 20 grains. The tortuosity is calculated using the Eulerian method (4.5) (blue dots) and Lagrangian method (4.4) (red stars). The red square corresponds to the geometry in figure 9(c). The dashed line is the line of best fit  $\widehat{T}(\unicode[STIX]{x1D719})=\unicode[STIX]{x1D719}^{-p}$ with
 $p=0.2064$. (b) The temporal evolution of
 $\unicode[STIX]{x1D70E}_{\unicode[STIX]{x1D706}}$ at seven porosities. The dashed line has slope one and corresponds to ballistic dispersion. Asymptotically, the spreading is super-dispersive with
 $\unicode[STIX]{x1D70E}_{\unicode[STIX]{x1D706}}\sim t^{\unicode[STIX]{x1D6FC}}$,
 $\unicode[STIX]{x1D6FC}\in (1/2,1)$. The dashed–dotted lines of best fit have slopes
 $\unicode[STIX]{x1D6FC}=1.06\,(\unicode[STIX]{x1D719}=95.10\,\%)$,
 $\unicode[STIX]{x1D6FC}=1.07\,(\unicode[STIX]{x1D719}=85.09\,\%)$,
 $\unicode[STIX]{x1D6FC}=1.06\,(\unicode[STIX]{x1D719}=75.15\,\%)$,
 $\unicode[STIX]{x1D6FC}=0.97\,(\unicode[STIX]{x1D719}=65.09\,\%)$,
 $\unicode[STIX]{x1D6FC}=0.78\,(\unicode[STIX]{x1D719}=55.10\,\%)$,
 $\unicode[STIX]{x1D6FC}=0.75\,(\unicode[STIX]{x1D719}=45.08\,\%)$ and
 $\unicode[STIX]{x1D6FC}=0.56\,(\unicode[STIX]{x1D719}=37.68\,\%)$. Values greater than 1 result from using a least-squares fit for the tails of the particle spreading.

6.3 Twenty bodies at a low porosity
We consider a second example with 20 randomly initialized eroding bodies, but with a smaller initial porosity of  $\unicode[STIX]{x1D719}=30.67\,\%$. In figure 11 we plot the eroding geometry and vorticity at four evenly spaced instances in time. Initially, the smallest distance between pairs of bodies is
 $3.29\times 10^{-4}$, and the smallest distance between the bodies and solid wall is
 $4.50\times 10^{-3}$. At these distances, a resolution of approximately
 $N_{in}=27\,000$ and
 $N_{out}=18\,000$ discretization points is required to satisfy the
 $5h$ threshold needed for the trapezoid rule to achieve machine precision.
Twenty bodies eroding in a Hagen–Poiseuille flow. The snapshots are equispaced in time and the colour is the fluid vorticity. In addition to the channels that develop between the bodies and the solid walls, erosion leads to two main channels through the geometry – one in the top half and one near the middle.

We compute the tortuosity using the Eulerian method (4.5) at each time step. The initial porosity is  $\unicode[STIX]{x1D719}=30.67\,\%$ and the initial tortuosity is
 $T=1.24$. In figure 12(a) we plot the tortuosity with respect to the porosity (blue) and the line of best fit (black) using the power law
 $\widehat{T}(\unicode[STIX]{x1D719})=\unicode[STIX]{x1D719}^{-0.1669}$. This model outperforms the other three models in (4.6), and its root-mean-squared error is
 $1.13\times 10^{-2}$. However, the root-mean-square error of the other three models is bounded by
 $2.38\times 10^{-2}$. As grains erode, there is an increase in the number of streamlines that take a nearly direct path through the geometry, and this decreases the tortuosity. However, the channelization effect of erosion results in an increase in the tortuosity since the length of many of the streamlines increases when they deflect from a high porosity region (low pressure) to a low porosity region (high pressure). For this example, we see that the net effect is a decrease in the tortuosity for all time.
(a) The tortuosity of an eroding geometry initialized with 20 grains. When compared to the last example, the bodies are initially much closer together, and the porosity is smaller. The dashed line is the line of best fit  $\widehat{T}(\unicode[STIX]{x1D719})=\unicode[STIX]{x1D719}^{-p}$ with
 $p=0.1669$. (b) The temporal evolution of
 $\unicode[STIX]{x1D70E}_{\unicode[STIX]{x1D706}}$ at eight porosities. The dashed line has slope one and corresponds to ballistic motion. Asymptotically, the spreading is super-dispersive with
 $\unicode[STIX]{x1D70E}_{\unicode[STIX]{x1D706}}\sim t^{\unicode[STIX]{x1D6FC}}$,
 $\unicode[STIX]{x1D6FC}\in (1/2,1)$. The dashed–dotted lines of best fit have slopes
 $0.92\,(\unicode[STIX]{x1D719}=95.00\,\%)$,
 $0.87\,(\unicode[STIX]{x1D719}=85.17\,\%)$,
 $0.87\,(\unicode[STIX]{x1D719}=75.10\,\%)$,
 $0.91\,(\unicode[STIX]{x1D719}=65.02\,\%)$,
 $0.91\,(\unicode[STIX]{x1D719}=55.08\,\%)$,
 $0.72\,(\unicode[STIX]{x1D719}=45.03\,\%)$,
 $0.69\,(\unicode[STIX]{x1D719}=35.05\,\%)$ and
 $0.92\,(\unicode[STIX]{x1D719}=30.67\,\%)$.

In figure 12(b) we plot the temporal evolution of the particle spreading  $\unicode[STIX]{x1D70E}_{\unicode[STIX]{x1D706}}$. As in the last example, we analyze the spreading at several different porosities and we use the reinsertion algorithm described in § 4.1. For all the porosities, the dispersion is much closer to ballistic when compared to the results in figure 10. However, there are still clear transitions from ballistic dynamics to asymptotic super-dispersive spreading. In contrast to the higher porosity initial condition (§ 6.2), at early times the erosion results in a decrease in the dispersion rate. In particular, after the first 5 % of the bodies have eroded, the particle spreading transitions from
 $\unicode[STIX]{x1D70E}_{\unicode[STIX]{x1D706}}\sim t^{0.92}$ to
 $\unicode[STIX]{x1D70E}_{\unicode[STIX]{x1D706}}\sim t^{0.69}$. To explain this behaviour, recall that anomalous dispersion is caused by tracers spending time in both the fast and slow regimes. Since the initial configuration has a reasonably uniform velocity (see figure 11), albeit a small one, the dispersion is nearly ballistic. However, as the geometry erodes, the flow becomes more intermittent, and this results in an increased anomalous dispersion rate (de Anna et al. Reference de Anna, Borgne, Dentz, Tartakovsky, Bolster and Davy2013). Then, as the bodies continue to erode, the geometry channelizes, and most tracers are transported with a large velocity through the channels, again resulting in a nearly ballistic motion (Siena et al. Reference Siena, Ilievand, Prill, Riva and Guadagnini2019).
The erosion of 100 nearly touching grains in a Hagen–Poiseuille flow. The four snapshots are evenly spaced in time, and the colour is the fluid vorticity. Because of the large number of bodies, erosion creates many channels connecting the inlet to the outlet.

The local tortuosity of a porous geometry initialized with 100 grains after eroding to a porosity of 62.98 %. (a) The  $x$-component of the velocity at the inlet,
 $u_{1}(-1,y)$, normalized by its maximum velocity
 $u_{max}=3.90\times 10^{-4}$. Note that this maximum velocity is about an order of magnitude smaller than the 20 body example in figure 9. (b) The local tortuosity
 $\unicode[STIX]{x1D70F}(y)$ on the cross-section
 $x=-1$. Compared to figure 9, this example has more small bodies, and this results in more discontinuities in the local tortuosity. (c) The trajectories of 200 tracers initialized at
 $x=-1$.

6.4 One hundred eroding bodies
As a final example, we consider 100 randomly initialized eroding bodies with an initial porosity near  $50\,\%$. Snapshots of the configurations and vorticity are in figure 13. We compute the tortuosity using both the Lagrangian (4.4) and Eulerian methods (4.5). Therefore, we compute and plot the normalized velocity at
 $N_{p}=1000$ points along the inlet
 $x=-1$ in figure 14(a) for the eroded geometry at porosity
 $\unicode[STIX]{x1D719}=62.98\,\%$ (figure 14c). The initial velocity of the tracers is qualitatively similar to the 20 body example (figure 9a), except with additional oscillations because of the additional grains. In figure 14(b) we plot the local tortuosity by finding the length of the streamlines as they pass from
 $x=-1$ to
 $x=1$. Compared to figure 9(b), the local tortuosity is much more discontinuous. These discontinuities can be explained by examining the trajectories of tracers in figure 14(c). Here, there are many instances of nearby streamlines that are deflected apart from one another as they tend to a stagnation point in the flow, and this results in trajectories with significantly different lengths. At this porosity, one of the tracers travels 25.5 % farther than it would have if the bodies had been absent, and the average tracer travelled 12 % farther resulting in a tortuosity of
 $T=1.12$.
(a) The tortuosity of an eroding geometry initialized with 100 grains. The tortuosity is calculated using the Eulerian method (4.5) (blue dots) and Lagrangian method (4.4) (red stars). The dashed line is the line of best fit  $\widehat{T}(\unicode[STIX]{x1D719})=\unicode[STIX]{x1D719}^{-p}$ with
 $p=0.2459$. (b) The temporal evolution of
 $\unicode[STIX]{x1D70E}_{\unicode[STIX]{x1D706}}$ at six porosities. The dashed line has slope one and corresponds to ballistic dispersion. Asymptotically, the spreading becomes super-dispersive with
 $\unicode[STIX]{x1D70E}_{\unicode[STIX]{x1D706}}\sim t^{\unicode[STIX]{x1D6FC}}$,
 $\unicode[STIX]{x1D6FC}\in (1/2,1)$. The dashed–dotted lines of best fit have slopes
 $1.11\,(\unicode[STIX]{x1D719}=95.12\,\%)$,
 $0.68\,(\unicode[STIX]{x1D719}=85.07\,\%)$,
 $0.73\,(\unicode[STIX]{x1D719}=75.14\,\%)$,
 $0.59\,(\unicode[STIX]{x1D719}=65.03\,\%)$,
 $0.61\,(\unicode[STIX]{x1D719}=55.02\,\%)$ and
 $0.70\,(\unicode[STIX]{x1D719}=50.09\,\%)$.

In figure 15(a) we plot the tortuosity as a function of the porosity. The initial geometry has a porosity of  $\unicode[STIX]{x1D719}=50.09\,\%$ and the tortuosity is
 $T=1.20$. The tortuosity is computed with both the length of the streamlines (4.4) (red stars) and using the spatial average of the velocity on an Eulerian grid (4.5) (blue marks). The red square corresponds to the porosity of the geometry in figure 14(c). Again, the two tortuosity formulae give similar results. For this geometry, the tortuosity decreases monotonically at almost all porosities. However, the tortuosity slightly increases near the end of the simulation. This increase is caused when a grain located at the start of a region with large local tortuosity completely erodes. In this region, once the grain vanishes, the large local tortuosity changes slightly, but the inlet velocity,
 $u_{1}(y)$, relative to the inlet velocity in the remainder of the channel, increases sharply. The result is a sudden increase in the average local tortuosity when weighted by the initial velocity, and this increases the tortuosity of the geometry. We compute the lines of best fit using the porosity-tortuosity models (4.6). The models result in a root-mean-squared error ranging from
 $4.60\times 10^{-3}$ for model (4.6d) to
 $7.20\times 10^{-3}$ for model (4.6c). The black dashed line in figure 15(a) is the line of best fit
 $\widehat{T}(\unicode[STIX]{x1D719})=\unicode[STIX]{x1D719}^{-0.2459}$, with a root-mean-square error of
 $5.50\times 10^{-3}$. We note a slightly better root-mean-square error of
 $4.60\times 10^{-3}$ is possible with the model
 $\widehat{T}(\unicode[STIX]{x1D719})=(1+0.1499(1-\unicode[STIX]{x1D719}))^{2}$.
In figure 15(b) we plot the temporal evolution of the particle spreading  $\unicode[STIX]{x1D70E}_{\unicode[STIX]{x1D706}}$ at six different porosities. Again, we initially observe ballistic motion (black dashed line), and then super-dispersion. Similar to the example in figure 12(b), the asymptotic anomalous dispersion rate is not growing with the porosity. Therefore, it appears that the dispersion rate in an eroding geometry depends not only the porosity but also the location and shape of the bodies. Finally, at the highest porosity, anomalous dispersion is only observed briefly in the time interval
 $(0.5,1)$, and then transitions back to a ballistic regime. Since the bodies are so small at this high porosity, after reinsertion, the streamline is not significantly deflected by any of the bodies, and this results in a ballistic regime.
The pore sizes of 100 eroding bodies at six porosities. The black curves are Weibull distributions whose first and second moments agree with the data. The porosities and Weibull distribution parameters  $(k,\unicode[STIX]{x1D706})$ at each of the porosities are (a)
 $\unicode[STIX]{x1D719}=50.09\,\%$ and
 $(k,\unicode[STIX]{x1D706})=(1.4650,0.0605)$; (b)
 $\unicode[STIX]{x1D719}=55.02\,\%$ and
 $(k,\unicode[STIX]{x1D706})=(1.9485,0.0737)$; (c)
 $\unicode[STIX]{x1D719}=65.03\,\%$ and
 $(k,\unicode[STIX]{x1D706})=(2.5682,0.0965)$; (d)
 $\unicode[STIX]{x1D719}=75.14\,\%$ and
 $(k,\unicode[STIX]{x1D706})=(2.7771,0.1255)$; (e)
 $\unicode[STIX]{x1D719}=85.07\,\%$ and
 $(k,\unicode[STIX]{x1D706})=(2.6235,0.1713)$; (f)
 $\unicode[STIX]{x1D719}=95.12\,\%$ and
 $(k,\unicode[STIX]{x1D706})=(1.9840,0.3194)$.

Finally, we investigate the effect of erosion on pore sizes. The distribution of the pore sizes is directly related to the distribution of the velocity, and thus effects the tortuosity (Dentz et al. Reference Dentz, Icardi and Hidalgo2018) and anomalous dispersion (de Anna et al. Reference de Anna, Quaife, Biros and Juanes2018). In addition, the pore sizes are used in network models (Bryant et al. Reference Bryant, King and Mellor1993a,Reference Bryant, Mellor and Cadeb). As described in § 4.3, we use a Delaunay triangulation to define neighbouring eroding bodies, and we compute the pore size by finding the closest distance between all neighbouring bodies. Instead of computing the Delaunay configuration at each time step, which would result in new definitions for the pores at each time step, we only compute a new Delaunay triangulation when a grain completely erodes. Once all pore sizes are computed, we analyze their distribution as a function of the porosity.
In figure 16 we plot histograms of the pore sizes at six porosities throughout the erosion process. We superimpose the Weibull distribution (Ioannidis & Chatzis Reference Ioannidis and Chatzis1993) with the same first two moments as the data. The parameters of the distribution,  $(k,\unicode[STIX]{x1D706})$, are included in the caption of figure 16. In figure 17 we plot the mean and variance of the pore sizes as a function of the porosity. Interestingly, for porosities less than
 $\unicode[STIX]{x1D719}=85\,\%$, the mean pore size grows linearly and the variance remains nearly flat. Since a channelized geometry has large variance, this indicates that channelization is less prevalent at low porosities.
The effect of erosion on (a) the mean and (b) the variance of the pore sizes. The geometry initially contains 100 eroding bodies. The distributions of the pore sizes in figure 16 are indicated by the red stars.

7 Conclusions
As a continuation of our previous work (Quaife & Moore Reference Quaife and Moore2018), we have simulated dense suspensions and characterized transport in viscous eroding porous media. This is accomplished by using high-order time-stepping methods and a combination of trapezoid and Barycentric quadrature methods to solve a BIE formulation of the Stokes equations. By using these numerical methods, we are able to perform stable simulations of erosion with  $N=O(100)$ discretization points, while the trapezoid rule would require
 $O(10^{5})$ discretization points.
The transport is characterized in terms of tortuosity and anomalous dispersion. While the local tortuosity agrees qualitatively with other works (Matyka et al. Reference Matyka, Khalili and Koza2008), the tortuosity of eroded geometries cannot be completely described in terms of the porosity. In particular, we observe that, for certain configurations, the tortuosity transiently increases, even though the porosity always increases due to erosion. We also observe super-dispersive spreading, and the rate of dispersion significantly depends not only on the porosity but also the number of eroding bodies and their distribution.
To further our understanding of erosion, we are examining other bulk and statistical properties of eroding porous media. In this work, we provide results for the pore throat sizes which affect the anomalous dispersion rate (de Anna et al. Reference de Anna, Quaife, Biros and Juanes2018). At a later date, we will report results on the development of anisotropic effects and the distributions of grain sizes, shapes and opening angles.
As a long term goal, we plan to include the inertial effects and other transport models. Including inertia requires an integral equation formulation of the Navier–Stokes equations, which is an active area of research with promising directions recently proposed (Gray et al. Reference Gray, Jakowski, Moore and Ye2019; af Klinteberg, Askham & Kropinski Reference af Klinteberg, Askham and Kropinski2020). Regarding other transport models, this would involve a diffusive term to consider the transport of heat or a contaminant. Forming high-fidelity simulations of such an advection-diffusion equation can be accomplished by using time-splitting methods and recent work on heat solvers in complex geometries (Fryklund, Kropinski & Tornberg Reference Fryklund, Kropinski and Tornberg2019).
Acknowledgements
B.Q. and M.N.J.M. were supported by Florida State University startup funds and Simons Foundation Mathematics and Physical Sciences-Collaboration Grants for Mathematicians 527139 and 524259.
Declaration of interests
The authors report no conflict of interest.