

Examining historical and geographic patterns of divided US Senate delegations (i.e., states whose two senators are of different parties) is a useful route to testing competing models of American politics. The fact that two senators are elected from each state offers the potential for natural paired comparisons. Several authors have taken advantage of the fact that elections for two senators from a given state reflect similar electorates and identical state characteristics and offices by comparing their characteristics and behavior as a function of their party. Some authors (e.g., Schiller Reference Schiller2000) examined differences in the geographic distribution of vote support for US senators within the same state, especially for candidates of the same party. She found that geographic-support-base differentiation between candidates of the same party can be linked to differences in issue emphasis and local appeal.Footnote 1 Other scholars emphasized more what can be learned by comparing senators of opposite parties. For example, Poole and Rosenthal (Reference Poole and Rosenthal1984) and Grofman, Griffin, and Glazer (Reference Grofman, Griffin, Glazer, Johnston, Shelley and Taylor1990) investigated how legislative voting is affected by the party of the senator. That is, do senators of opposite parties vote differently, and how has the magnitude of those differences changed over time?
Brunell and Grofman (Reference Brunell and Grofman1998) also relied on longitudinal comparisons, but we used them to indirectly test theories of realignment. We hypothesized that, within any given state, a divided Senate delegation is a temporary phenomenon—an interim pattern until an ongoing realignment can fully reorient state politics in a new direction. For instance, if a state is realigning from Republican to Democratic, the Senate delegation necessarily will go through a period with a divided delegation (i.e., RR to DR to DD). Looking at the nation as a whole, we were led to expect a cyclical pattern such that a long-term rise in the number of divided Senate delegations can be considered a sign that a realignment is in progress; the same is true for a long-term decline in the number of divided Senate delegations. When we find a clear inflection point in the data, it signals a realignment that has reached either its peak or its trough.
It is important to note that, implicitly, Brunell and Grofman made use of a definition of realignment that is different from that in most of the literature. Although there have been multiple approaches to defining realignment (see, e.g., a review in Merrill, Grofman, and Brunell Reference Merrill, Grofman and Brunell2008), the most common is one that considers realignment as an overall change in which party is dominant at the national level. In contrast, in Brunell and Grofman’s approach, realignments can move in opposite directions in different regions. This way of approaching realignment allows the identification of the existence of a Reagan realignment the presence of which is missed by other approaches.
Brunell and Grofman (Reference Brunell and Grofman1998) examined data on divided US Senate delegations at the state level in the period 1788–1996 and found support for cyclical patterns that can be linked to realignment in earlier periods, with inflection points that correspond reasonably closely to years identified as critical elections. Based on our realignment model, we predicted that the number of divided Senate delegations at the state level would decline after 1996 because we conjectured that there had been a realignment cusp around 1980.Footnote 2 We concluded our 1998 article with a bold prediction: “Our model predicts a future decline in the number of divided Senate delegations” (Brunell and Grofman Reference Brunell and Grofman1998, 399).
We tested this prediction with data from 1952–2016 and found strong confirmation—once we recognized that (1) a perfectly monotonic pattern is not to be expected given the potential for idiosyncratic elections features (tied to candidates or to exogenous events) to temporarily divert the course of electoral tides; and (2) there are limits to the number of divided delegations possible so that some trends will flatten out before reversing. In contrast, as discussed herein, other models of contemporary US politics do not have this cyclic nature to their predictions.Footnote 3 Most commonly, they make no clear prediction as to expected change because they see election outcomes as tied to more idiosyncratic features of the election environment (e.g., candidate characteristics) or factors that can be treated as exogenous (e.g., changes in economic circumstances).Footnote 4
We tested this prediction with data from 1952–2016 and found strong confirmation—once we recognized that (1) a perfectly monotonic pattern is not to be expected given the potential for idiosyncratic elections features (tied to candidates or to exogenous events) to temporarily divert the course of electoral tides; and (2) there are limits to the number of divided delegations possible so that some trends will flatten out before reversing.
EXPLAINING ELECTION OUTCOMES
Consider explanations of voter choices as making use of six broad categories of factors: candidate characteristics (e.g., experience, gender, and race), candidate platform and ideology, nature of the campaign, party loyalties, electoral rules, and context. Each factor can be used to generate circumstances in which split-ticket voting patterns may be expected at the individual level that might translate into split outcomes across adjacent pairs of Senate elections.Footnote 5
For example, theories of candidate-centered voting (Wattenberg Reference Wattenberg1991; Reference Wattenberg1996) argued that parties now matter less and candidates matter more. Thus, knowing which party’s candidate holds the other Senate seat will not be predictive for an election involving different senatorial candidates. A well-funded candidate who runs a good campaign can win.
Candidate-centric explanations might seem especially important for the Senate as compared to the House because Senate elections generally are won by closer margins. For instance, in 2016, only 33 of 435 House seats were won with a margin of less than 10% and only 19 with a margin of 5% or less. In contrast, in the Senate, there were nine races decided by 10% or less, six of which were decided by less than 5%. These races comprised more than 25% of all Senate elections in 2016.
Contextual factors that have been used to explain changes in voter choices are the state of the economy (i.e., inflation, unemployment, and economic growth) and/or the state of the voter’s own economic well-being. Again, if the economy (or prognoses about it) changes, then the result might be a pattern of split outcomes between the two Senate seats.
Another important contextual feature of voter choice is captured in the strategic-balancing model of Fiorina (Reference Fiorina1996) and Alesina and Rosenthal (Reference Alesina and Rosenthal1995). This model emphasizes the contextual nature of choices such that voters decide how to vote in a given contest based on what they know (or expect) about other election outcomes rather than making decisions in a given election contest based only on the candidates, campaigns, and platforms. For example, more moderate voters might choose to “tilt” away from a candidate of a given party for a given office if that candidate’s party was already dominant in the legislature as a whole or held control of the presidency or governorship. By balancing in this way, voters might seek to move politics in a more moderate direction—and they might do so even if it means choosing a candidate who is ideologically farther away than the candidate of the in-party.
Grofman et al. (Reference Grofman, Koetzle, McDonald and Brunell2000) demonstrate that voters are able to vote split tickets sincerely (i.e. each of the candidates is closest to the voter ideologically) because of regional variation in the ideological location of congressional candidates. So a moderate voter can be nearer the Democratic presidential candidate and the Republican congressional candidate simultaneously.
Donnelly (Reference Donnelly2015) used survey data to better understand the factors affecting individual vote choice for pairs of senators. He found no evidence for policy balancing; rather, he found proximity voting, candidate-centered politics, and idiosyncratic factors to be the underlying causes of split Senate delegations. Clearly, changing economic circumstances, differences in candidate matchups, and policy balancing across the set of two US senators are all potential ways to explain divided Senate delegations. Moreover, other election-specific factors (e.g., corruption scandals) also can be used to explain Senate election outcomes. We also have short-term tides, such as presidential “coattail” effects or those that result from the withdrawal of presidential coattails. If a US Senate candidate wins (or retains) office in a presidential election year when a president of the candidate’s own party is successful, then—in a succeeding (non-presidential) election year in which the electoral tides are not running so strongly in the party’s favor (or are running in the opposite direction)—there may a change in party control. Short-term forces linked to presidential elections sometimes help and sometimes hurt a given party, leading to the potential for divided Senate delegations. However, these factors, unlike the (regional) realignment model of Brunell and Grofman (Reference Brunell and Grofman1998), do not lead us to expect cyclical patterns.
A REAGAN REALIGNMENT?
In predicting a further long-term decline in the number of divided Senate delegations from what was observed in 1996, Brunell and Grofman (Reference Brunell and Grofman1998) were positing a “new” realignment, one that we identified as beginning around 1980.
Although Brunell and Grofman (Reference Brunell and Grofman1998) did not emphasize this point, indirectly identifying realignment eras by looking at trends in divided Senate delegations, we believe, is preferable to simply defining realignment as a change in which party is in the ascendance. This is because the number of divided delegations can fall when either realigning trends are moving in sync in all states or realignment is operating differently in different regions of the country (e.g., the South becoming more Republican and the Northeast becoming more Democratic). In particular, as noted previously, this way of thinking about realignment can result in different conclusions about when realignments occurred than methods that insist that it is changes in overall party dominance that define realignment—which is the mainstream approach to realignment.
Realigning trends will not always move in the same way in all states, and we believe that any theory of realignment must consider this fact. Examining the partisan directionality of change in the unified Senate delegations by region, we show that this pattern of differential realignment is, indeed, a sensible way to think about realignment.Footnote 6 Moreover, a model tying changes in the number of divided Senate delegations to ongoing regional realignments is the only theory of which we are aware that makes sense of the recent increase in the number of unified delegations and the long-run cyclical patterns.
Furthermore, this model of realignment is not rejected by observations of an alternation of Democratic and Republican victories at the presidential level since 1980 because it focuses on the state-specific and regional nature of divided Senate delegations. Electoral trends may be moving in opposite directions in different regions so that this model is compatible with the country as a whole being closely divided, leading to an alternation in which party wins the presidency. Presidential elections may end in an almost coin-toss fashion, depending on various election-specific features.
However, although Brunell and Grofman (Reference Brunell and Grofman1998) looked for evidence of a new realignment in terms of our time series on the number of divided US Senate delegations, we found no clear evidence for such a new realignment. This null finding is consistent with the view of scholars who argued that we were in the process of dealignment rather than realignment in the 1960s, 1970s, 1980s, and beyond. However, with a relatively limited number of data points post-Reagan, it is possible that the reason that Brunell and Grofman (Reference Brunell and Grofman1998) failed to find evidence of a new Reagan-era realignment was simply due to the limits of statistical inference, for which there are only a few cases. With 10 more elections, we can reexamine the question of whether waiting for a new realignment was (like waiting for Godot) an exercise in futilityFootnote 7 or whether, instead, there actually was a realignment visible around the time of Reagan’s election in 1980—a realignment the reality of which was dismissed by most political scientists at the time (and even long after).
With 10 more elections, we can reexamine the question of whether waiting for a new realignment was (like waiting for Godot) an exercise in futility or whether, instead, there actually was a realignment visible around the time of Reagan’s election in 1980—a realignment the reality of which was dismissed by most political scientists at the time (and even long after).
DATA AND ANALYSIS
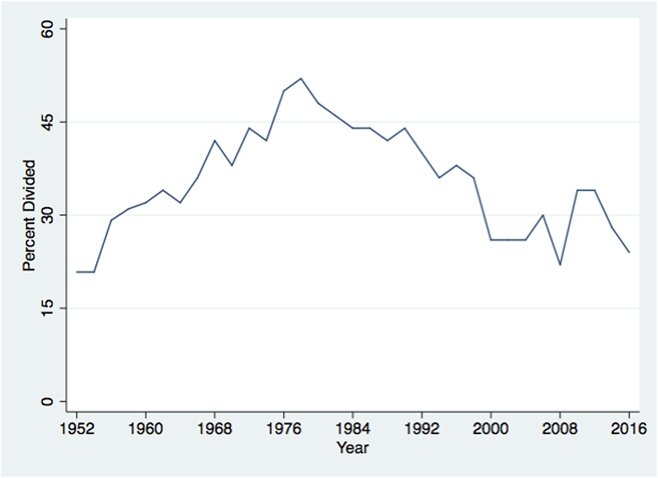
The longer time-series for the period 1788 through 1996 presented in Brunell and Grofman (Reference Brunell and Grofman1998) showed what appears to be a cyclical pattern of rise and fall in the number of divided Senate delegations, with highs occurring mostly in years near the dates traditionally identified as realignment years (i.e., the presidential elections of 1792, 1828, 1860, 1896, and 1932). This discussion is limited to the time-series data on the number of divided Senate delegations from 1952 to 2016 because this is the most relevant period for examining the notion of a Reagan realignment (figure 1).
Divided Senate Delegations 1952–2016
Note: The graph indicates the percentage of states with divided Senate delegations after each biennial election.
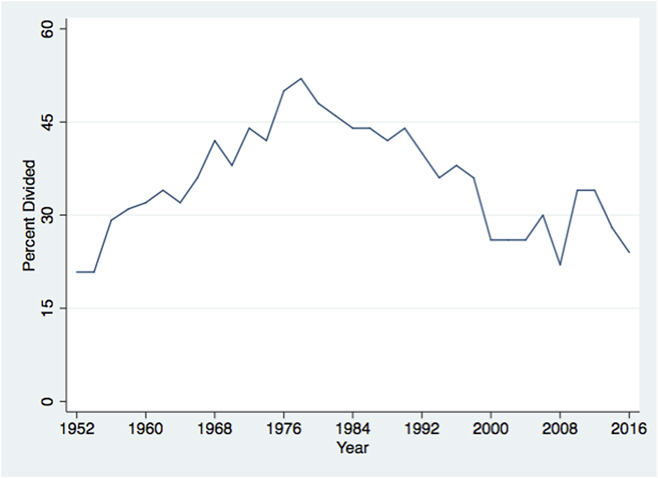
In 1996, when Brunell and Grofman ended our time-series, there were 19 states with divided delegations; since that time, the number decreased to a low of 11 in 2008 and then increased to 17 for two elections. After the 2016 election, there were only 12 states with divided delegations. Examining these trends, we see rising numbers of divided delegations from 1952 through 1978 (i.e., dealignment) and a generally declining number thereafter (i.e., ongoing realignment).
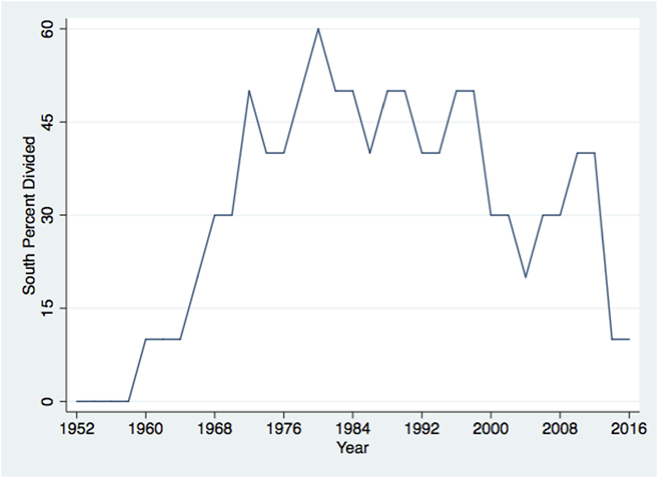
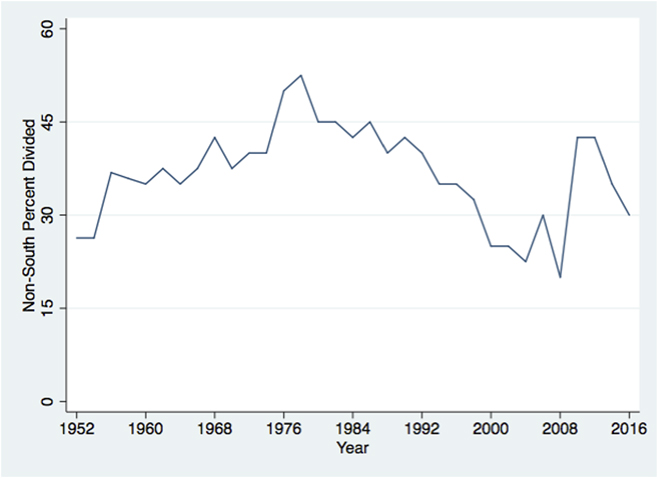
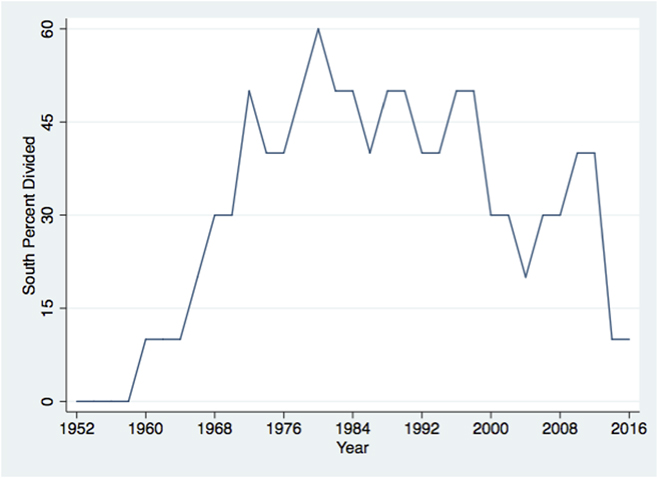
A key claim by Brunell and Grofman (Reference Brunell and Grofman1998) was that realignment was ongoing in the South in a way that would lead to an increase in the number of unified delegations by increasing the number of southern delegations under Republican control. Figure 2 disaggregates the data on divided Senate delegations for states in the South.Footnote 8 This cyclic pattern was particularly obvious in the South during the previous six decades. Today in the South, only Florida is represented by a divided delegation; all of the other states, except Virginia, elect only Republicans. Figure 3 disaggregates the data on divided Senate delegations for states in the non-South.
Divided Senate Delegations in the South, 1952–2016
Note: The graph indicates the percentage of southern states with divided Senate delegations. The South includes Alabama, Arkansas, Florida, Georgia, Louisiana, Mississippi, North Carolina, South Carolina, Texas, and Virginia.
Divided Senate Delegations in the Non-South 1952–2016
Note: The graph indicates the percentage of non-southern states with divided Senate delegations. The non-South includes the 40 states not included in the South.
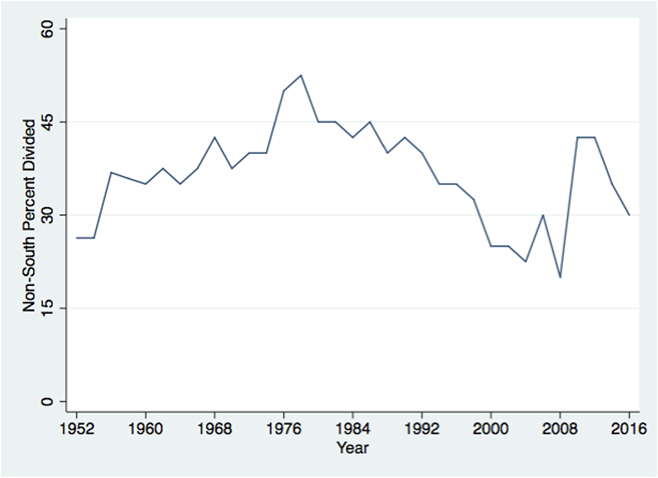
Figures 2 and 3 show that both the South and the non-South have experienced declines in the number of states with divided delegations since 1996. In 1996, five of the 10 states elected divided delegations. However, we also observed that whereas divided delegations decreased in the rest of the country, the unification is not so uniform in a pro-Republican direction outside of the South. For example, whereas in the Northeast, only Pennsylvania and MaineFootnote 9 are currently represented by one senator from each party, the partisan balance in the northeastern states under unified control is mixed. Northeastern states including Massachusetts, New York, New Jersey, New Hampshire, and Vermont have unified Democratic delegations, whereas Maine and Pennsylvania have a unified Republican delegations.
DISCUSSION
Although there is considerable year-to-year variation caused by idiosyncratic factors, Brunell and Grofman (Reference Brunell and Grofman1998) were correct in their prediction of a continuing trend involving a decrease in the number of divided Senate delegations after 1996. More important, additional analyses strongly suggest that we were also correct in recognizing the changes over time in the number of divided Senate delegations as closely linked to realignment trends in the South and also in parts of the non-South. However, the realignment trends were not necessarily moving concurrently in a given partisan direction.Footnote 10 In particular, figures 1–3 are interpreted as signaling a realignment taking place around 1978–1980. Of course, as emphasized in this article, the pattern is not fully monotonic because various campaign-specific factors (discussed previously) can lead to short-term reversals in realignment patterns—and some trends may flatten out before they reverse. We sought to ignore such short-term fluctuations to look for more long-term patterns.
What can we now say about the future of representation in the Senate? In our view, the southern realignment has run its course, with most of the South being solidly Republican. However, given demographic trends and patterns of movement of people within the country, some of the southern states are less Republican now relative to even 10 years ago (Virginia and North Carolina in particular). Texas continues to elect a solid slate of Republicans to all of its statewide offices, not only the Senate. However, as the Hispanic population continues to grow in that state, it also is likely to trend less red and more blue in the future. Therefore, our speculative prediction is that the number of divided Senate delegations will increase in the short- and medium-term future.
It is also the case, however, that both major American political parties appear to be in a state of flux. Thus, the direction that parties take in the next few years has the potential for substantial changes in their relative ideological positions on issues such as free trade and immigration. These changes may impact realigning trends in ways that we cannot now readily predict.