INTRODUCTION
Epiphyte assemblage in tropical forests is driven by dispersal and colonization processes (Cascante-Marin et al. Reference CASCANTE-MARIN, VON MEIJENFELDT, DE LEEUW, WOLF, OOSTERMEIJER and DEN NIJS2009, Engwald et al. Reference ENGWALD, SCHMIT-NEUERBERG, BARTHLOTT, Breckle, Schweizer and Arndt2000, Nieder et al. Reference NIEDER, PROSPERI and MICHALOUD2001, Van Dunné Reference VAN DUNNÉ2001, Wolf Reference WOLF1993), and by niche-filling mechanisms related to species-specific adaptations to the environment (Griffiths & Smith Reference GRIFFITHS and SMITH1983, Reyes-García et al. Reference REYES-GARCÍA, GRIFFITHS, RINCON and HUANTE2008). The features of the phorophytes, i.e. the plants that carry the epiphytes (in tropical forests mostly trees and lianas) play a crucial role. This includes the age, size, architecture, bark type and leaf characteristics of phorophytes (Benzing Reference BENZING1990, Reyes-García et al. Reference REYES-GARCÍA, GRIFFITHS, RINCON and HUANTE2008). Because of the high tree diversity, few studies have endeavoured to test how phorophyte species identity in lowland rain forests might influence epiphyte distribution (Benavides et al. Reference BENAVIDES, DUQUE, DUIVENVOORDEN, VASCO and CALLEJAS2005, Cardelus et al. Reference CARDELUS, COLWELL and WATKINS2006). Laube & Zotz (Reference LAUBE and ZOTZ2006a) reported that the distribution of 69–81% of the epiphyte species on three abundant host trees in Panama was indistinguishable from random.
The first regional survey of vascular epiphytes in Colombian Amazonia (Benavides et al. Reference BENAVIDES, DUQUE, DUIVENVOORDEN, VASCO and CALLEJAS2005) found a strong association of epiphyte composition with the principal landscape units (floodplains, swamps, white sands and three well-drained upland units). These patterns were mainly explained by differences in humidity and soil nutrient availability related to seasonal flooding in the floodplains and permanent inundation in swamps. In their analyses Benavides et al. (Reference BENAVIDES, DUQUE, DUIVENVOORDEN, VASCO and CALLEJAS2005) did not differentiate between holo-epiphytes and hemi-epiphytes. Holo-epiphytes fully depend on the availability of phorophyte surface for establishment and growth, whereas hemi-epiphytes root in the terrestrial soil at some point in their life cycle (Benzing Reference BENZING1986, Reference BENZING1987; Kreft et al. Reference KREFT, KOSTER, KUPER, NIEDER and BARTHLOTT2004). Because terrestrial soils are irrelevant as rooting substrate for holo-epiphytes, direct effects of flooding or soil drainage on the distribution or diversity of holo-epiphytes cannot be expected. Therefore, differences in species composition and diversity between landscape units are probably more pronounced for hemi-epiphytes than for holo-epiphytes. However, in cases of strong host-preferences (Benzing Reference BENZING1990), landscape units and the species composition of holo-epiphytes might still be correlated as a consequence of the fact that the distribution of the phorophyte species strongly relates to landscape units (Duivenvoorden & Duque Reference DUIVENVOORDEN, DUQUE, Hoorn and Wesselingh2010).
The aim of this study was to examine how host-preferences contribute to the distribution of epiphyte assemblages over different landscape units in lowland Amazonia. We hypothesized that epiphyte composition and landscape units are associated (based on Benavides et al. Reference BENAVIDES, DUQUE, DUIVENVOORDEN, VASCO and CALLEJAS2005), but that the composition and diversity of hemi-epiphyte species differ more strongly between landscape units than those of holo-epiphytes. Furthermore, we hypothesized that the epiphyte species composition is related to the phorophyte species composition, and that this phorophyte effect would partially explain the differences between the landscape units, especially regarding holo-epiphytes.
METHODS
Study site
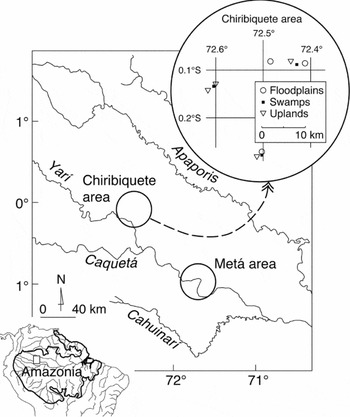
Fieldwork was carried out between August and September 2001 in Chiribiquete National Park in the north-western part of Colombian Amazonia (Figure 1). The area has a yearly precipitation of 3000–3800 mm (Duivenvoorden & Lips Reference DUIVENVOORDEN and LIPS1995, Peñuela & von Hildebrand Reference PEÑUELA and VON HILDEBRAND1999). The principal landscape units found in the forest area are swamps, where soils are poorly drained; floodplains, where soils are moderately well- to well-drained and are seasonally flooded by river water; and uplands, where soils are moderately well- to well-drained and which are situated outside the floodplains. The composition of the vascular plant species (herbs and other plants >1 m height) varied according to landscape unit (Duque et al. Reference DUQUE, DUIVENVOORDEN, CAVELIER, SÁNCHEZ, POLANÍA and LEON2005).
Map showing the Chiribiquete area in Colombian Amazonia. The precise location of the sample plots is shown in the detailed map, in the upper right corner. For comparison, the study area from which Benavides et al. (Reference BENAVIDES, DUQUE, DUIVENVOORDEN, VASCO and CALLEJAS2005) reported (the surroundings of the lower catchment of the Metá River) is also shown.

Field sampling
Ten rectangular plots of 0.1 ha (20 × 50 m) were established at a minimum distance of 1 km between each other (Figure 1). Four plots were laid in uplands, three in floodplains, and three in swamps. All vascular epiphytic plants found on trees and lianas, which rooted inside the plots and which had a dbh (diameter at 130 cm height) of 2.5 cm or more, were recorded. For each host tree the following variables were recorded: species name, tree height, height of first branch (trunk height), maximum and minimum crown diameter and dbh. Tree trunk surface was calculated as π × trunk height × dbh, assuming a cylindrical trunk shape. Tree crown volume was calculated as π × crown area (the elliptic projection of the crown on the ground) × crown height (total height minus trunk height), assuming that crowns had the shape of an elliptic cylinder. For each epiphyte, growth habit, position above ground (in the case of hemi-epiphytes the maximum height was considered), and position on the phorophyte (main trunk or crown) were recorded. The field survey was done with the help of indigenous climbers. Binoculars were used to detect epiphyte individuals occurring on distant branches. All observed plants were dislodged using pole tree pruners. Clonal plants were counted as single individuals only when there was certainty that these belonged to a distinct genet, for example by their spatial separation from other epiphyte stands (Galeano et al. Reference GALEANO, SUAREZ and BALSLEV1998, Sanford Reference SANFORD1968). Plant collections were made for all host and epiphyte species found in each plot. Species identification took place at the Herbario Amazónico Colombiano (COAH), Herbario Nacional Colombiano (COL), Herbario Universidad de Antioquia (HUA), and at the Missouri Botanical Garden (MO). A complete collection of all vouchers was deposited at HUA, with duplicates at COL, COAH, MO and NY. In this study, the term epiphyte is used in a broad sense; epiphyte growth habit is clarified when necessary. Holo-epiphyte and hemi-epiphyte growth habits were defined following Moffett (Reference MOFFETT2000), on the basis of field observations and species descriptions in literature and herbarium collections. Hemi-epiphytes include primary and secondary hemi-epiphytes. Primary hemi-epiphytes germinate on phorophytes and become terrestrially rooted through aerial roots. In contrast, secondary hemi-epiphytes germinate in the terrestrial soil but lose contact with this soil later in their life cycle.
Numerical analysis
ANOVA was carried out to analyse, among plot means, the differences in species richness, Fisher's alpha index (Condit et al. Reference CONDIT, HUBBELL, LAFRANKIE, SUKUMAR, MANOKARAN, FOSTER and ASHTON1996, Fisher et al. Reference FISHER, CORBET and WILLIAMS1943), and number of epiphyte individuals among landscape units. Species richness, stem density and occupancy of phorophytes were analysed in the same way. All these variables were distributed normally (Kolmogorov–Smirnov test with Lilliefors correction; P > 0.05), except for the number of individuals and the Fisher's alpha index of primary hemi-epiphytes, the trunk surface of trees and lianas, and the height of the ten largest trees. For individual landscape units ANCOVA (Engqvist Reference ENGQVIST2005) was used to examine if the regression of the number of epiphyte individuals or epiphyte species richness against tree size differed between holo- and secondary hemi-epiphyte habits. For this, tree size was calculated as the sum of the standardized trunk surface and the standardized crown volume (standardization on the basis of all trees in all plots) (Wolf et al. Reference WOLF, GRADSTEIN and NADKARNI2009). The ANCOVA was done as a GLM with Poisson errors in R 2.10, applying tree size and the interaction of epiphyte growth habit × tree size as predictors. Significance was checked after compensation for overdispersion by refitting the models using quasi-Poisson errors (Crawley Reference CRAWLEY2007). DCA ordinations (Hill Reference HILL1979) were conducted applying CANOCO for Windows (version 4.51, ter Braak & Smilauer Reference TER BRAAK and SMILAUER1998) to visually explore the main patterns in species composition of all epiphytes, holo-epiphytes and secondary hemi-epiphytes. Species abundances in all DCA were the log-transformed numbers of individuals. Mantel and partial Mantel tests were done applying the Vegan package in R 2.10 (R package version 1.15–3 http://rforge.r-project.org/projects/vegan/). In these, matrix A contained the between-plot distance in epiphyte species composition calculated as the Bray–Curtis dissimilarity (Legendre & Legendre Reference LEGENDRE and LEGENDRE1998) based on the log-transformed number of individuals per plot. Matrix B or matrix C contained the between-plot distance calculated as the binary coefficient based on the plot assignments to each of the three landscape units, the between-plot distance in phorophyte species composition calculated as the Bray–Curtis dissimilarity based on the log-transformed basal area of phorophytes per plot, or the log-transformed Euclidean distance between the plots, calculated on the basis of their decimal geographic coordinates. To detect possible spurious effects by scarce species, the DCA ordinations and Mantel tests were repeated with a subset of abundant species (arbitrarily defined as those species which were recorded with 60 individuals or more).
Following Laube & Zotz (Reference LAUBE and ZOTZ2006b), epiphyte species preference for phorophyte species was tested by means of two randomization procedures using R 2.10. The aim of the first randomization procedure was to test if a given phorophyte species was occupied by more or fewer individuals of epiphyte species than expected by chance alone in one single plot. First, we selected for each plot those phorophyte species (trees only), which occurred with eight individuals or more and which were covered by more than 59 epiphytes. Then, E was defined as the number of epiphyte individuals on each selected phorophyte species in the plot. We created a null model of the epiphyte species composition on the selected phorophyte species by applying 999 random draws with replacement of E epiphyte individuals from the pool of all epiphyte individuals in the plot. The original epiphyte species composition of E individuals on the selected phorophyte was added as draw 1000 (Hope Reference HOPE1968, Manly Reference MANLY1997). Then, for all epiphyte species we established the number of individuals in the 2.5 and 97.5 percentiles of the 1000 draws. If the original number of epiphyte individuals was located outside the interval of the 2.5 percentile and the 97.5 percentile, it was considered significant. The aim of the second randomization procedure was to test if a given epiphyte species covered more or fewer individuals of phorophyte species than expected by chance alone in one single plot. Only those epiphyte species were tested which covered at least eight phorophytes (only trees) and which occurred with 60 epiphyte individuals or more in one single plot. Analogous to the first randomization procedure, a null model was created of the assemblage of phorophyte species (only trees) that carried the selected epiphyte species, by applying 999 random draws with replacement of E phorophyte individuals from the pool of all phorophyte individuals in the plot. In this case, E was defined as the number of phorophyte individuals carrying each selected epiphyte species in the plot. For each phorophyte individual the probability of being included in the random draws was proportional to its standardized tree size, defined for the ANCOVA analyses. For this purpose, the standardized tree size values were shifted to obtain a minimum tree size value of one. The original phorophyte species composition of E individuals carrying the selected epiphyte was added as draw 1000 (Hope Reference HOPE1968, Manly Reference MANLY1997). The significance was defined in the same way as in the first randomization procedure.
RESULTS
Patterns between landscape units
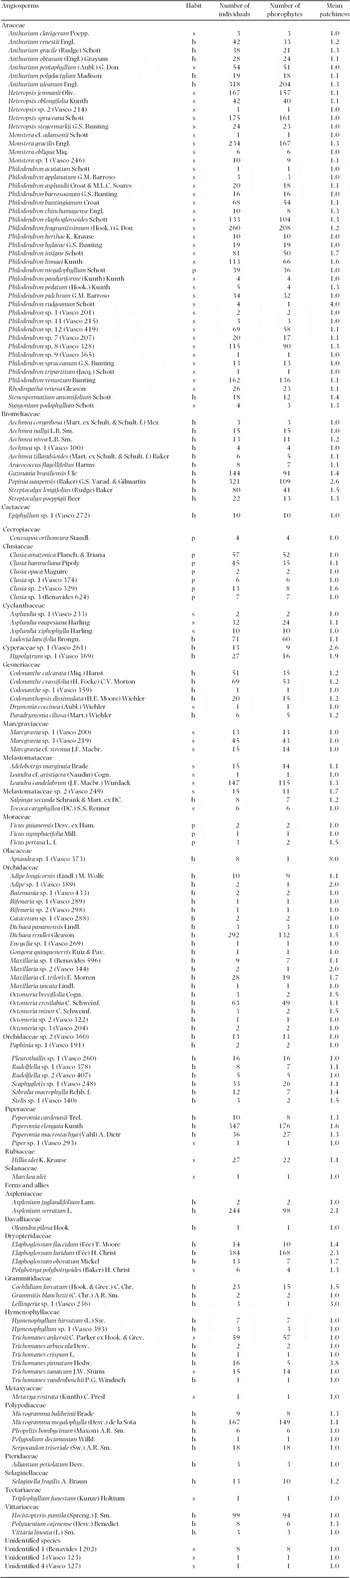
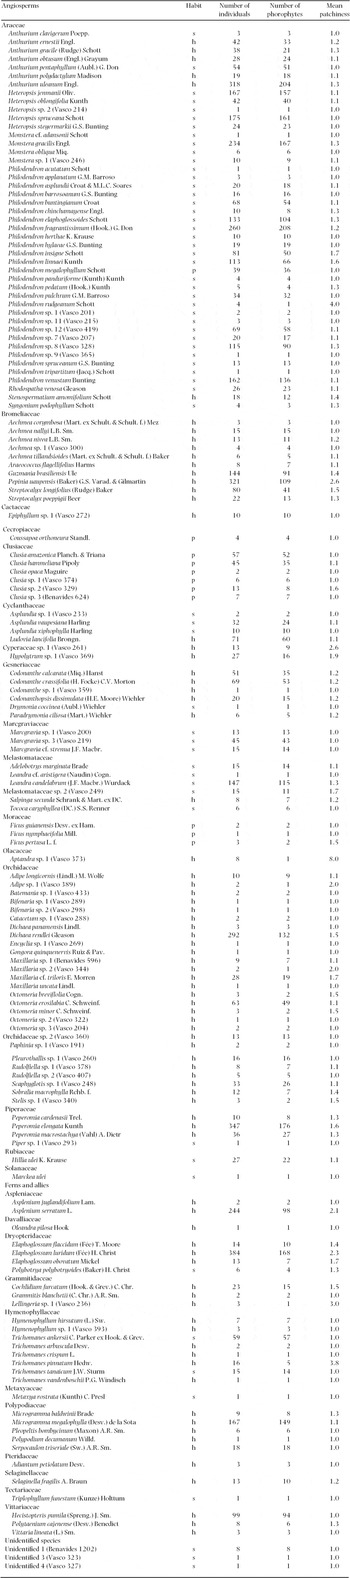
Overall we recorded 154 epiphyte species, distributed over 66 genera and 28 families (Appendix 1). Most epiphyte species belonged to the families Araceae (45) and Orchidaceae (27). Philodendron was the most species-rich genus (26). Eighty-two species were holo-epiphytes and 72 were hemi-epiphytes (11 primary and 61 secondary). In total, 3310 holo-epiphyte and 2516 hemi-epiphyte plants were recorded. Of all hemi-epiphyte plants, 179 were primary hemi-epiphytes and 2337 secondary hemi-epiphytes. Because of the scarcity in primary hemi-epiphytes (in both species and individuals) further analyses of hemi-epiphytes concentrated on patterns of secondary hemi-epiphytes. Most epiphyte species occurred in low abundances. For instance, 62 holo-epiphyte species (78%) and 40 (66%) secondary hemi-epiphyte species contributed with less than 1% of the total amount of individuals. For 84% of the species the average indicator of patchiness (number of epiphyte individuals divided by number of phorophyte individuals) was below 1.5, and for 99% of the species this indicator was below 4.5 (Appendix 1). These results demonstrate a general tendency for a low aggregation. Holo-epiphytes showed a low abundance in the uplands, whereas secondary hemi-epiphytes were most diverse in the uplands (Table 1).
Number of species and individuals, and Fisher's alpha index of holo-epiphytes and hemi-epiphytes in three landscape units in the Chiribiquete area of Colombian Amazonia. Mean ± 1 SD is shown for n 0.1-ha plots. In cases of significant differences between landscape units, the lowercase letters denote the results of Tukey–Kramer HSD post hoc comparison tests (with a significance level of 0.05). * = 0.01 ≤ P < 0.05; ** = 0.001 ≤ P < 0.01; *** = P < 0.001.

A total of 568 species of tree and liana (dbh ≥ 2.5 cm) were recorded, 411 of which carried epiphytes (phorophyte species). Most forest structural variables did not differ substantially among the landscape units, apart from the species richness and the canopy height (Table 2). The density of epiphytes on phorophytes was low: 75% of the phorophytes carried three or fewer epiphyte plants. In all landscape units holo-epiphytes were found on about the same number of phorophyte species and on a roughly similar number of phorophyte individuals (Table 3). Also, the occupancy did not vary between the landscape units: about 20–40% of the trees and lianas (dbh ≥ 2.5 cm) carried holo-epiphytes. However, the trunk surface and the crown volume of the phorophytes that carried holo-epiphytes were smallest in the upland forests. Contrary to this, the trunk surface of phorophytes carrying secondary hemi-epiphytes was largest in uplands, whereas the crown volume did not differ between the landscape units. In uplands the density and species richness of phorophytes carrying secondary hemi-epiphytes was larger than in swamps and floodplains. Just as with holo-epiphytes, the occupancy levels were similar between the landscape units (25–50% of the phorophytes were covered with secondary hemi-epiphytes).
Tree and liana information (dbh ≥ 2.5 cm) from three landscape units in the Chiribiquete area of Colombian Amazonia. Mean ± 1 SD is shown for n 0.1-ha plots (see n in Table 1). In cases of significant differences between landscape units, the lowercase letters denote the results of Tukey–Kramer HSD post hoc comparison tests (with a significance level of 0.05). * = 0.01 ≤ P < 0.05; ** = 0.001 ≤ P < 0.01; *** = P < 0.001.

Phorophyte information (dbh ≥ 2.5 cm) from three landscape units in the Chiribiquete area of Colombian Amazonia. Number of species, individuals and occupancy is based on trees and lianas; trunk surface and crown volume is only based on tree phorophytes. Mean ± 1 SD is shown for n 0.1-ha plots (see n in Table 1). In case of significant differences between landscape units, the lowercase letters denote the results of Tukey–Kramer HSD post hoc comparison tests (with a significance level of 0.05). * = 0.01 ≤ P < 0.05; ** = 0.001 ≤ P < 0.01; *** = P < 0.001.

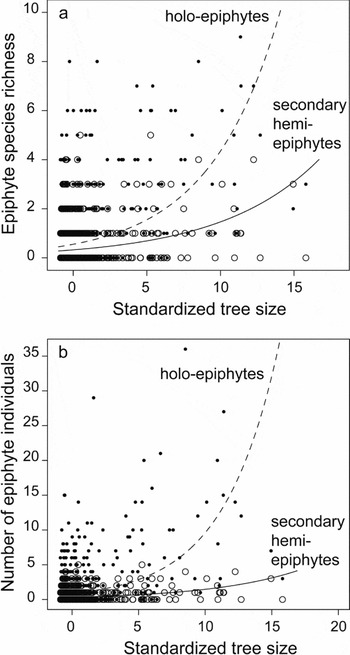
The species richness and abundance of epiphytes increased with tree size in all landscape units (ANCOVA, tree size factor, P < 0.001). However, the interaction effect of epiphytic growth habit × tree size was only significant in swamps (ANCOVA, P < 0.001). In this landscape unit holo-epiphytes showed the steepest relationship with tree size, for both species richness (Figure 2a) and abundance (Figure 2b).
Scatter plots of the number of species richness (a) and epiphyte individuals (b) against standardized tree size in swamps. The lines connect the values predicted by the GLM (Poisson errors) analysis. Small dots and the interrupted line represent holo-epiphytes; open circles and the continuous line represent secondary hemi-epiphytes.

Did epiphyte assemblages relate to landscape units or phorophytes?
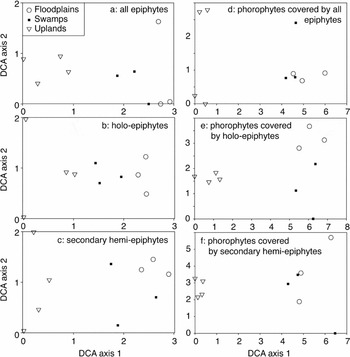
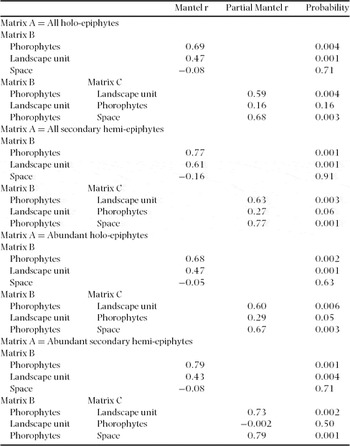
Species assemblages of holo-epiphytes and secondary hemi-epiphytes were clearly related to the landscape units (Figure 3, Table 4). Patterns including all epiphyte species (DCA diagrams not shown) did not differ from those obtained on the basis of only the most abundant species. However, the epiphyte species composition yielded consistently higher Mantel correlation coefficients with phorophyte species composition than with landscape unit. Epiphyte species composition against landscape unit controlling for phorophyte species composition yielded lower partial Mantel coefficients than epiphyte species composition against phorophyte species composition controlling for landscape unit. Epiphyte composition was not related to space. Using space as a conditional effect hardly reduced the phorophyte effect on epiphyte composition. Phorophyte composition was significantly related to the landscape units (Figure 2; Mantel r = 0.65, P = 0.001 for phorophytes carrying all epiphytes; Mantel r = 0.53, P = 0.004 for phorophytes with holo-epiphytes; Mantel r = 0.61, P = 0.001 for phorophytes with secondary hemi-epiphytes).
DCA ordination diagrams to illustrate the association of the species composition of all epiphyte species (a); only holo-epiphytes (b); only secondary hemiphytes (c); phorophytes covered by all epiphyte species (d); phorophytes covered by holo-epiphytes (e); phorophytes covered by secondary hemi-epiphytes (f) with landscape units. The symbols represent the sample plots.

Mantel and partial Mantel test results of the species composition of vascular epiphytes against landscape units, species composition of trees and lianas (phorophytes) and space, in the Chiribiquete area of Colombian Amazonia. Mantel r is the Mantel correlation coefficient between matrix A and matrix B. Partial Mantel r is the Mantel correlation between matrix A and matrix B when the effect of matrix C is removed.

Were individual epiphyte species associated to individual phorophyte species?
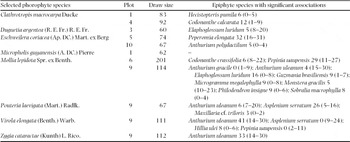
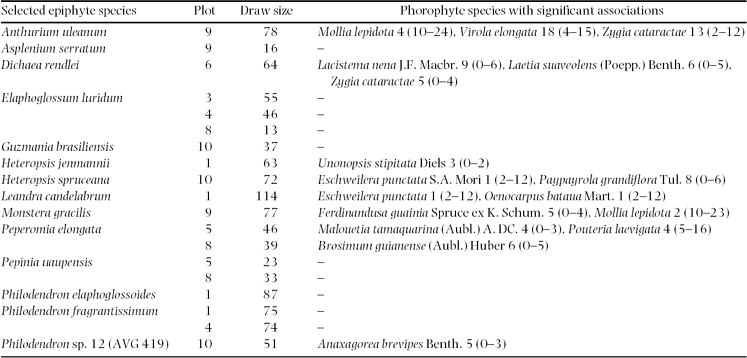
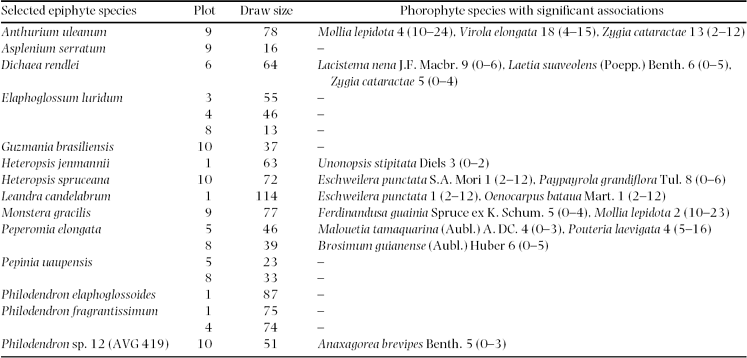
Eight phorophyte species occurred at densities of eight or more trees in one single plot, and were covered by 60 or more epiphytes (Table 5). On the basis of the randomization tests applied to these phorophyte species, significant associations were found with a total of 20 epiphyte species. Fifteen of these associations were positive (the epiphyte species occurred with more individuals on the selected phorophyte species than the null model predicted), and eight were negative. The second randomization test started with the selection of 14 epiphyte species, which occurred on eight or more phorophyte trees in densities of 60 individuals or more per plot. In this test the size of the phorophyte trees influenced their incorporation in the null model of phorophyte species composition. The selected epiphyte species showed 17 significant associations with a total of 13 phorophyte species (Table 6). Of these, 11 associations were positive and six negative.
Results of the randomization procedure to test the association of selected phorophyte species with individual epiphyte species. For each phorophyte species the significantly associated epiphyte species are listed. After each epiphyte species name are the recorded number of epiphyte individuals on the phorophyte species in the plot and, in parentheses, the 95% confidence interval as derived from the randomization tests. Draw size equals the total number of epiphytes recorded on the selected phorophyte species in the indicated plot.

Results of the randomization procedure to test the plotwise association of selected epiphyte species with individual phorophyte species (trees only). In these tests the size of phorophyte trees influenced the phorophyte species composition of the null model. For each epiphyte species the significantly associated phorophyte species are listed. After each phorophyte species name are the recorded number of phorophyte trees on which the epiphyte species was found in the plot and, in parentheses, the 95% confidence interval as derived from the randomization tests. Draw size equals the number of phorophytes covered by the epiphyte species in the indicated plot.
DISCUSSION
Whole species assemblages
The species composition of both holo- and secondary hemi-epiphytes differed significantly over the three landscape units in Chiribiquete, just as in the Metá area, about 100 km south-east (Figure 1; Benavides et al. Reference BENAVIDES, DUQUE, DUIVENVOORDEN, VASCO and CALLEJAS2005). Contrary to our expectation, holo-epiphytes did not show a substantially lower degree of association with the landscape units than secondary hemi-epiphytes. Can this habitat effect be attributed to the combined result of an epiphyte–phorophyte association and a correlation of phorophyte composition with landscape units? The species composition of phorophytes for holo-epiphytes and phorophytes for secondary hemi-epiphytes differed significantly between the landscape units. This concurs with results from other studies in upper Amazonia (overview in Duivenvoorden & Duque Reference DUIVENVOORDEN, DUQUE, Hoorn and Wesselingh2010), which generally indicate that species composition of trees and lianas differs among the main landscape units or forest types. The epiphyte–phorophyte association was also significant for both holo-epiphytes and secondary hemi-epiphytes. For holo-epiphytes and secondary hemi-epiphytes the effect of landscape unit on species composition strongly decreased after controlling for the phorophyte composition in the plots. In contrast, the effect of the phorophyte composition remained significant after accounting for the effect of landscape unit. Therefore, our results suggested that the association of epiphyte species composition with landscape units was largely due to the strong link between epiphytes and phorophytes, for both holo- and secondary hemi-epiphytes.
Phorophyte composition may be a prevailing factor in epiphyte species distribution because the phorophyte assemblage as a whole provides a wide spectrum of epiphyte habitats related to variation in age, phenology, architectural traits and physico-chemical properties of epiphyte substrates, among others. All of these create specific micro-habitats (Freiberg Reference FREIBERG2001) and substrate conditions exploited by specific sets of epiphytes (Benavides et al. Reference BENAVIDES, DUQUE, DUIVENVOORDEN, VASCO and CALLEJAS2005, Reference BENAVIDES, WOLF and DUIVENVOORDEN2006; Bennett Reference BENNETT1986, Benzing Reference BENZING1981, Callaway et al. Reference CALLAWAY, REINHART, MOORE, MOORE and PENNINGS2002, Dejean et al. Reference DEJEAN, OLMSTED and SNELLING1995, Frei & Dodson Reference FREI and DODSON1972, Hietz & Briones Reference HIETZ and BRIONES1998, Johansson Reference JOHANSSON1974, Kernan & Fowler Reference KERNAN and FOWLER1995, Migenis & Ackerman Reference MIGENIS and ACKERMAN1993, Talley et al. Reference TALLEY, SETZER and JACKES1996, Wolf Reference WOLF1994). In Mexico, Mehltreter et al. (Reference MEHLTRETER, FLORES-PALACIOS and GARCIA-FRANCO2005) showed that tree ferns hosted a different epiphyte community compared to angiosperms. In Panama, Zotz & Schultz (Reference ZOTZ and SCHULTZ2008) reported that five host tree species significantly explained about 9% of the epiphyte composition (71 holo-epiphyte species occurring on 91 trees in 0.4 ha) whereas dbh alone explained only 2%. In contrast to phorophytes, landscape units influence establishment and population dynamics of epiphytes in a less direct way, for example via variations in meso- and microclimate (humidity), soil differentiation (Gentry & Dodson Reference GENTRY and DODSON1987), and forest dynamics (Phillips et al. Reference PHILLIPS, BAKER, ARROYO, HIGUCHI, KILLEEN, LAURANCE, LEWIS, LLOYD, MALHI, MONTEAGUDO, NEILL, VARGAS, SILVA, TERBORGH, MARTINEZ, ALEXIADES, ALMEIDA, BROWN, CHAVE, COMISKEY, CZIMCZIK, DI FIORE, ERWIN, KUEBLER, LAURANCE, NASCIMENTO, OLIVIER, PALACIOS, PATINO, PITMAN, QUESADA, SALIDAS, LEZAMA and VINCETI2004). Also, in our study, the effect of landscape unit was estimated by means of the binary distance between only three landscape units, providing a relatively weak basis to explain epiphyte composition.
The Mantel tests further suggested that the epiphyte composition (both holo- and secondary hemi-epiphytes) was not related to the spatial distance between plots, and therefore not restricted by any dispersal limitation at the between-plot scale (Benavides et al. Reference BENAVIDES, DUQUE, DUIVENVOORDEN, VASCO and CALLEJAS2005). This is remarkable because other studies of epiphyte establishment and epiphyte succession reported significant spatial effects, presumably related to slow rates of colonization, leptokurtic seed-dispersal patterns and priority effects (Ackerman et al. Reference ACKERMAN, SABAT and ZIMMERMAN1996, Barkman Reference BARKMAN1958, Benavides et al. Reference BENAVIDES, WOLF and DUIVENVOORDEN2006, Wolf Reference WOLF2005). The isolation of epiphyte populations between regions has been mentioned as a factor determining epiphyte radiation (Gentry & Dodson Reference GENTRY and DODSON1987). In addition, space and dispersal limitation is often found as a predominant factor in tree species and liana composition (Duque et al. Reference DUQUE, PHILIPS, VON HILDEBRAND, POSADA, PRIETO, RUDAS, SUESCÚN and STEVENSON2009). Analogous to the sampling in only three landscape units, the plots were spatially configured in only three clumps (Figure 1). This low variation in spatial distances between the plots may have hampered the detection of the spatial effect on epiphyte composition.
The density and species richness of both holo- and secondary hemi-epiphytes increased as function of tree size. Generally, more epiphytes and epiphyte species are expected on larger and older trees because of the larger sampling area, more surface area for colonization and seed interception, and better conditions for epiphyte establishment such as humus accumulation on branches (Flores-Palacios & Garcia-Franco Reference FLORES-PALACIOS and GARCIA-FRANCO2006, Zotz & Vollrath Reference ZOTZ and VOLLRATH2003). Over time, the accumulated probability of settlement and habitat diversity also increase (Laube & Zotz Reference LAUBE and ZOTZ2006a).
The species richness and abundance of holo-epiphytes showed a steeper regression with tree size than secondary hemi-epiphytes in swamps. The conditions of permanent inundation in these forests probably create a continuously high atmospheric humidity, which may be beneficial for the establishment and growth of holo-epiphytes. After successful establishment, holo-epiphytes may proliferate quickly at plot or tree scales due to the large production of anemochoric seeds (Cascante-Marin Reference CASCANTE-MARIN2006). This expansion likely depends strongly on time, tree size and favourable conditions for establishment (Andrade & Nobel Reference ANDRADE and NOBEL1997, Orihuela & Waechter Reference ORIHUELA and WAECHTER2010, Zotz & Hietz Reference ZOTZ and HIETZ2001). In contrast, secondary hemi-epiphytes produce fewer seeds than holo-epiphytes (Benzing Reference BENZING1990). The lack of oxygen and high levels of aluminium and iron toxicity in inundated soils might hamper the germination of seeds or the growth of seedlings of secondary hemi-epiphytes. Besides seed dispersal, many hemi-epiphyte species show the ability to propagate vegetatively, creeping along the forest floor (Ray Reference RAY1992). Standing water likely hampers this mechanism of colonization.
About half (20–70%) of the trees and lianas (dbh ≥ 2.5 cm) carried epiphytes, suggesting that epiphyte patterns are not strongly affected by phorophyte limitation (Leimbeck & Balslev Reference LEIMBECK and BALSLEV2001). The total number of species and the relatively strong contribution of Araceae (mainly Philodendron) and Orchidaceae to the epiphyte flora were in line with the two earlier surveys in this part of Colombian Amazonia (Arévalo & Betancur Reference ARÉVALO and BETANCUR2004, Reference ARÉVALO and BETANCUR2006; Benavides et al. Reference BENAVIDES, DUQUE, DUIVENVOORDEN, VASCO and CALLEJAS2005). Ground-based surveys are commonly used to record epiphytes with an acceptable sampling accuracy (Burns & Dawson Reference BURNS and DAWSON2005, Laube & Zotz Reference LAUBE and ZOTZ2007, Leimbeck & Balslev Reference LEIMBECK and BALSLEV2001). We took special care to train our indigenous field crew to recognize and sample tiny epiphytes, also by means of pole tree pruners. In the Metá study (Benavides et al. Reference BENAVIDES, DUQUE, DUIVENVOORDEN, VASCO and CALLEJAS2005), our in situ counts of epiphyte species and individuals in the canopies of large trees (14–28 cm dbh) did not differ from counts made on branches of large trees, which were cut down just outside each plot (two-sample pairwise Wilcoxon test, V = 116, P = 0.13 for species; V = 114, P = 0.08 for individuals; n = 30 plots and 30 large trees). However, tiny epiphytes, particularly orchids, might still have been missed (Flores-Palacios & Garcia-Franco Reference FLORES-PALACIOS and GARCIA-FRANCO2001), especially in the high tree crowns. Arévalo & Betancur (Reference ARÉVALO and BETANCUR2004), who used tree-climbing gear to reach the canopy in the Chiribiquete area, found 94 species in 0.05 ha, of which 23 were orchids. Conversely, in the four upland plots (0.4 ha) we recorded 111 species, with only 15 orchid species.
Individual associations of epiphyte and phorophyte species
Because all plots showed a high diversity of epiphytes and especially phorophyte species, the associations between individual species of epiphyte species and their hosts were hard to test. The large majority of epiphytes occurred in low densities on many different phorophyte species. Pairwise associations of epiphyte and phorophyte species have been studied in several ways (Burns Reference BURNS2007, Cardelus et al. Reference CARDELUS, COLWELL and WATKINS2006, Laube & Zotz Reference LAUBE and ZOTZ2006b, Muñoz et al. Reference MUÑOZ, CHACON, PEREZ, BARNERT and ARMESTO2003). GLM or multiple logistic regression, used to test abundance or presence–absence of one single epiphyte species against phorophyte species (as dummy variables) (Hirata et al. Reference HIRATA, KAMIJO and SAITO2009), was ineffective in our study because of the low number of epiphyte hits for many of the phorophyte taxa. When ANCOVA was used to test if epiphyte abundance against phorophyte structure varied for different phorophyte taxa (Callaway et al. Reference CALLAWAY, REINHART, MOORE, MOORE and PENNINGS2002), it also failed for the same reason. For pragmatic reasons we based the threshold levels of eight phorophyte trees and 60 epiphyte individuals in our randomization tests on Laube & Zotz (Reference LAUBE and ZOTZ2006b) who tested host-preferences among a minimum number of 227 epiphyte individuals occurring on 31 phorophytes or more in a 0.4-ha plot in Panama. The randomization procedures we used only make sense if the draw size (the number of randomly sampled individuals) is high relative to the total number of individuals in the plot, and if the density of individuals is approximately evenly distributed over the species. If these conditions are not fulfilled many species may never occur in the draws, which would lead to a failure of the test for negative associations and to an overestimation of positive associations (Laube & Zotz Reference LAUBE and ZOTZ2006b). Because both negative and positive host preferences were found, our draw sizes seemed adequate. In both randomization tests, remarkably few pairwise associations between epiphyte species and phorophyte species appeared. Using the first randomization procedure (sampling epiphytes from the pool of epiphytes in the plot for selected phorophyte species) Laube & Zotz (Reference LAUBE and ZOTZ2006b) reported 74 significant (P < 0.05) epiphyte–phorophyte associations obtained from a total of 309 pairwise comparisons (a frequency of 24%) in Panama. In the seven 0.1-ha plots selected for our randomizations, these frequencies ranged from 0% to 20% (average 5%). Using the second randomization procedure (sampling phorophytes weighted by their size from the pool of phorophytes in the plot for selected epiphyte species), these frequencies were even lower (0–12%, average 2%), and also yielded different species showing pairwise associations compared with the first test. Arguably, the null model used in the second randomization test was more realistic because it took into account that larger phorophytes have higher chances on being covered by epiphytes. Yet, it remained uncertain how the spatial configuration of the phorophytes in the plot influenced the abundance of the epiphyte assemblages. Indeed, the null models in both randomizations assumed that epiphytes had unlimited access to all phorophytes in the plot. For this reason the testing procedures were applied to single plots. By pooling plots the randomization may relate certain epiphyte species that only occurred in one plot to certain phorophyte species that occurred in another plot. Because our plots were located at least 1 km apart from each other, pooling would demand an unrealistically strong dispersal process to shape the epiphyte species assemblage in the null models. Yet, even for one plot the assumption of unlimited access is improbable because of the clumped occurrences of many epiphyte species along tree trunks (Arévalo & Betancur Reference ARÉVALO and BETANCUR2006).
ACKNOWLEDGEMENTS
The authors are thankful to the indigenous people of Araracuara and Chiribiquete, and to the Fundación Puerto Rastrojo, the Herbario Amazónico Colombiano (COAH), the Herbario Nacional Colombiano (COL), the Herbario Universidad de Antioquia (HUA) and the herbarium of the Missouri Botanical Garden (MO) for providing facilities during the study. We thank Ricardo Callejas for his support and helpful suggestions. Comments on the manuscript by Jan Wolf were gratefully included. Anne Blair Gould corrected the English. This study was partially financed by the European Commission (ERB IC18 CT960038), Tropenbos-Colombia, the Netherlands Foundation for the Advancement of Tropical Research – WOTRO (WB85-335), and ALBAN (E07D401309CO).
List of epiphyte species recorded in ten 0.1-ha plots in the Chiribiquete area in Colombian Amazonia. h = holo-epiphyte; p = primary hemi-epiphyte; s = secondary hemi-epiphyte. Mean patchiness is the number of epiphyte individuals divided by the number of phorophyte individuals in a plot, averaged over all plots with >0 epiphyte individuals.