Introduction
High-resolution bathymetric data improve our understanding of seafloor morphology and drive advances in oceanographic, biological, geological and glaciological research (Dickens et al. Reference Dickens, Graham, Smith, Dowdeswell, Larter and Hillenbrand2014). In Antarctica, high-resolution multibeam swath bathymetry data are used to reconstruct deglacial history (e.g. Mackintosh et al. Reference Mackintosh, Golledge, Domack, Dunbar, Leventer and White2011), study flux of water masses on and off the shelf (e.g. Jacobs et al. Reference Jacobs, Jenkins, Giulivi and Dutrieux2011), understand the distribution of benthic habitats (e.g. Post et al. Reference Post, Beaman, O'Brien, Eléaume and Riddle2011) and understand the life cycles of various organisms (e.g. marine mammals, fish and krill; see Kaiser et al. Reference Kaiser, Brandão, Brix, Barnes, Bowden and Ingels2013). Multibeam data are also an important resource for navigating in poorly charted areas, identifying suitable coring sites for palaeoclimate studies, guiding marine spatial planning (e.g. Commission for the Conservation of Antarctic Marine Living Resources (CCAMLR) Conservation Measures) and for overall survey planning.
The amount of available swath bathymetry data in Antarctica has significantly increased in recent years as more icebreaker vessels are equipped with multibeam sonar technology; however, there are still significant gaps in data coverage, especially around the East Antarctic margin (Arndt et al. Reference Arndt, Schenke, Jakobsson, Nitsche, Buys and Goleby2013).
The Cape Darnley region of East Antarctica is an area of intense scientific interest for a number of disciplines. It is a region where nutrient-rich waters drive ocean currents and support abundant wildlife and biodiversity, and the seafloor contains important palaeorecords of past climate and ice-sheet movements. Accurate seafloor morphology information is vital for understanding these current and past processes and for interpreting point information in a spatial context.
The need for improved bathymetric data in the region has been highlighted in a number of oceanographic studies that have recently identified the Cape Darnley polynya as one of only four sites of Antarctic Bottom Water (AABW) production (Ohshima et al. Reference Ohshima, Fukamachi, Williams, Nihashi, Roquet and Kitade2013, Williams et al. Reference Williams, Herraiz-Borreguero, Roquet, Tamura, Ohshima and Fukamachi2016). Detailed bathymetric information of the Cape Darnley region is also required to assist with marine habitat identification, fisheries management and future marine survey planning. The region is contained within the CCAMLR sub-area 58.4.2. The Mac.Robertson Land continental shelf, and specifically the deep topographic, cross-shelf troughs (i.e. Burton and Nielsen basins), is a site of interest for palaeoclimate studies due to the nature of its marine sediments being undisturbed by iceberg keels, which provide a detailed palaeoclimate record for comparison with ice cores and Antarctic lakes (O'Brien et al. Reference O'Brien, Franklin and O'Loughlin1993).
Bathymetric data have been collected in the region over several decades; however, no high-resolution grid of the whole area has previously been compiled. Previous gridded datasets across larger areas (e.g. the General Bathymetric Chart of the Oceans (GEBCO) and ETOPO1, a 1 arc-minute global relief model of Earth's surface that integrates land topography and ocean bathymetry) have been at too low resolutions to clearly delineate features and, in particular, identify export pathways for AABW.
The International Bathymetric Chart of the Southern Ocean (IBCSO; Arndt et al. Reference Arndt, Schenke, Jakobsson, Nitsche, Buys and Goleby2013) has, until now, been the best publicly available dataset of the Southern Ocean, including the Cape Darnley region. IBCSO is an Antarctic-wide regional dataset, so it is necessarily generalized to a resolution of 500 m. We aimed to improve the bathymetric representation of the Cape Darnley region by creating a detailed regional bathymetry grid using new and existing bathymetry data.
Methods
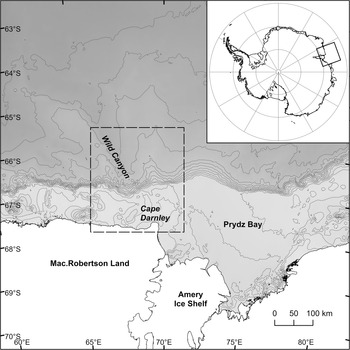
Cape Darnley forms the western extremity of Prydz Bay and the eastern extremity of Mac.Robertson Land. The Cape Darnley region referred to in this paper encompasses the shelf, continental slope and deep sea north and west of Cape Darnley (Fig. 1).
Map of the Cape Darnley region, East Antarctica. Bathymetry and contours from International Bathymetric Chart of the Southern Ocean (IBCSO; Arndt et al. Reference Arndt, Schenke, Jakobsson, Nitsche, Buys and Goleby2013). The bounding box (dashed lines) shows the extent of the Cape Darnley bathymetry grid, which extends from 65.2°E to 71.2°E and from 65.4°S to 67.8°S.

Multibeam swath mapping on several marine voyages has significantly improved our knowledge of bathymetric features near Cape Darnley on the Mac.Robertson shelf and slope. Here, we integrate those data and add other available bathymetric measurements to create a regional bathymetry grid for this part of the Antarctic continental margin.
Data sources
The Cape Darnley bathymetric grid (CDBG v1) was created by collating ship soundings from numerous expeditions following well-established procedures applied elsewhere in Antarctica (e.g. Graham et al. Reference Graham, Nitsche and Larter2011, Arndt et al. Reference Arndt, Schenke, Jakobsson, Nitsche, Buys and Goleby2013, Dickens et al. Reference Dickens, Graham, Smith, Dowdeswell, Larter and Hillenbrand2014, Leat et al. Reference Leat, Fretwell, Tate, Larter, Martin and Smellie2016).
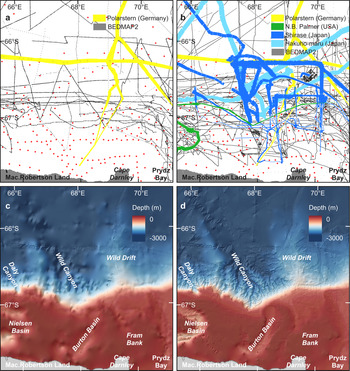
This bathymetric compilation integrates multibeam swath bathymetry data collected during eight voyages between 2001 and 2016, with all other available bathymetric data from the region including single-beam data and digitized depth soundings (Table I). As the area is adjacent to the coast where significant cover by ice shelves, floating glaciers and sea ice obscures the topography, subice topographic data from Bedmap2 were included (Fretwell et al. Reference Fretwell, Pritchard, Vaughan, Bamber, Barrand and Bell2013). Figure 2 identifies the coverage of relevant data sources and Table II shows the relative amounts of data used.
Comparison of data sources (a. and b.) and bathymetry data (c. and d.) between the 500 m International Bathymetric Chart of the Southern Ocean (IBCSO) grid and the 100 m Cape Darnley bathymetry grid, respectively. Black lines/dots represent single-beam data and red dots represent digitized depths from nautical charts (sourced from IBCSO).

Bathymetry data sources in the Cape Darnley bathymetry grid (CDBG v1) compilation.

AAD = Australian Antarctic Division; AHO = Australian Hydrographic Office; AWI = Alfred Wegener Institute; BAS = British Antarctic Survey; IBCSO = International Bathymetric Chart of the Southern Ocean; MGDS = Marine Geoscience Data System; NGA = National Geospatial-Intelligence Agency; NGDC = National Geophysical Data Center; NIPR = National Institute of Polar Research; PMGE = Polar Marine Geosurvey Expedition.
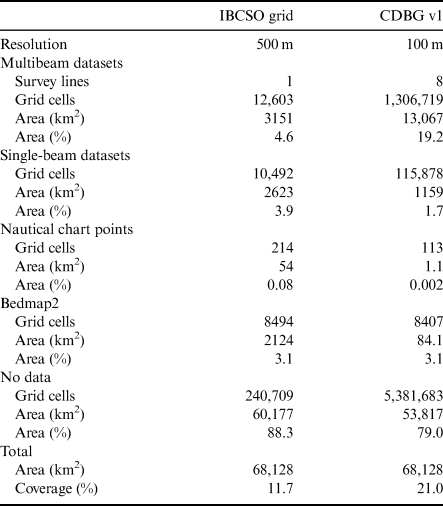
Bathymetry data coverage in the International Bathymetric Chart of the Southern Ocean (IBCSO) and Cape Darnley bathymetry grid (CDBG v1) compilations (across the same extent).

Multibeam swath bathymetry data were used as the primary data source and include previously unpublished data, thereby significantly improving the availability of detailed bathymetric information for this region from 4.6% to 19.2% (Table II). The data were collected during voyages by the Shirase (Japanese Antarctic Research Expeditions), RV Hakuho Maru (Japan Agency for Marine-Earth Science and Technology), RV Polarstern (Alfred-Wegener Institute, Germany) and RV Nathaniel B. Palmer (National Science Foundation, USA).
The RV Polarstern ANTXXIII/9 voyage acquired multibeam bathymetry data in 2007 using an Atlas Hydrosweep DS2 system. The Hydrosweep system was typically operated with a fan aperture of 90°. The measurement accuracy of Hydrosweep DS2 ranges between 0.5% and 1.0% water depth. Initial processing was conducted on board using CARIS HIPS and SIPS to remove erroneous depth measurements (Schenke et al. Reference Schenke, Agirgöl, Jurisch and Mondzech2007, Hubberten Reference Hubberten2008).
The Japanese icebreaker Shirase acquired multibeam bathymetry data during four voyages in 2009/2010 (JARE51), 2010/2011 (JARE52), 2011/2012 (JARE53) and 2012/2013 (JARE54) using a SeaBeam 3020 system and POS/MV320 positioning system. The SeaBeam 3020 operates at 20 kHz and returns 205 beams per ping with a 2° × 2° beam.
The RV Hakuho Maru acquired multibeam bathymetry data during two voyages in 2007 (KH-0704) and 2016 (KH-1601) using a SeaBeam 2120 system, which operates at 20 kHz with a 1° × 1° beam.
Multibeam swath bathymetry data were also collected on the RV Nathaniel B. Palmer expedition NBP0101 in 2001 using a SeaBeam 2112 multibeam sonar system operated at 12 kHz and returning 120 beams (Leventer Reference Leventer2013).
Single-beam bathymetry data were compiled from several sources. These included a previous compilation (Wilson Reference Wilson2013) of single-beam bathymetry data acquired by the Australian icebreakers RSV Nella Dan and RSV Aurora Australis, as well as more recent single-beam data acquired by the RSV Aurora Australis. The RSV Aurora Australis is equipped with a Simrad EK60 (12 kHz) echo-sounder.
Tertiary data were derived from IBCSO and data sources therein, including soundings digitized from hydrographic charts and some additional single-beam data (Arndt et al. Reference Arndt, Schenke, Jakobsson, Nitsche, Buys and Goleby2013). These data sources were used where no other multibeam or single-beam data were available.
The spatial extent of each data type varies considerably (Fig. 2b), with the majority of multibeam data concentrated around Wild Canyon. Areas on the shelf, particularly those closest to the coastline, have a much sparser coverage, with only a few single-beam track lines and digitized depths from nautical charts. Similarly, deeper-water regions to the north have sparse coverage, and this is reflected in the final grid product, with areas of sparse data input resulting in more heavily interpolated bathymetry, which appears smoother with less detail (Fig. 2d). Although the final grid has greater data coverage compared to the IBCSO grid, particularly of high-resolution multibeam data, 76% of the region still remains unconstrained by direct measurement (Table II).
The geographical extent of the compilation is defined by a bounding box from ~65.2°E to 71.2°E and from ~65.4°S to 67.8°S, covering an area of 68,128 km2 (Fig. 2d). The rationale for this geographical delineation was based on the spatial extent of the input datasets and encompasses good source data coverage, particularly of multibeam bathymetry. Features of scientific interest, including the Mac.Robertson shelf and Wild Canyon, are captured within the bounding box.
Data cleaning
All data were curated at Geoscience Australia. The multibeam bathymetry data from the Polarstern voyage were already processed. The Shirase and Hakuho Maru data were partially processed, typically by application of standard filters, but required some additional processing. Good-quality data that had been removed by overly harsh filters were reinstated, and additional cleaning was performed manually to remove erroneous points. Inspection of overlapping swaths revealed alignment between the Polarstern and most Shirase data; however, there were depth differences of ± 9 m between some Shirase voyages. The cause of this depth discrepancy was unknown but could be due to incorrect tide or vessel draft values, low signal-to-noise ratios or inappropriate sound velocity profiles. To correct the issue, data from the offset Shirase voyages were shifted by the application of a Tide File to force relative agreement with the Polarstern and other Shirase datasets. Outer beam noise remains a strong feature due to most surveys consisting of single swath tracks rather than overlapping lines. The additional processing was completed using CARIS HIPS and SIPS (v. 8). Once cleaned, the multibeam data were gridded to 100 m, imported into ArcGIS (v10.5, ESRI) and converted to points.
The majority of single-beam data, provided by the Australian Antarctic Division in MGD77 format, were processed as outlined by Wilson (Reference Wilson2013). In summary, sound velocity corrections were applied, and the navigation and depth data were processed in CARIS HIPS (v 7.0) software to remove erroneous points. The data were gridded to 100 m resolution and imported into ArcGIS.
Additional single-beam data from the RV Aurora Australis were processed by the Australian Hydrographic Office and obtained from the Australian Antarctic Data Centre (Table I). These data were imported directly into ArcGIS.
Bathymetry gridding process
We constructed a high-resolution bathymetric grid of the Cape Darnley continental shelf, slope and adjacent deep sea. The Topo to Raster tool in ArcGIS was used to convert the final input data into a continuous 100 m resolution grid. The Topo to Raster tool (previously known as the TOPOGRID tool) is an interpolation method that uses a multi-resolution interpolation method, starting with a coarse raster and working toward the finer, user-specified resolution (for a detailed description of the interpolation procedure, see Hutchinson Reference Hutchinson1989). The Topo to Raster tool has been used in previous studies (e.g. Dickens et al. Reference Dickens, Graham, Smith, Dowdeswell, Larter and Hillenbrand2014, Hogg et al. Reference Hogg, Huvenne, Griffiths, Dorschel and Linse2016) and has proven to be a robust methodology for gridding a digital elevation model from a compilation of disparate datasets, integrating spatially discontinuous data with different sampling densities.
Given the diverse range and age of data sources, the data varied greatly in terms of collection method, quality and file format. The Topo to Raster tool treats each data point as equally valid and draws a spline between them, potentially creating steps in the data as it moves between points from different sources. This is inherently problematic given the variability in the quality of the data from different sources, specifically when regions of data points from different sources overlap (Hogg et al. Reference Hogg, Huvenne, Griffiths, Dorschel and Linse2016). To remove this artefact, we ranked our datasets hierarchically based on data quality. A spatial coverage mask of each dataset was used to remove regions of overlapping data, except for the best-quality data available from that particular region. A 500 m buffer from each mask was then used to create a region of no data on the boundaries between different data sources, thereby smoothing any abrupt changes during interpolation (Hogg et al. Reference Hogg, Huvenne, Griffiths, Dorschel and Linse2016).
The Topo to Raster algorithm averages out the data to generate a coarse-resolution grid that undergoes iterative interpolation cycles to produce successively finer-resolution grids until the user-defined resolution is obtained. After each iteration, the grid values are calculated using the Gauss-Seidel iteration with the over-relaxation method (Hutchinson Reference Hutchinson1989). Several iterations of the interpolation were required to identify and remove areas of anomalous results, including local pits and spikes and edge effects from the outer beams of multibeam swaths. The bathymetric grid (Fig. 2d) was produced at 100 m resolution to preserve the quality of newer multibeam data while achieving a compromise with the lower-resolution data sources (Dickens et al. Reference Dickens, Graham, Smith, Dowdeswell, Larter and Hillenbrand2014). The grid is projected in Universal Transverse Mercator (UTM) zone 42S and is available in ESRI ASCII, ESRI grid and geotiff formats. The grids are available to download from https://doi.org/10.26186/135334.
The CDBG represents the ‘best available’ data to date, but errors and uncertainties associated with data acquisition, processing and interpolation still exist. Factors including sea state, beam angle, sound velocity correction and signal-to-noise ratio may drastically affect sonar accuracy. The positional accuracy of legacy data is also uncertain. Exact uncertainties are difficult to establish for the grid, although potential vertical and horizontal errors of up to tens of metres for older soundings are probable. In comparison, the vertical and horizontal accuracy of data from modern multibeam systems with accurate Global Navigation Satellite System (GNSS) positioning is typically < 10 m.
Cape Darnley bathymetry grid
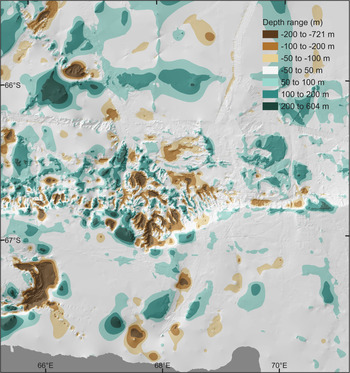
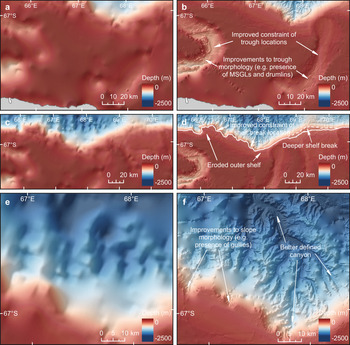
The Cape Darnley bathymetry dataset is a 100 m-resolution grid (Fig. 2d). It offers significant improvements over previous bathymetric representations of the Cape Darnley region, specifically in terms of the inclusion of previously unpublished, high-resolution multibeam datasets, the increased spatial resolution of the grid (100 m) and its geographical extent. The grid provides a considerable revision compared to the IBCSO compilation (Fig. 2c & d), with depth discrepancies of +600 and -700 m (Fig. 3). The compilation reveals:
1) Deeper and more extensive cross-shelf troughs (Nielsen and Burton basins), with a significant improvement in trough morphology (Fig. 4a & b);
2) An eroded outer shelf, deeper shelf break north of Fram Bank and improved constraint of shelf break location (Fig. 4c & d);
3) Better-defined canyon morphology, a much steeper continental slope and a better-resolved series of morphological features on the upper slope (i.e. shelf-incising canyon heads and upper slope gullies; Fig. 4e & f).
Depth differences between the Cape Darnley bathymetry grid (CDBG) and the International Bathymetric Chart of the Southern Ocean (IBCSO) grid. Brown and green colours indicate areas where depths in the CDBG are deeper and shallower than in the IBCSO grid, respectively.

Comparison of features between the Cape Darnley bathymetry grid (CDBG) and the International Bathymetric Chart of the Southern Ocean (IBCSO) grid, including cross-shelf troughs (a. and b.), the outer shelf and shelf break (c. and d.) showing the 550 m contour (solid line) and 700 m contour (dashed line) and the canyon and upper-slope gullies (e. and f.). MSGL = mega-scale glacial lineations.

The shelf in this region is narrow (< 100 km), and water depths on the shelf range from > 1100 m in the deepest basin to ~100 m on the shallower banks. Burton Basin widens towards the outer shelf with a ~300 m deep sill connecting the trough to the slope. The sill is ~100 m shallower than has been represented in previous bathymetry compilations (Fig. 3). Furthermore, the bathymetry data reveal that the troughs are deeper and more extensive than has been previously represented (Figs 3 & 4a).
The inclusion of high-resolution multibeam bathymetry data from within the troughs has significantly improved representations of their overall morphology and reveals the presence of glacial features, including mega-scale glacial lineations and drumlins, for the first time. These features have been previously reported in Nielson Basin (Leventer et al. Reference Leventer, Domack, Dunbar, Pike, Stickley and Maddison2006, Mackintosh et al. Reference Mackintosh, Golledge, Domack, Dunbar, Leventer and White2011), but they also occur in Burton Basin, and are now represented in a regional bathymetry grid for the area (Fig. 4a).
The shelf is dominated by low-relief banks, typically at 100–200 m water depth, which extend from the inner to the outer shelf. The shallow banks are eroded on the outer shelf and gradually deepen to the shelf break (Fig. 4c). Iceberg scours, often > 2 km long, indicate erosional processes. The outer shelf is composed of current-reworked and iceberg-scoured sediments and is influenced by strong bottom currents associated with the Antarctic Coastal Current, a strong westward-flowing shelf current (Harris & O'Brien Reference Harris and O'Brien1996).
The higher-resolution grid enables us to delineate the extent of the shelf itself far more accurately and provides sharper detail of the shelf break, including the presence of complex gully systems on the steep continental slope. The shelf edge is well defined and lies at ~550 m, except for north of Fram Bank, where the shelf break occurs at ~700 m (Fig. 4c). The shelf break typically lies 3–4 km north of its previously mapped position, leading to differences of > 700 m compared to previously mapped depths in some locations (Fig. 3).
The upper slope is steep (typically 6–10°), with the steepest slopes (20–25°) occurring in Wild and Daly canyons. Steep upper slopes are typical across most of the East Antarctic margin, where slopes range between 5° and 15° (Arndt et al. Reference Arndt, Schenke, Jakobsson, Nitsche, Buys and Goleby2013). The localized areas of steep slope within Wild and Daly canyons are amongst the steepest reported for the Antarctic margin.
The large, rugged, shelf-incising canyons are prominent features of the bathymetric compilation (Fig. 4e). Wild Canyon is > 100 km long and has a depth range of > 2500 m. The high-resolution bathymetry data reveal that the canyon incises the shelf in several locations. The overall size and scale of the canyons in the Cape Darnley region are similar in form to many other shelf-incising canyons around the Antarctic margin (Harris & Whiteway Reference Harris and Whiteway2011).
The heads of the canyons are dissected by gullies (Fig. 4e). These are small-scale (< 5 km), linear channels up to 4 km long. Shelf-break gullies also occur in areas distal to the canyon heads (e.g. seaward of Fram Bank). Such gullies are common around the Antarctic margin, forming from erosive turbidity currents generated by sediment-laden basal meltwaters derived from an ice sheet grounded at the shelf break (Noormets et al. Reference Noormets, Dowdeswell, Larter, Cofaigh and Evans2009, Gales et al. Reference Gales, Larter, Mitchell and Dowdeswell2013, Post et al. Reference Post, O'Brien, Edwards, Carroll, Malakoff and Armand2020).
A large, north-west-orientated sediment ridge (Wild Drift; Fig. 2d) occurs along the continental slope and rise, formed by turbidity-current re-deposition and subsequent contour-current transport of sediment derived from Prydz Bay (Whitehead et al. Reference Whitehead, Quilty, McKelvey and O'Brien2006). The data show that the eastern flank of Wild Drift is sharply eroded in some locations, with slopes of up to 20°, possibly due to mass wasting.
Implications
The CDBG reveals a number of new and significant seafloor features (e.g. upper-slope gullies, extensive iceberg scouring) and provides a marked improvement in the representation of previously known features (e.g. cross-shelf troughs, large canyons). The grid represents the best available bathymetry compilation of the Cape Darnley region to date and will have positive implications for a variety of scientific applications. Seafloor morphology plays an important role in many scientific disciplines such as ecology, hydrology and sedimentology, as geomorphic features can act as physical controls for species distribution, oceanographic flow paths or sedimentation processes (Jerosch et al. Reference Jerosch, Kuhn, Krajnik, Scharf and Dorschel2016).
Cape Darnley is one of only four sites of AABW production - a cold, dense water mass that forms in coastal polynyas on the continental shelf as a result of intense sea-ice formation and descends the continental slope to abyssal depths (Nakayama et al. Reference Nakayama, Ohshima, Matsumura, Fukamachi and Hasumi2014, Borchers et al. Reference Borchers, Dietze, Kuhn, Esper, Voigt, Hartmann and Diekmann2016). The formation of AABW is an important driver of ocean currents around the world (Orsi et al. Reference Orsi, Johnson and Bullister1999) and impacts global climate (Schmitz Jr, Reference Schmitz1995). Thus, an accurate understanding of the export of dense water into the deep ocean is important for assessing the global climate (Nakayama et al. Reference Nakayama, Ohshima, Matsumura, Fukamachi and Hasumi2014).
Export pathways of AABW from the Antarctic margins to the deep Southern Ocean are strongly controlled by the bottom topography (Kusahara et al. Reference Kusahara, Williams, Tamura, Massom and Hasumi2017). Recent oceanographic studies have identified potential export pathways of bottom water formed within the Cape Darnley polynya (Ohshima et al. Reference Ohshima, Fukamachi, Williams, Nihashi, Roquet and Kitade2013, Nakayama et al. Reference Nakayama, Ohshima, Matsumura, Fukamachi and Hasumi2014, Williams et al. Reference Williams, Herraiz-Borreguero, Roquet, Tamura, Ohshima and Fukamachi2016), but they have all noted the lack of bathymetry and inherent errors in the available bathymetric datasets, particularly for the coastal region surrounding Cape Darnley.
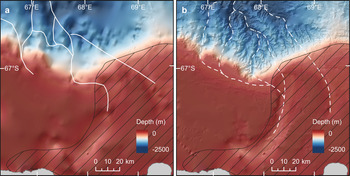
The bathymetry grid provides the first detailed insights into potential bottom-water transport pathways from the Cape Darnley polynya (Fig. 5a). The morphology of the margin and slope is highly significant for controlling pathways of bottom-water export from the shelf, and an accurate delineation of the shelf edge can be considered a basic requirement of successful ocean models (Graham et al. Reference Graham, Nitsche and Larter2011). The grid offers, for the first time, a sharp definition of the continental margin that was absent from previous compilations. Furthermore, the morphology of Burton Basin, the location of the sill and the detailed canyon morphology indicate pathways for descending dense water that may differ compared to those proposed by Nakayama et al. (Reference Nakayama, Ohshima, Matsumura, Fukamachi and Hasumi2014) (Fig. 5b). Future models of ocean circulation in the Cape Darnley region must properly account for the refined morphology of the cross-shelf troughs, shelf-incising canyons and sill location. Model results based on the bathymetry compilation may vary considerably compared to previous compilations and could impact estimates of AABW export.
a. Potential bottom-water export pathways identified in the Cape Darnley bathymetry grid (dashed lines) compared to b. export pathways estimated from previous datasets by Nakayama et al. (Reference Nakayama, Ohshima, Matsumura, Fukamachi and Hasumi2014) (solid lines). Cape Darnley polynya (hashed polygon) derived from Williams et al. (Reference Williams, Herraiz-Borreguero, Roquet, Tamura, Ohshima and Fukamachi2016).

The general morphology of the continental shelf, slope and rise is comparable to other parts of the Antarctic continental margin; however, coverage of high-quality bathymetry data is still uneven, with many large gaps (Fig. 2b). The seafloor bathymetry is still unknown in areas adjacent to the coastline due to the presence of fast ice (Fraser et al. Reference Fraser, Massom, Ohshima, Willmes, Kappes, Cartwright and Porter-Smith2020) preventing dedicated seafloor mapping in this area. Much of the coastal bathymetry is interpolated. However, the bed elevation along this part of the coastline is based on recent airborne radar missions with relatively low uncertainty compared to other parts of the coast (Fretwell et al. Reference Fretwell, Pritchard, Vaughan, Bamber, Barrand and Bell2013), suggesting that the subice topographic data provide a reasonable indication of depth along the coastline. The depth accuracy varies, being highest in areas with modern multibeam cover, but containing significant uncertainties in the large interpolated areas.
Further improved bathymetry through detailed multibeam mapping of the shelf and slope is needed to determine the full extent and morphology of the cross-shelf troughs, upper-slope gullies and shelf-incised canyons in the Cape Darnley region. Many of these features are of interest to biodiversity studies. For example, a study of upper-slope gullies along the Sabrina Coast, East Antarctica, has shown that they are an important benthic habitat, with distinct benthic communities compared to the adjacent continental shelf (Post et al. Reference Post, O'Brien, Edwards, Carroll, Malakoff and Armand2020). Furthermore, benthic ecosystems in shelf-incising canyons are known to contain greater diversity and biomass than non-incising canyons (Harris & Whiteway Reference Harris and Whiteway2011). Marine conservation strategies therefore need to consider slope and shelf benthic communities as distinct and equally important components of the Antarctic ecosystem, but this requires adequate information on the distribution and extent of these seafloor features. Other parts of the Antarctic slope (e.g. George V Land) with active AABW flows demonstrate the important interplay between canyon morphology, bottom-water flow pathways and the occurrence of vulnerable marine ecosystems dominated by hydrocorals (Post et al. Reference Post, O'Brien, Beaman, Riddle and De Santis2010). Knowledge of benthic communities in the Cape Darnley region is lacking, yet the oceanographic and bathymetric setting of the region suggests that the upper slope may be a suitable habitat for hydrocorals with unique and diverse benthic ecosystems. Furthermore, the region is within a proposed Marine Protected Area, so any benthic community information will support the development of monitoring and management plans for East Antarctica.
Accurate bathymetry data are the key to understanding the ecology of Antarctic marine fauna. For example, krill concentrations, which control the distribution and breeding success of seals, penguins and whales, are heavily influenced by bathymetry (Ribic et al. Reference Ribic, Chapman, Fraser, Lawson and Wiebe2008), with higher densities of krill often recorded over shelf breaks (Silk et al. Reference Silk, Thorpe, Fielding, Murphy, Trathan, Watkins and Hill2016). A recent marine voyage to the Cape Darnley region (RV Investigator IN2021_V01) aimed at monitoring krill abundance required accurate bathymetry data for survey planning in order to focus their efforts (S. Kawaguchi, personal communication 2020).
Future improvements to the Cape Darnley grid may be achieved through targeted seafloor mapping in areas not yet visited by research vessels and continued international collaboration to draw together all available data to update the high-resolution bathymetric map of the region. Priority areas for future multibeam mapping include the sill between Burton Basin and Wild Canyon as the export pathway for AABW and the continental shelf and upper slope to identify potential import and/or export pathways of ocean currents across the shelf break. The shelf and slope are also important marine habitats (Raymond et al. Reference Raymond, Lea, Patterson, Andrews-Goff, Sharples and Charrassin2014) and Areas of Ecological Significance (Hindell et al. Reference Hindell, Reisinger, Ropert-Coudert, Hückstädt, Trathan and Bornemann2020) due to the availability of suitable breeding or resting habitats, and they currently have sparse data coverage (see Fig. 2b).
Conclusions
This compilation of Cape Darnley bathymetry represents a major improvement in seafloor morphological information in this region, with five times the resolution (100 × 100 m vs 500 × 500 m) and individual depth soundings constraining almost twofold more area of the Cape Darnley region (21% vs 11.7%) than the IBCSO grid released in 2013. Modern multibeam bathymetry comprises 19.2% in CDBG v1 compared to 4.6% in IBCSO. Thus, CDBG v1 is the most detailed compilation for the Cape Darnley region to date, revealing large cross-shelf basins, shallow banks and sills, upper-slope gullies, escarpments and a shelf-incising canyon. Our dataset highlights areas still lacking bathymetric constraint. The compilation will be a key dataset for incorporation into simulations of AABW export from the Cape Darnley polynya and will enable the broader scientific community to undertake research informed by a detailed understanding of the region's seafloor.
Acknowledgements
The authors acknowledge all personnel involved in the collection of the bathymetry data used in this compilation. The Japan Coast Guard officially provided the bathymetric data obtained on board the icebreaker Shirase during the Japanese Antarctic Research Expedition. Bathymetry data provided courtesy of the National Institute of Polar Research (Yoshifumi Nogi), the Alfred Wegener Institute, the Helmholtz Centre for Polar and Marine Research (Boris Dorschel), NSF #9909367 (Amy Leventer) and the Australian Antarctic Division. We thank Mark Matthews (IX Survey) for assistance in data processing. We thank S. Nichol and Z. Huang from Geoscience Australia for their constructive reviews. We also thank the anonymous reviewers for their constructive feedback. J. Smith publishes with approval of the CEO, Geoscience Australia.
Financial support
This research was supported by a Japanese Society for the Promotion of Science (JSPS) Invitation Fellowship for Research in Japan (Short-Term) awarded to Dr Jodie Smith in 2016 (ID No. S16709). Professor Yoshifumi Nogi, from the National Institute of Polar Research, was the Host Researcher.
Author contributions
JS wrote the manuscript and completed the data compilation. YN co-led the project, was Host Researcher for the JSPS Fellowship and provided the Japanese datasets. MS completed the multibeam bathymetry processing and contributed to the ‘Methods’ section. BD and AL contributed bathymetry datasets. All authors reviewed and edited the manuscript.
Details of data deposit
The data can be downloaded from https://doi.org/10.26186/135334.