




No CrossRef data available.
Article contents
Vigilance and fatigue following traumatic brain injury
Published online by Cambridge University Press: 23 January 2006
Abstract
Research findings have suggested that individuals with traumatic brain injury (TBI) show greater psychophysiological and subjective costs associated with performing vigilance tasks, but have not examined relationships with fatigue. The present study aimed to investigate vigilance and its relationship with subjective and objective fatigue measures. Forty-six TBI participants and 46 controls completed a 45-minute vigilance task. They also completed a subjective fatigue scale (the VAS-F) and a selective attention task before and after the vigilance task, and had their blood pressure (BP) monitored. TBI participants performed at a lower level on the vigilance task, but performed at a similar level across the duration of the task. Higher subjective fatigue ratings on the VAS-F were associated with more misses on the vigilance task for TBI participants. TBI participants showed greater increases in diastolic BP, and these were associated with greater increases in subjective fatigue ratings on the VAS-F. A subgroup of TBI participants showed a decline in performance on the vigilance task and also showed disproportionate increases in subjective fatigue. Findings provide support for the coping hypothesis, suggesting that TBI individuals expend greater psychophysiological costs in order to maintain stable performance over time, and that these costs are also associated with subjective increases in fatigue. (JINS, 2006, 12, 100–110.)
Information
- Type
- Research Article
- Information
- Journal of the International Neuropsychological Society , Volume 12 , Issue 1 , January 2006 , pp. 100 - 110
- Copyright
- © 2006 The International Neuropsychological Society
INTRODUCTION
Many studies have reported fatigue as one of the most common symptoms following mild, moderate, and severe traumatic brain injury (TBI), with the reported prevalence ranging from 32.4% to 73% at five years postinjury (van Zomeren & van den Burg, 1985; Evans, 1992; Middleboe et al., 1992; Dikmen et al., 1993; Masson et al., 1996; Olver et al., 1996; van der Naalt et al., 1999; Seel et al., 2003; Vitaz et al., 2003). Despite this, there have been remarkably few studies investigating fatigue or its causes.
Aaronson and colleagues (1999) have defined fatigue as “the awareness of a decreased capacity for physical and/or mental activity due to an imbalance in the availability, utilization, and/or restoration of [physiological or psychological] resources needed to perform activity” (p. 46). Within this framework, deficiencies of physiological resources resulting in impaired speed of processing, attention and/or arousal could arguably be causes of fatigue following TBI. Consistent with this premise, in 1984 van Zomeren and colleagues proposed the coping hypothesis, which postulated that fatigue is due to the additional compensatory effort expended by brain injured individuals in meeting the demands of everyday life in the presence of cognitive deficits. This hypothesis was based on findings demonstrating that performance on a vigilance task was associated with more alert EEG patterns in TBI patients, suggesting they were expending more energy to meet task demands relative to neurologically intact controls. In another small study by Riese et al. (1999), head-injured participants reported greater subjective mental load, more visual complaints, and differed from controls on a cardiovascular index of distress, namely systolic blood pressure (BP), while performing a 50-minute sustained attention task, suggesting greater costs associated with sustaining attention. No studies, however, have examined the association between subjective fatigue levels and performance on vigilance tasks.
Sustained attention, vigilance, or alerting describes the ability to sustain alertness to high priority stimuli over long periods. Level of arousal may affect performance on vigilance tasks (Parasuraman, 1984). Evidence suggests that brainstem structures and the frontal lobes (particularly in the right hemisphere) are involved in these processes and damage to these structures is common following TBI (Posner & Peterson, 1990; Bigler, 2001; Sturm & Willmes, 2001).
Studies investigating sustained attention and vigilance following TBI have employed tasks of varying complexity, differing on dimensions including frequency, duration, and quality of stimuli (i.e., degraded vs. nondegraded), interstimulus interval, and task duration (Riccio et al., 2002). Vigilance tasks combining a fast event rate, memory load, and low signal salience have been described by Parasuraman et al. (1998) as being more demanding and are more likely to produce a vigilance decrement due to a decline in sensitivity. Most studies have reported an impaired level of performance by TBI participants in terms of slower reaction times (RTs) and a greater number of errors or missed targets, but have not demonstrated disproportionate decline in performance over time for TBI groups (Brouwer & van Wolffelaar, 1985; Ponsford & Kinsella, 1992; Riese et al., 1999; Spikman et al., 1996; van Zomeren et al., 1988; Zoccolotti et al., 2000). One study by Whyte et al. (1995) did show a significantly greater time-on-task effect for TBI participants on a Go–No-Go task of 14 minute duration, possibly due to specific demands of the task employed, such as the short stimulus durations (Leclercq & Azouvi, 2002). It remains unclear, however, as to how performance on vigilance tasks relates to subjective experiences of fatigue following TBI.
Increasing variability in performance over the duration of a vigilance task may also reflect fatigue (Cohen & Sparling-Cohen, 1993). For example, multiple sclerosis (MS) patients have shown increasing performance inconsistency over the duration of a mentally effortful task, interpreted as characteristic of fatigue (Cohen & Fisher, 1989). Stuss and colleagues (2003) have suggested that such variability may also characterize the sustained performance of patients with frontal lobe lesions. Greater intraindividual variability in RT (measured by both the coefficient of variation and variance) has been reported in TBI participants (Stuss et al., 1994). However, van Zomeren and Brouwer (1994) have concluded that there is no specific increase in intraindividual variability in RT studies following TBI, with increases in variability being proportional to increases in RT.
A high proportion of individuals develop depression following TBI (Hibbard et al., 1998; Kreutzer et al., 2001), and higher rates of depression have been reported in TBI participants with complaints of fatigue relative to those who are not fatigued (Walker et al., 1991). Furthermore, depressed individuals have been found to make more errors on the Sustained Attention to Response Task (SART), suggesting that depression may contribute to attentional difficulties (Farrin et al., 2003). Therefore, depression may potentially mediate the relationship between vigilance and fatigue.
Measurement of fatigue is problematic, as there are no established and widely accepted objective or subjective fatigue measures in TBI populations. LaChapelle and Finlayson (1998) found that patients with brain injury of mixed etiology reported significantly greater levels of fatigue on the Fatigue Severity Scale (FSS), a subjective self-report measure of the impact of fatigue on activities in daily life. Brain-injured participants also reported significantly less vigor on the vigor subscale of the Visual Analogue Scale for Fatigue (VAS-F). Stuss et al. (1989) attempted to measure fatigue “objectively” by comparing performance on a simple RT task at the beginning and end of a one-hour testing session. Fatigue was operationalized as increased reaction times at the end of the session, but no significant fatigue effect was found for either TBI or control participants. It was unclear how fatigue, as operationalized in this study, related to subjectively experienced fatigue, as no subjective fatigue measure was administered.
The present study aimed to investigate vigilance and its relationship with subjective and objective measures of fatigue in patients with TBI. Based on previous research, the following hypotheses were formulated: (1) TBI participants would demonstrate a reduced level of performance on a vigilance task, but would not necessarily show a greater vigilance decrement or greater increases in intraindividual variability after controlling for RT differences; (2) that there would be a relationship between vigilance performance and subjective fatigue reported on the FSS and VAS-F, and that this relationship might be affected by the presence of depression; (3) that completion of the vigilance task would be associated with greater increases in fatigue as measured subjectively on the VAS-F and as measured objectively in terms of decline in performance on a selective attention task; (4) completion of the vigilance task would be associated with greater increases in physiological stress, as measured by change in BP; and (5) there would be a relationship between increases in measures of physiological stress (BP) and subjective and objective fatigue measures.
METHOD
Research Participants
Participants with mild to severe TBI were recruited from Epworth Rehabilitation Centre, Melbourne, Australia, following discharge from inpatient care. Controls of similar age and educational background were recruited from the general community. All participants were aged 16–60, had adequate physical and cognitive abilities and understanding of English to complete the tasks, had no history of previous neurological disturbance, and were not using illicit drugs. All participants meeting these criteria were asked by a hospital staff member to participate in the study, and those agreeing to participate were then contacted by the researcher following discharge. No comparisons were possible between those who did and did not agree to be contacted, as consent could not be obtained to access demographic and medical details for those that declined participation. Control participants had no history of brain injury or other neurological illness.
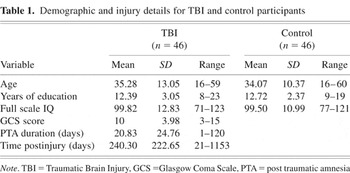
Demographic and injury details are shown in Table 1. There were no significant differences between the TBI and control groups in age, gender, IQ, or years of education. With regard to distribution of Glasgow Coma Scale (GCS) scores, 36.4% scored 13–15, 31.8% scored 9–12, and 31.8% scored 3–8. Examination of post-traumatic amnesia (PTA) duration distribution showed 39% of patients had a PTA duration of <7 days, 37% had a PTA duration of 7–28 days, and 24% had a PTA duration of >28 days. Approximately 24% of TBI participants were tested at less than 3 months, 59% were tested between 3 months and 1 year, and 17.4% were tested >1 year postinjury.
Demographic and injury details for TBI and control participants

Measures
Participants completed a questionnaire documenting their age, occupation, educational background, drug and alcohol history, medical and psychiatric history, and previous head injuries. They completed the National Adult Reading Test (NART; Nelson & Willison, 1991), a reading test comprising irregularly spelt words, used as a measure of estimated premorbid intellectual ability. Other measures included:
Vigilance task
The vigilance task was designed to increase the probability of loss of sensitivity to signals and requires considerable mental effort for successful completion, by combining a fast rate of stimulus presentation, a low target frequency, and a memory load (Parasuraman et al., 1998). The task was constructed and run with E-Prime 1.1 (E-Studio), Psychology Software Tools on a Toshiba laptop computer. Stimuli consisted of black letters (Courier New font, 38 point size) appearing at the center of the computer screen. Stimulus duration was 1,000 ms and there was no interstimulus delay, resulting in a very short period of blurring at the time of stimulus changeover. There were a total of 2,424 stimuli, with 2,324 foils and 50 target stimuli letter pairs (‘WT’). Two button boxes were placed 40 cm in front of the computer screen, 13 cm apart. Right handed participants were required to depress the right button with their right index finger until letter T preceded letter W, when they were to move this finger to press the left button. This was reversed for left-handed participants. Feedback regarding correctness of response was displayed for 1,500 ms after each target pair. The total duration of the vigilance task was approximately 45 minutes. Measures included total RT (time between display onset of letter T and pressing of left button), decision time (DT; time between display onset of letter T and release of right button), movement time (MT; total RT minus DT) and number of missed targets (misses). Practice trials, with 80 stimuli including 76 foils, and two target pairs preceded task performance. Correct responses to both target pairs were required before proceeding to the vigilance task.
Complex Selective Attention Task (C-SAT)
The C-SAT was administered before and after the vigilance task, and differences in performance were examined as an “objective” measure of fatigue. This task was designed as an attentional measure which required controlled processing and had a high executive working memory load, as TBI participants have greater difficulty on such tasks (Azouvi et al., 1996; Park et al., 1999; Leclercq et al., 2000). The task was constructed and run with E-Prime 1.1 (E-Studio), Psychology Software Tools. Eighty stimuli, comprising letters and numbers in green or red, were sequentially displayed at the center of a Toshiba laptop monitor. Participants responded with their dominant index finger, pressing one of two buttons positioned 40 cm in front of the computer screen, 13 cm apart. They were required to press the left button if a green letter or red number appeared, and the right button if a red letter or green number appeared. The stimuli were terminated when a response was recorded or after a maximum exposure time of 4000 ms. Feedback about the correctness of response (i.e., “correct,” “incorrect,” or “no response detected”) was then displayed for 1500 ms. The next stimulus was presented immediately following the feedback. At the start of the task and while receiving feedback, participants placed their finger at a central point 13 cm away from each response button. RTs were recorded in milliseconds. Test performance was preceded by practice trials on a version of the C-SAT comprising 20 stimuli. Cards with green letter/red number and red letter/green number were placed beside the left and right buttons, respectively. The practice trial was repeated no more than four times, or until the participant made three errors or less on the last 10 items. One TBI participant did not reach criterion on the practice trial, and was excluded from analyses.
Subjective fatigue measures
Although many subjective fatigue measures have been developed, few have been validated within a TBI sample. LaChapelle and Finlayson (1998) used three subjective fatigue measures in individuals with acquired brain injury [i.e., the FSS, the VAS-F, and the Fatigue Impact Scale (FIS)]. The FSS and VAS-F were selected for use in the present study on the basis of their brevity, and because they measured distinct aspects of fatigue. The FIS was not used because of its length, which made it more difficult for TBI patients to complete, and because all subscales had been found to be moderately to highly correlated with the FSS.
The FSS (Krupp et al., 1989) was used to assess the behavioral consequences and impact of fatigue on daily functioning in a general sense. The scale contained nine items including, “Fatigue causes frequent problems for me,” “Fatigue interferes with my physical functioning,” and “Fatigue interferes with carrying out certain duties and responsibilities.” Studies using the FSS have shown it has acceptable internal consistency, shows stability over time, is sensitive to clinical changes, and distinguishes between brain-injured patients and noninjured control participants (Krupp et al., 1989; LaChapelle & Finlayson, 1998).
The VAS-F (Lee et al., 1991) was used as a measure of subjective fatigue levels at a given point in time. It is an 18-item measure requiring the participant to circle a number between 1 and 10, indicating current subjective fatigue and vigor levels. The scale contains a fatigue subscale and a vigor subscale. Items include “Not at all tired” versus “Extremely tired” and “Not at all energetic” versus “Extremely energetic.” Research has shown this scale to be a reliable and valid measure of fatigue (Lee et al., 1991; Winstead-Fry, 1998; Meek et al., 2000), and the vigor subscale of the VAS-F has been shown to differentiate between head-injured participants and control participants (Lee et al., 1991; LaChapelle & Finlayson, 1998).
The Hospital Anxiety and Depression Scale (HADS; Snaith & Zigmond, 1994) is a 14-item scale containing two separately scored subscales of anxiety and depression. While the HADS was initially designed as a measure of anxiety and depression in nonpsychiatric hospital settings, it has also been shown to be a valid and reliable measure in other settings and populations (Snaith & Zigmond, 1994; Harter et al., 2001; Caci et al., 2003). It is also relatively unaffected by concurrent physical illness.
Procedure
Ethics approval was obtained from relevant hospital and university ethics committees, and all participants (and/or their legal guardians) provided informed consent prior to participating in the study. Medical details, including GCS scores taken upon admission to acute hospital care and duration of PTA, were obtained from hospital records. PTA duration was determined by prospective monitoring using the Westmead PTA Scale (Shores et al., 1986). Participants first completed the background questionnaire, FSS, HADS, and NART. After completing several attentional measures as a part of a larger study over approximately 10 minutes, participants then completed the VAS-F, C-SAT, and vigilance task. In order to assess fatigue following completion of the vigilance task, the VAS-F and C-SAT were then readministered. A BP reading was also taken before and after the vigilance task was completed.
RESULTS
Hypothesis 1: Vigilance Task Performance
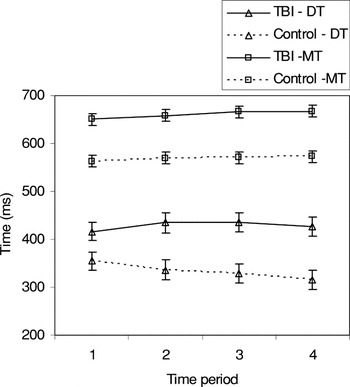
Mean decision time (DT), movement time (MT), and misses were calculated for four approximately equal time periods of the vigilance task. Figure 1 shows the mean DT for correct responses on the vigilance task for both groups over the four phases of the task. A two-way analysis of variance (ANOVA) with time phase as a repeated measures factor and group as a between subjects factor showed that the mean DT of TBI participants was significantly slower than that of controls, F(1,90) = 13.35, p < .001. While there was no significant time-on-task effect across both groups, F(3,270) = .95, p = .42, there was a significant Group × Time-on-task Interaction, F(3,270) = 3.10, p = .03. Separate repeated measures ANOVAs for TBI and control participants revealed a significant time-on-task effect for control participants, with DTs for the control group becoming faster over the duration of the task, F(3,135) = 4.29, p = .006. There was no significant change in mean DT for TBI participants over the four time periods, F(3,135) = .77, p = .52.

Mean decision time (DT) and movement time (MT) (±SE) for TBI (n = 46) and control (n = 46) participants over four time periods of the vigilance task.
Mean MTs for correct responses for both groups are also shown in Figure 1. A two-way ANOVA showed that the mean MT for the TBI group was significantly slower than that of the control group, F(1,88) = 32.97, p < .001. There was, however, no significant time-on-task effect F(3,264) = 2.26, p = .08, or significant Group × Time-on-task Interaction, F(3,264) = .25, p = .86.
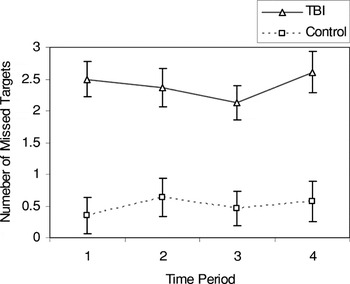
The mean number of misses for TBI and control groups over the duration of the vigilance task is shown in Figure 2. TBI participants missed significantly more targets than controls, F(1,90) = 31.36, p < .001. There was, however, no significant time-on-task effect across groups, F(3,270) = .81, p = .49, and no significant Group × Time-on-task Interaction, F(3,270) = .70, p = .55.

Mean number of missed targets for TBI (n = 46) and control participants (n = 46) over four time periods of the vigilance task.
Several issues were considered in assessing within subject variability in performance on the vigilance task. It has been argued that SD is not a good measure of variability, as it is influenced by RTs (Segalowitz et al., 1997). The coefficient of variation for DT (SD of DT divided by mean DT) was therefore calculated as an index of variability, but was also found to be significantly and positively correlated with mean DT. To overcome this association, regression was utilized to compute the variability that each participant would have generated had their mean DT been average (i.e., average DT across all time periods and groups being 381.19 ms). The following equation was utilized to compute the residual: SD = .391, × Mean + Residual. Therefore, Residual = Standard Deviation − 3.91 × Mean. Second, the following equation was utilized to estimate the variability when the mean RT is 381.19 ms: Adjusted Variability = .391 × 381.19 + Residual. A two-way ANOVA was conducted to examine change in adjusted variability, with time period as a within subject factor and group as a between subject factor. There was a significant time-on-task effect across both groups, with a significant increase in variability over time, F(3,267) = 4.18, p = .006. There was, however, no difference between groups in adjusted variability, F(1,89) = .16, p = .69, and no Group × Time-on-task interaction, F(3,267) = .53, p = .66.
As a group, TBI participants did not show a decline in performance over time on measures of DT, MT, or number of missed targets. However, examination of individual data revealed that a proportion of participants were showing an increase in DT over the four time phases of the vigilance task. This was examined statistically by calculating a percentage change variable (Time Four mean DT − Time One mean DT, divided by Time One mean DT, × 100). Twenty-four TBI participants (52.17%) showed a positive percentage change (i.e., greater mean DT at Time Four compared with Time One), compared with 22 TBI participants (47.8%) who showed a negative percentage change (i.e., greater mean DT at Time One compared with Time Four). A significantly greater proportion of TBI participants showed a positive percentage change compared with controls (n = 14, 30.4%), χ2(1) = 4.48, p = .03. A one-way between groups multivariate analysis of variance (MANOVA) revealed no significant differences in age, years of education, IQ, duration of PTA, GCS, or time since injury, between TBI participants showing an increase in mean DT over time on the vigilance task (referred to as ‘TBI decrement group’) and those that showed a decrease in mean DT over the same time periods (referred to as ‘TBI no decrement group’), F(6,35) = .23, p = .96.
Hypothesis 2: Vigilance Performance in Relation to Subjective Fatigue Measures
No significant correlations were evident between the FSS or VAS-F subscales and mean DT or MTs for the four time periods, or over the duration of the task for TBI participants. However, higher previgilance VAS-F fatigue ratings were significantly associated with more missed targets in the first and second periods (r = .39, p = .007 and r = .29, p = .05, respectively) and total misses over the entire vigilance task (r = .33, p = .03) in TBI participants. Number of missed targets in the first time period of the vigilance task were also correlated with previgilance VAS-F vigor ratings (r = .−.34, p = .02), with lower vigor associated with more misses. With regard to adjusted variability, lower previgilance VAS-F vigor levels were associated with higher variability across all four time periods (correlations ranging from r = −.35, p = .02 to r = .−36, p = .02), and higher previgilance fatigue ratings were associated with greater variability over the first two time periods of the vigilance task (r = .38, p = .01 and r = .32, p = .03, respectively) in TBI participants.
Partial correlation coefficients were calculated to control for the potential effects of anxiety and depression on the relationship between subjective fatigue ratings and vigilance performance in TBI participants. Previgilance VAS-F fatigue ratings were still significantly correlated with number of misses in the first and second time periods (r = .48, p = .05 and r = .49, p = .05, respectively), and the correlation for total number of misses on the vigilance task approached significance (r = .46, p = .07). There was no longer a significant correlation with adjusted variability during any time phase. Previgilance VAS-F vigor ratings were no longer significantly correlated with misses during any phase of the vigilance task, but lower vigor was still significantly associated with greater adjusted variability in the second and fourth time periods (r = −.59 p = .01 and r = −.48, p = .05, respectively).
Hypothesis 3a: Impact of Performing a Vigilance Task on Subjective and Objective Fatigue Measures
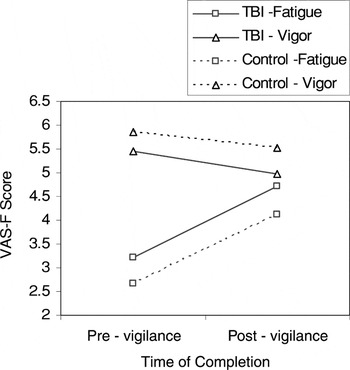
Mean scores on the VAS-F administered before and after the vigilance task are shown in Figure 3. Separate two-way ANOVAs were conducted to examine changes in subjective fatigue and vigor subscale scores on the VAS-F over time, where time of completion was a repeated measures factor and group was a between-subject factor. On the vigor subscale of the VAS-F, there was a significant effect for time of completion, with both groups reporting significantly less vigor after completing the vigilance task, F(1,90) = 5.86, p = .017. There were, however, no significant differences between groups in VAS-F vigor subscale scores, F(1,90) = 1.53, p = .22, and no significant Group × Time of completion interaction, F(1,90) = .22, p = .64. Similarly, on the fatigue subscale of the VAS-F, there was a significant effect for time of completion, with significant increases in fatigue levels after completion of the vigilance task in both groups, F(1,90) = 77.22, p < .001. There were no significant differences between groups on the fatigue subscale, F(1,90) = 1.56, p = .21, and no significant Group × Time of completion interaction, F(1,90) = .01, p = .95.

Mean scores on the VAS-F fatigue and vigor subscales completed prior to and following the vigilance task for TBI (n = 46) and control participants (n = 46).
Changes in VAS-F scores were examined separately for TBI decrement and no-decrement groups. Mean scores on subscales of the VAS-F for these two groups are shown in Figure 4. Separate two-way ANOVAs were conducted to examine changes in scores on the vigor and fatigue subscales of the VAS-F, with time of completion as a repeated measures factor and group as a between subjects factor. A significant Group × Time of completion interaction was found for fatigue scores, F(1,44) = 4.63, p = .04, with the ‘TBI decrement group’ showing a disproportionate increase in reported fatigue following the vigilance task. There was a trend for both groups to report less vigor following completion of the vigilance task, F(1,44) = 3.21, p = .08, but there were no significant differences between groups on the vigor scale, F(1,44) = .94, p = .34, and no significant Group × Time of completion interaction, F(1,44) = .39, p = .53.

Mean scores on the VAS-F for TBI who showed a decrease in mean DT in phase four of the vigilance task relative to phase one (n = 22), and for TBI participants who showed an increase in mean DT over the same time periods (n = 24).
Impact of performing the vigilance task was also assessed objectively by examining performance on the C-SAT administered before and after the vigilance task. Mean RT and number of errors are shown in Table 2. Separate two-way ANOVAs were conducted examining changes on C-SAT measures, where time of completion was a repeated measures factor and group was a between subjects factor. Analysis of mean RT showed a significant main effect for time of completion, with both groups achieving significantly faster RTs when completing the C-SAT after the vigilance task, F(1,89) = 146.43, p < .001. There was also a significant main effect for group, with the overall RT of TBI participants being slower than that of controls, F(1,89) = 10.76, p = .001. There was, however, no significant Group × Time of completion interaction, F(1,89) = 2.30, p = .13. Examination of mean number of errors revealed a significant main effect for group, with TBI participants making significantly more errors on both administrations F(1,89) = 9.42, p = .003. There was no significant main effect for time of completion, F(1,89) = .25, p = .62, and no significant Group × Time of completion interaction, F(1,89) = 2.67, p = .11.
Means and standard deviations for mean RT and number of errors on the C-SAT before and after the vigilance task for TBI (N = 45) and control participants (N = 46)

A series of two-way ANOVAs with time of completion as a repeated measures factor and group as a between subjects factor were conducted to examine differences for the TBI decrement and TBI no-decrement groups in performance on C-SAT measures. No significant differences between the TBI decrement and TBI no-decrement groups, or Group × Time of completion interaction were found in mean RT or number of errors.
A percentage change variable was calculated for mean RT on the C-SAT (Time Two Mean RT − Time One Mean RT divided by Time One Mean RT × 100). Percentage of change in RT was not significantly correlated with subjective fatigue measures.
Hypothesis 3b: Impact of Performing Vigilance Task on BP
Change in BP readings taken before and after the vigilance task were examined by calculating separate percentage change variables for diastolic and systolic BP (Time Two reading − Time One reading divided by Time One reading × 100). These results are shown in Table 3. A one-way ANOVA revealed a significant difference between TBI and control participants in percentage change in diastolic BP, F(1,38) = 7.79, p = .008, but not systolic BP, F(1,38) = 1.49, p = .23.
Means and standard deviations for percentage change in diastolic and systolic BP for TBI (n = 21) and control participants (n = 18)

A one-way between groups MANOVA was conducted to examine percentage of change in diastolic and systolic BP in the TBI decrement and TBI no-decrement groups. This revealed no overall significant differences between groups, F(2,36) = 1.83, p = .18.
Greater positive change in systolic BP in TBI participants was associated with slower DTs in the second and third time periods of the vigilance task (r = .44, p = .04 and r = .43, p = .05, respectively), but with lower variability in the third and fourth time periods of the vigilance task (r = −.45, p = .04 and r = −.53, p = .02, respectively).
Hypothesis 3c: Relationship between Change in BP and Change in Fatigue Measures
Pearson product-moment correlations were calculated to examine the relationship between percentage change in BP and percentage change in VAS-F scores for TBI participants. Increases in diastolic BP were significantly associated with increases in subjective appraisal of fatigue, r = .45, p = .04, but not with percentage change in vigor scores, r = −.19, p = .40. Change in systolic BP was not significantly correlated with changes in fatigue (r = −.04, p = .86) or vigor scores (r = −.30, p = .19) on the VAS-F.
DISCUSSION
The present study aimed to investigate the relationship between vigilance and fatigue following TBI. It was hypothesized that TBI participants would demonstrate a reduced level of performance on the vigilance task, but would not show a greater vigilance decrement or show greater increases in intraindividual variability over the duration of the task. This hypothesis was supported, with TBI participants demonstrating a lower level of vigilance, as measured by mean DT, MT, and number of missed targets over the duration of the task. TBI participants (as a group) did not show a decline in performance in terms of RTs and misses. Furthermore, there were no significant differences between TBI and control participants in intraindividual variability on the vigilance task after controlling for differences in RTs, with both groups showing increases in variability over the duration of the task. These findings are consistent with those of previous research (Brouwer & van Wolffelaar, 1985; van Zomeren et al., 1988; Ponsford & Kinsella, 1992; Spikman et al., 1996; Riese et al., 1999; Zoccolotti et al., 2000).
It has previously been asserted that decline in performance or increases in variability over time on vigilance tasks represents a form of behavioral fatigue (Cohen & Sparling-Cohen, 1993). Findings from the present study suggest that these behavioral indices do not represent the fatigue experience for the TBI group as a whole, at least on the vigilance task used in this study. However, a greater proportion of TBI participants showed a positive percentage change in RT on the vigilance task compared with controls, suggesting that at least a proportion of the group did show a decline in performance over time. Moreover, TBI participants did show a different pattern of vigilance task performance over time, failing to exhibit the decline in DT which was evident in control participants, who appeared to benefit from practice on the task. TBI participants who showed a decline in vigilance performance did not differ from those who did not on the demographic or injury severity variables measured. It remains possible that the absence of significant differences between the TBI decrement and no-decrement groups was due to limited power, which could potentially be increased by greater participant numbers. It is also possible that variables such as site or extent of diffuse axonal injury might be associated with a decline in vigilance performance over time. Inclusion of brain imaging in future studies would help clarify this issue.
The hypothesis that reduced vigilance would be associated with higher subjective fatigue levels in TBI participants was partially supported. No relationship was evident between ratings on the VAS-F subscales and MT or DT measures on the vigilance task. However, subjective previgilance fatigue and vigor levels were significantly correlated with number of missed targets and adjusted intraindividual variability in some periods of the vigilance task in TBI participants, even after controlling for the effects of depression and anxiety. In contrast, no relationship was found between indices of vigilance performance and the FSS, a measure of behavioral consequences and impact of fatigue on daily functioning in TBI participants. These findings suggest that vigilance performance is related to levels of fatigue (independent of depression and anxiety) experienced immediately before completing the vigilance task, but not to more general consequences of fatigue experienced in daily life.
Arousal is a possible mediator of the relationship between vigilance performance and subjective fatigue, as suggested by evidence of a strong association between level of vigilance performance and arousal (Parasuraman, 1984). There is a possibility that decreased arousal is a physiological factor contributing to fatigue. As arousal was not directly measured in the current study, it is only possibly to speculate on its role. The role of arousal in the relationship between vigilance and fatigue would be a useful focus for future research.
The third hypothesis was that greater physiological costs and increases in fatigue would be associated with completing the vigilance task for TBI participants. Although TBI participants as a group were able to maintain stable performance on the vigilance task over time, its completion was associated with a significantly greater increase in diastolic BP for TBI participants relative to controls. This is consistent with findings of van Zomeren et al. (1984) and Riese et al. (1999), who demonstrated greater psychophysiological as well as subjective costs during vigilance tasks, even when cognitive demands were reduced to compensate for reduced processing speed. In the present study, increases in diastolic BP were associated with increases in subjectively reported fatigue on the VAS-F, and increases in systolic BP were related to slower RTs and lower variability in some periods of the vigilance task in TBI participants. These findings provide support for the coping hypothesis, suggesting that TBI individuals show greater psychophysiological costs in order to maintain a stable level of performance over time, and that these costs are also associated with subjective increases in fatigue. The association between increases in BP and reduced performance in some periods of the vigilance task suggests that greater psychophysiological costs may be associated with reduced attentional resources and the need to expend greater effort.
In view of these findings, it was somewhat surprising that TBI participants, as a group, did not report a disproportionate increase in fatigue or decrease in vigor on the VAS-F after performing the vigilance task. However, the subgroup of TBI participants who showed a decline on the vigilance task also reported significantly greater increases in fatigue in comparison to other TBI participants. This finding highlights the importance of examining different patterns of performance within TBI populations, given the heterogeneity of injury.
The absence of disproportionate increases in subjective fatigue measures in TBI participants may be due to several factors. It may be that fatigue is experienced by only a proportion of individuals with TBI, and that an overall fatigue effect is not evident when results are examined for the group as a whole. This was supported by findings that a subgroup of TBI participants did show a decline in performance on the vigilance task, as well as a disproportionate increase in subjective fatigue on the VAS-F. Alternatively, absence of disproportionate increases in fatigue may be related to weaknesses in the instruments used to measure fatigue. Reliable assessment of fatigue in both TBI and healthy populations is inherently difficult. As fatigue has no biological or physiological markers and is experienced subjectively, it has been argued that it is best assessed with self-report measures (Lewis & Wessely, 1992; Smets et al., 1993; Ferrell et al., 1996; Ream & Richardson, 1996; Meek et al., 2000). However, the applicability of subjective measures may be particularly problematic in a TBI population, where self-awareness of deficits may be compromised (Prigitano & Schacter, 1975; Flashman & McAllister, 2002; Hart et al., 2003). In addition, several factors are thought to influence individuals' judgments of their introspective experience (Annet, 2002), such as individuals' frame of reference, level of adaptation to the experience, coping style and emotional state of the rater, all of which can increase variability in responses. For example, it is feasible that TBI participants and controls used a different frame of reference in making judgments about their current fatigue level on the VAS-F (i.e., TBI participants may judge their fatigue level at any time in relation to their typical daily level of fatigue, which may be greater than that experienced by controls). Despite these limitations, while not differentiating TBI participants from controls on first administration, the VAS-F did appear to be sensitive to changes in subjective fatigue over time relative to each individual's frame of reference, as supported by the increases in fatigue reported by both groups following completion of the vigilance task.
The TBI group did not show a fatigue effect on the C-SAT administered before and after the vigilance task. While TBI participants performed significantly more poorly on this task, both groups showed a similar rate of improvement in performance following the vigilance task. No relationship was evident between rates of improvement on the C-SAT and subjective fatigue measures. Clearly, this “objective” paradigm for measuring fatigue is problematic, as Stuss et al. (1989) also found. Presumably because of the complex nature of the task, participants were able to improve performance with practice. It may be more useful for future research to examine fatigue using less complex RT tasks, or provide longer periods of practice prior to commencement of the task.
Findings of the present study have shed some light on correlates of fatigue following TBI. The results have suggested a relationship between greater subjective fatigue and more errors and greater variability in performing a task requiring sustained mental effort in TBI individuals, which was still present after controlling for effects of mood. In support of the coping hypothesis, results have suggested that greater psychophysiological costs are expended in sustaining consistent performance on a mentally effortful task, and these costs are associated with greater subjective fatigue ratings in TBI participants.
ACKNOWLEDGMENTS
We wish to thank Dr. Simon Moss for his advice on statistical methods, and members of the psychology and research departments at Epworth Rehabilitation Centre for their assistance in recruiting head-injured participants.
References
REFERENCES
Aaronson, L.S.,
Teel, C.S.,
Cassmeyer, V.,
Neuberger, G.B.,
Pallikkathayil, L.,
Pierce, J.,
Press, A.N.,
Williams, P.D., &
Wingate, A.
(1999).
Defining and mea-suring fatigue.
Image—The Journal of Nursing Scholarship,
31,
45–50.Google Scholar
Azouvi, P.,
Jokic, C.,
Van der Linden, M.,
Marlier, N., &
Bussel, B.
(1996).
Working memory and supervisory control after severe closed-head
injury. A study of dual task performance and random generation.
Journal of Clinical & Experimental Neuropsychology,
18,
317–337.Google Scholar
Bigler, E.D.
(2001).
The lesion(s) in traumatic brain injury: Implications for clinical
neuropsychology.
Archives of Clinical Neuropsychology,
16,
95–131.Google Scholar
Brouwer, W.H. &
van Wolffelaar, P.C.
(1985).
Sustained attention and sustained effort after closed head
injury.
Cortex,
21,
111–119.Google Scholar
Caci, H.,
Bayle, F.J.,
Mattei, V.,
Dossios, C.,
Robert, P., &
Boyer, P.
(2003).
How does the hospital anxiety and depression scale measure anxiety
and depression in healthy subjects?
Psychiatry Research,
118,
89–99.Google Scholar
Cohen, R.A. &
Fisher, M.
(1989).
Amantadine treatment of fatigue associated with MS.
Archives of Neurology,
46,
676–680.Google Scholar
Cohen, R.A. &
Sparling-Cohen, Y.A.
(1993).
Response selection and the executive control of attention.
In
R.A. Cohen (Ed.),
The neuropsychology of attention (pp.
49–73).
New York:
Plenum Press.
Dikmen, S.,
Machamer, J., &
Temkin, N.
(1993).
Psychological outcome in patients with moderate to severe brain
injury.
Brain Injury,
7,
113–124.Google Scholar
Evans, R.W.
(1992).
The post-concussion syndrome and sequelae of mild head
injury.
Neurologica Clinics,
10,
815–847.Google Scholar
Farrin, L.,
Hull, L.,
Unwin, C.,
Wykes, T., &
David, A.
(2003).
Effects of depressed mood on objective and subjective measures of
attention.
Journal of Neuropsychiatry & Clinical Neurosciences,
15,
98–104.Google Scholar
Ferrell, B.R.,
Grant, M.,
Dean, G.E.,
Funk, B., &
Ly, J.
(1996).
“Bone tired”: The experience of fatigue and its impact
on quality of life.
Oncology Nursing Forum,
23,
1539–1547.Google Scholar
Flashman, L.A. &
McAllister, T.W.
(2002).
Lack of awareness and its impact in traumatic brain injury.
NeuroRehabilitation,
17,
285–296.Google Scholar
Hart, T.,
Whyte, J.,
Polansky, M.,
Millis, S.,
Hammond, F.M.,
Sherer, M.,
Bushnik, T.,
Hanks, R., &
Kreutzer, J.
(2003).
Concordance of patient and family report of neurobehavioral symptoms
at 1 year after traumatic brain injury.
Archives of Physical Medicine & Rehabilitation,
84,
204–213.Google Scholar
Harter, M.,
Reuter, K.,
Gross-Hardt, K., &
Bengel, J.
(2001).
Screening for anxiety, depressive and somatoform disorders in
rehabilitation. Validity of HADS and GHQ-12 in patients with
musculoskeletal disease.
Disability and Rehabilitation,
23,
737–744.Google Scholar
Hibbard, M.R.,
Uysal, S.,
Kepler, K.,
Bogdany, J., &
Silver, J.
(1998).
Axis I psychopathology in individuals with traumatic brain
injury.
Journal of Head Trauma Rehabilitation,
13,
24–39.Google Scholar
Kreutzer, J.S.,
Seel, R.T., &
Gourley, E.
(2001).
The prevalence and symptom rates of depression after traumatic brain
injury: A comprehensive examination.
Brain Injury,
15,
563–576.Google Scholar
Krupp, L.B.,
LaRocca, N.G.,
Muir-Nash, J., &
Steinberg, A.D.
(1989).
The fatigue severity scale: Application to patients with multiple
sclerosis and systemic lupus erythematosus.
Archives of Neurology,
46,
1121–1123.Google Scholar
LaChapelle, D.L. &
Finlayson, M.A.J.
(1998).
An evaluation of subjective and objective measures of fatigue in
patients with brain injury and healthy controls.
Brain Injury,
12,
649–659.Google Scholar
Leclercq, M. &
Azouvi, P.
(2002).
Attention after traumatic brain injury. In
M. Leclercq &
P. Zimmermann (Eds.),
Applied neuropsychology of attention: Theory, diagnosis and
rehabilitation (pp.
257–279).
London:
Taylor and Francis.
Leclercq, M.,
Couillet, J.,
Azouvi, P.,
Marlier, N.,
Martin, Y.,
Strypstein, E., &
Rousseaux, M.
(2000).
Dual task performance after severe diffuse traumatic brain injury or
vascular prefrontal damage.
Journal of Clinical & Experimental Neuropsychology,
22,
339–350.Google Scholar
Lee, K.A.,
Hicks, G., &
Nino-Murcia, G.
(1991).
Validity and reliability of a scale to assess fatigue.
Psychiatry Research,
36,
291–298.Google Scholar
Lewis, G. &
Wessely, S.
(1992).
The epidemiology of fatigue: More questions than answers.
Journal of Epidemiology and Community Health,
46,
92–97.Google Scholar
Masson, F.,
Maurette, P.,
Salmi, L.R.,
Dartigues, J.F.,
Vecsey, J.,
Destaillats, J.M., &
Erny, P.
(1996).
Prevalence of impairments 5 years after a head injury, and their
relationship with disabilities and outcome.
Brain Injury,
10,
487–497.Google Scholar
Meek, P.M.,
Nail, L.M.,
Barsevick, A.,
Schwartz, A.L.,
Stephen, S.,
Whitmer, K.,
Beck, S.L.,
Jones, L.S., &
Walker, B.L.
(2000).
Psychometric testing of fatigue instruments for use with cancer
patients.
Nursing Research,
49,
181–190.Google Scholar
Middleboe, T.,
Anderson, H.H.,
Birket-Smith, M., &
Friis, M.L.
(1992).
Minor head injury: Impact on general health after 1 year: A
prospective follow-up study.
Acta Neurologica Scandinavica,
85,
5–9.Google Scholar
Nelson, H.E. &
Willison, J.
(1991).
The national adult reading test (NART): Test manual
(2nd ed.).
Windsor:
NFER–Nelson.
Olver, J.H.,
Ponsford, J., &
Curran, C.
(1996).
Outcomes following traumatic brain injury: A comparison between 2
and 5 years after injury.
Brain Injury,
10,
841–848.Google Scholar
Parasuraman, R.
(1984).
The psychobiology of sustained attention. In
J.S. Warm (Ed.),
Sustained attention in human performance (pp.
61–101).
London:
Wiley.
Parasuraman, R.,
Warm, J.S., &
See, J.E.
(1998).
Brain systems of vigilance. In
R. Parasuraman (Ed.),
The attentive brain (pp.
221–256).
Cambridge:
MIT Press.
Park, N.W.,
Moscovitch, M., &
Robertson, I.H.
(1999).
Divided attention impairments after traumatic brain injury.
Neuropsychologia,
37,
1119–1133.Google Scholar
Ponsford, J. &
Kinsella, G.
(1992).
Attentional deficits following closed head injury.
Journal of Clinical and Experimental Neuropsychology,
114,
822–838.Google Scholar
Posner, M.I. &
Peterson, S.E.
(1990).
The attention system of the human brain.
Annual Review of Neuroscience,
13,
25–42.Google Scholar
Prigitano, G.P. &
Schacter, D.L.
(1975).
Awareness of deficits after brain injury: Clinical and theoretical
issues.
New York:
Wiley.
Ream, E.K. &
Richardson, A.
(1996).
Fatigue: A concept analysis.
International Journal of Nursing Studies,
33,
519–529.Google Scholar
Riccio, C.A.,
Reynolds, C.R.,
Lowe, P., &
Moore, J.J.
(2002).
The continuous performance test: A window on the neural substrates
for attention?
Archives of Clinical Neuropsychology,
17,
235–272.Google Scholar
Riese, H.,
Hoedemaeker, M.,
Brouwer, W.H.,
Mulder, L.J.M.,
Cremer, R., &
Veldman, J.B.P.
(1999).
Mental fatigue after very severe closed head injury: Sustained
performance, mental effort and distress at two levels of workload in a
driving simulator.
Neuropsychological Rehabilitation,
9,
189–205.Google Scholar
Seel, R.T.,
Kreutzer, J.S.,
Rosenthal, M.,
Hammond, M.,
Corrigan, J.D., &
Black, K.
(2003).
Depression after traumatic brain injury: A national institute of
disability and rehabilitation research model systems multicenter
investigation.
Archives of Physical Medicine and Rehabilitation,
84,
177–184.Google Scholar
Segalowitz, S.J.,
Dywan, J., &
Unsal, A.
(1997).
Attentional factors in response time variability after traumatic
brain injury: An ERP study.
Journal of the International Neuropsychological Society,
3,
95–107.Google Scholar
Shores, E.A.,
Marosszeky, J.E.,
Sandanam, J., &
Batchelor, J.
(1986).
Preliminary validation of a scale for measuring the duration of
post-traumatic amnesia.
Medical Journal of Australia,
144,
569–572.Google Scholar
Smets, E.M.,
Garssen, B.,
Schuster-Uitterhoeve, A.L.J., &
deHaes, J.C.J.M.
(1993).
Fatigue in cancer patients.
British Journal of Cancer,
68,
220–224.Google Scholar
Snaith, R.P. &
Zigmond, A.S.
(1994).
The hospital anxiety and depression scale with the irritability
depression-anxiety scale and the Leeds situational anxiety scale:
Manual.
Windsor:
NFER–Nelson.
Spikman, J.M.,
van Zomeren, A.H., &
Deelman, B.G.
(1996).
Deficits of attention after closed-head injury: Slowness
only?
Journal of Clinical & Experimental Neuropsychology,
18,
755–767.Google Scholar
Sturm, W. &
Willmes, K.
(2001).
On the functional neuroanatomy of intrinsic and phasic
alertness.
NeuroImage,
14,
S76–S84.Google Scholar
Stuss, D.T.,
Murphy, K.J.,
Binns, M.A., &
Alexander, M.P.
(2003).
Staying on the job: The frontal lobes control individual performance
variability.
Brain,
126,
2363–2380.Google Scholar
Stuss, D.T.,
Pogue, J.,
Buckle, L., &
Bondar, J.
(1994).
Characterization of stability of performance in patients with
traumatic brain injury: Variability and consistency on reaction time
tests.
Neuropsychology,
8,
316–324.Google Scholar
Stuss, D.T.,
Stethem, L.L.,
Hugenholtz, H.,
Picton, T.,
Pivik, J., &
Richard, M.T.
(1989).
Reaction time after head injury: Fatigue, divided attention and
focused attention, and consistency of performance.
Journal of Neurology, Neurosurgery & Psychiatry,
52,
742–748.Google Scholar
van der Naalt, J.,
van Zomeren, A.H.,
Sluiter, W.J., &
Minderhoud, J.M.
(1999).
One year outcome in mild to moderate head injury: The predictive
value of acute injury characteristics related to work complaints and
return to work.
Journal of Neurology, Neurosurgery & Psychiatry,
66,
207–213.Google Scholar
van Zomeren, A.H. &
Brouwer, W.H.
(1994).
Clinical Neuropsychology of Attention.
New York:
Oxford University Press.
van Zomeren, A.H.,
Brouwer, W.H., &
Deelman, B.G.
(1984).
Attentional deficits: The riddles of selectivity, speed and
alertness. In
D. Brooks (Ed.),
Closed head injury: Psychological, social and family
consequences.
Oxford:
Oxford University Press.
van Zomeren, A.H.,
Brouwer, W.H.,
Rothengatter, J.A., &
Snoek, J.W.
(1988).
Fitness to drive a car after recovery from severe head
injury.
Archives of Physical Medicine and Rehabilitation,
69,
90–96.Google Scholar
van Zomeren, A.H. &
van den Burg, W.
(1985).
Residual complaints of patients two years after severe head
injury.
Journal of Neurology, Neurosurgery & Psychiatry,
48,
21–28.Google Scholar
Vitaz, T.W.,
Jenks, J.,
Raque, G.H., &
Shields, C.B.
(2003).
Outcome following moderate traumatic brain injury.
Surgical Neurology,
60,
285–291.Google Scholar
Walker, G.C.,
Cardenas, D.D.,
Guthrie, M.R.,
McLean, A., &
Brooke, M.M.
(1991).
Fatigue and depression in brain injured patients correlated with
quadriceps strength and endurance.
Archives of Physical Medicine and Rehabilitation,
72,
469–472.Google Scholar
Whyte, J.,
Polansky, M.,
Fleming, M.,
Branch Coslett, H., &
Cavallucci, C.
(1995).
Sustained arousal and attention after traumatic brain injury.
Neuropsychologia,
33,
797–813.Google Scholar
Winstead-Fry, P.
(1998).
Psychometric assessment of four fatigue scales with a sample of
rural cancer patients.
Journal of Nursing Measurement,
6,
111–122.Google Scholar
Zoccolotti, P.,
Matano, A.,
Deloche, G.,
Cantagallo, A.,
Passadori, A.,
Leclercq, M.,
Braga, L.,
Cremel, N.,
Pittau, P.,
Renom, M.,
Rousseaux, M.,
Truche, A.,
Fimm, B., &
Zimmermann, P.
(2000).
Patterns of attentional impairment following closed head injury: A
collaborative European study.
Cortex,
36,
93–107.Google Scholar
Demographic and injury details for TBI and control participants
Mean decision time (DT) and movement time (MT) (±SE) for TBI (n = 46) and control (n = 46) participants over four time periods of the vigilance task.
Mean number of missed targets for TBI (n = 46) and control participants (n = 46) over four time periods of the vigilance task.
Mean scores on the VAS-F fatigue and vigor subscales completed prior to and following the vigilance task for TBI (n = 46) and control participants (n = 46).
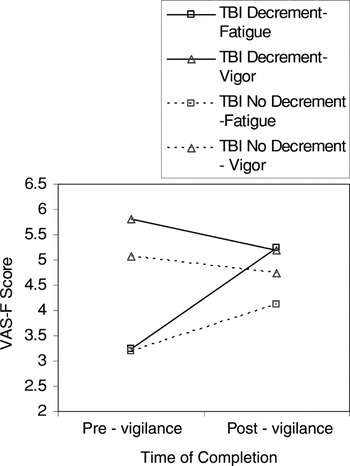
Mean scores on the VAS-F for TBI who showed a decrease in mean DT in phase four of the vigilance task relative to phase one (n = 22), and for TBI participants who showed an increase in mean DT over the same time periods (n = 24).
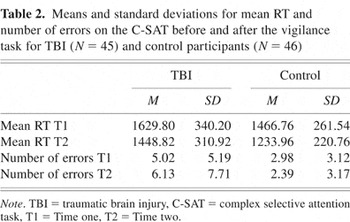
Means and standard deviations for mean RT and number of errors on the C-SAT before and after the vigilance task for TBI (N = 45) and control participants (N = 46)
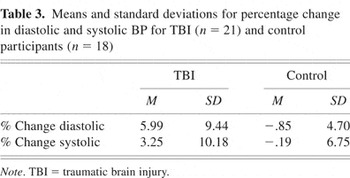
Means and standard deviations for percentage change in diastolic and systolic BP for TBI (n = 21) and control participants (n = 18)
 You have
Access
- 91
- Cited by