1. Introduction
Northeast Asia comprises the major Siberian Craton and a set of microcontinents and accreted terranes forming a series of fold-and-thrust belts. Starting from the Neoproterozoic, the eastern passive margin of the Siberian Craton was affected by several rifting events; the most intense occurred in the Devonian and resulted in the opening of the Oimyakon Ocean (Prokopiev et al. Reference Prokopiev, Parfenov, Tomshin, Kolodeznikov, Parfenov and Kuzmin2001; Nokleberg, Reference Nokleberg2010; Sokolov, Reference Sokolov2010). Formation of the Verkhoyansk Fold-and-Thrust Belt (FTB), framing the Siberian Craton to the east and northeast, is traditionally interpreted as a result of the late Mesozoic subduction and consequent closure of the Oimyakon Ocean leading to the collision of the Kolyma–Omolon microcontinent (or superterrane) with the Siberian Craton (Parfenov, Reference Parfenov1984; Parfenov et al. Reference Parfenov, Natapov, Sokolov and Tsukanov1993, Reference Parfenov, Prokopiev and Gaiduk1995, Reference Parfenov, Prokopiev, Spector, Parfenov and Kuzmin2001; Khudoley & Guriev, Reference Khudoley and Guriev2003; Khudoley & Prokopiev, Reference Khudoley, Prokopiev, Sears, Harms and Evenchick2007; Nokleberg, Reference Nokleberg2010; Toro et al. Reference Toro, Miller, Prokopiev, Zhang and Veselovskiy2016).
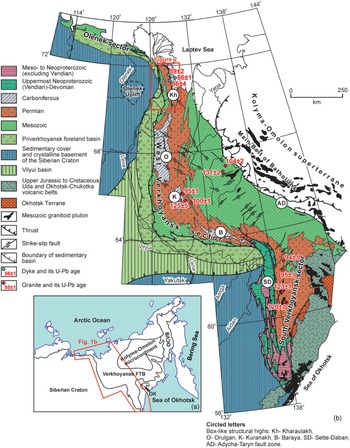
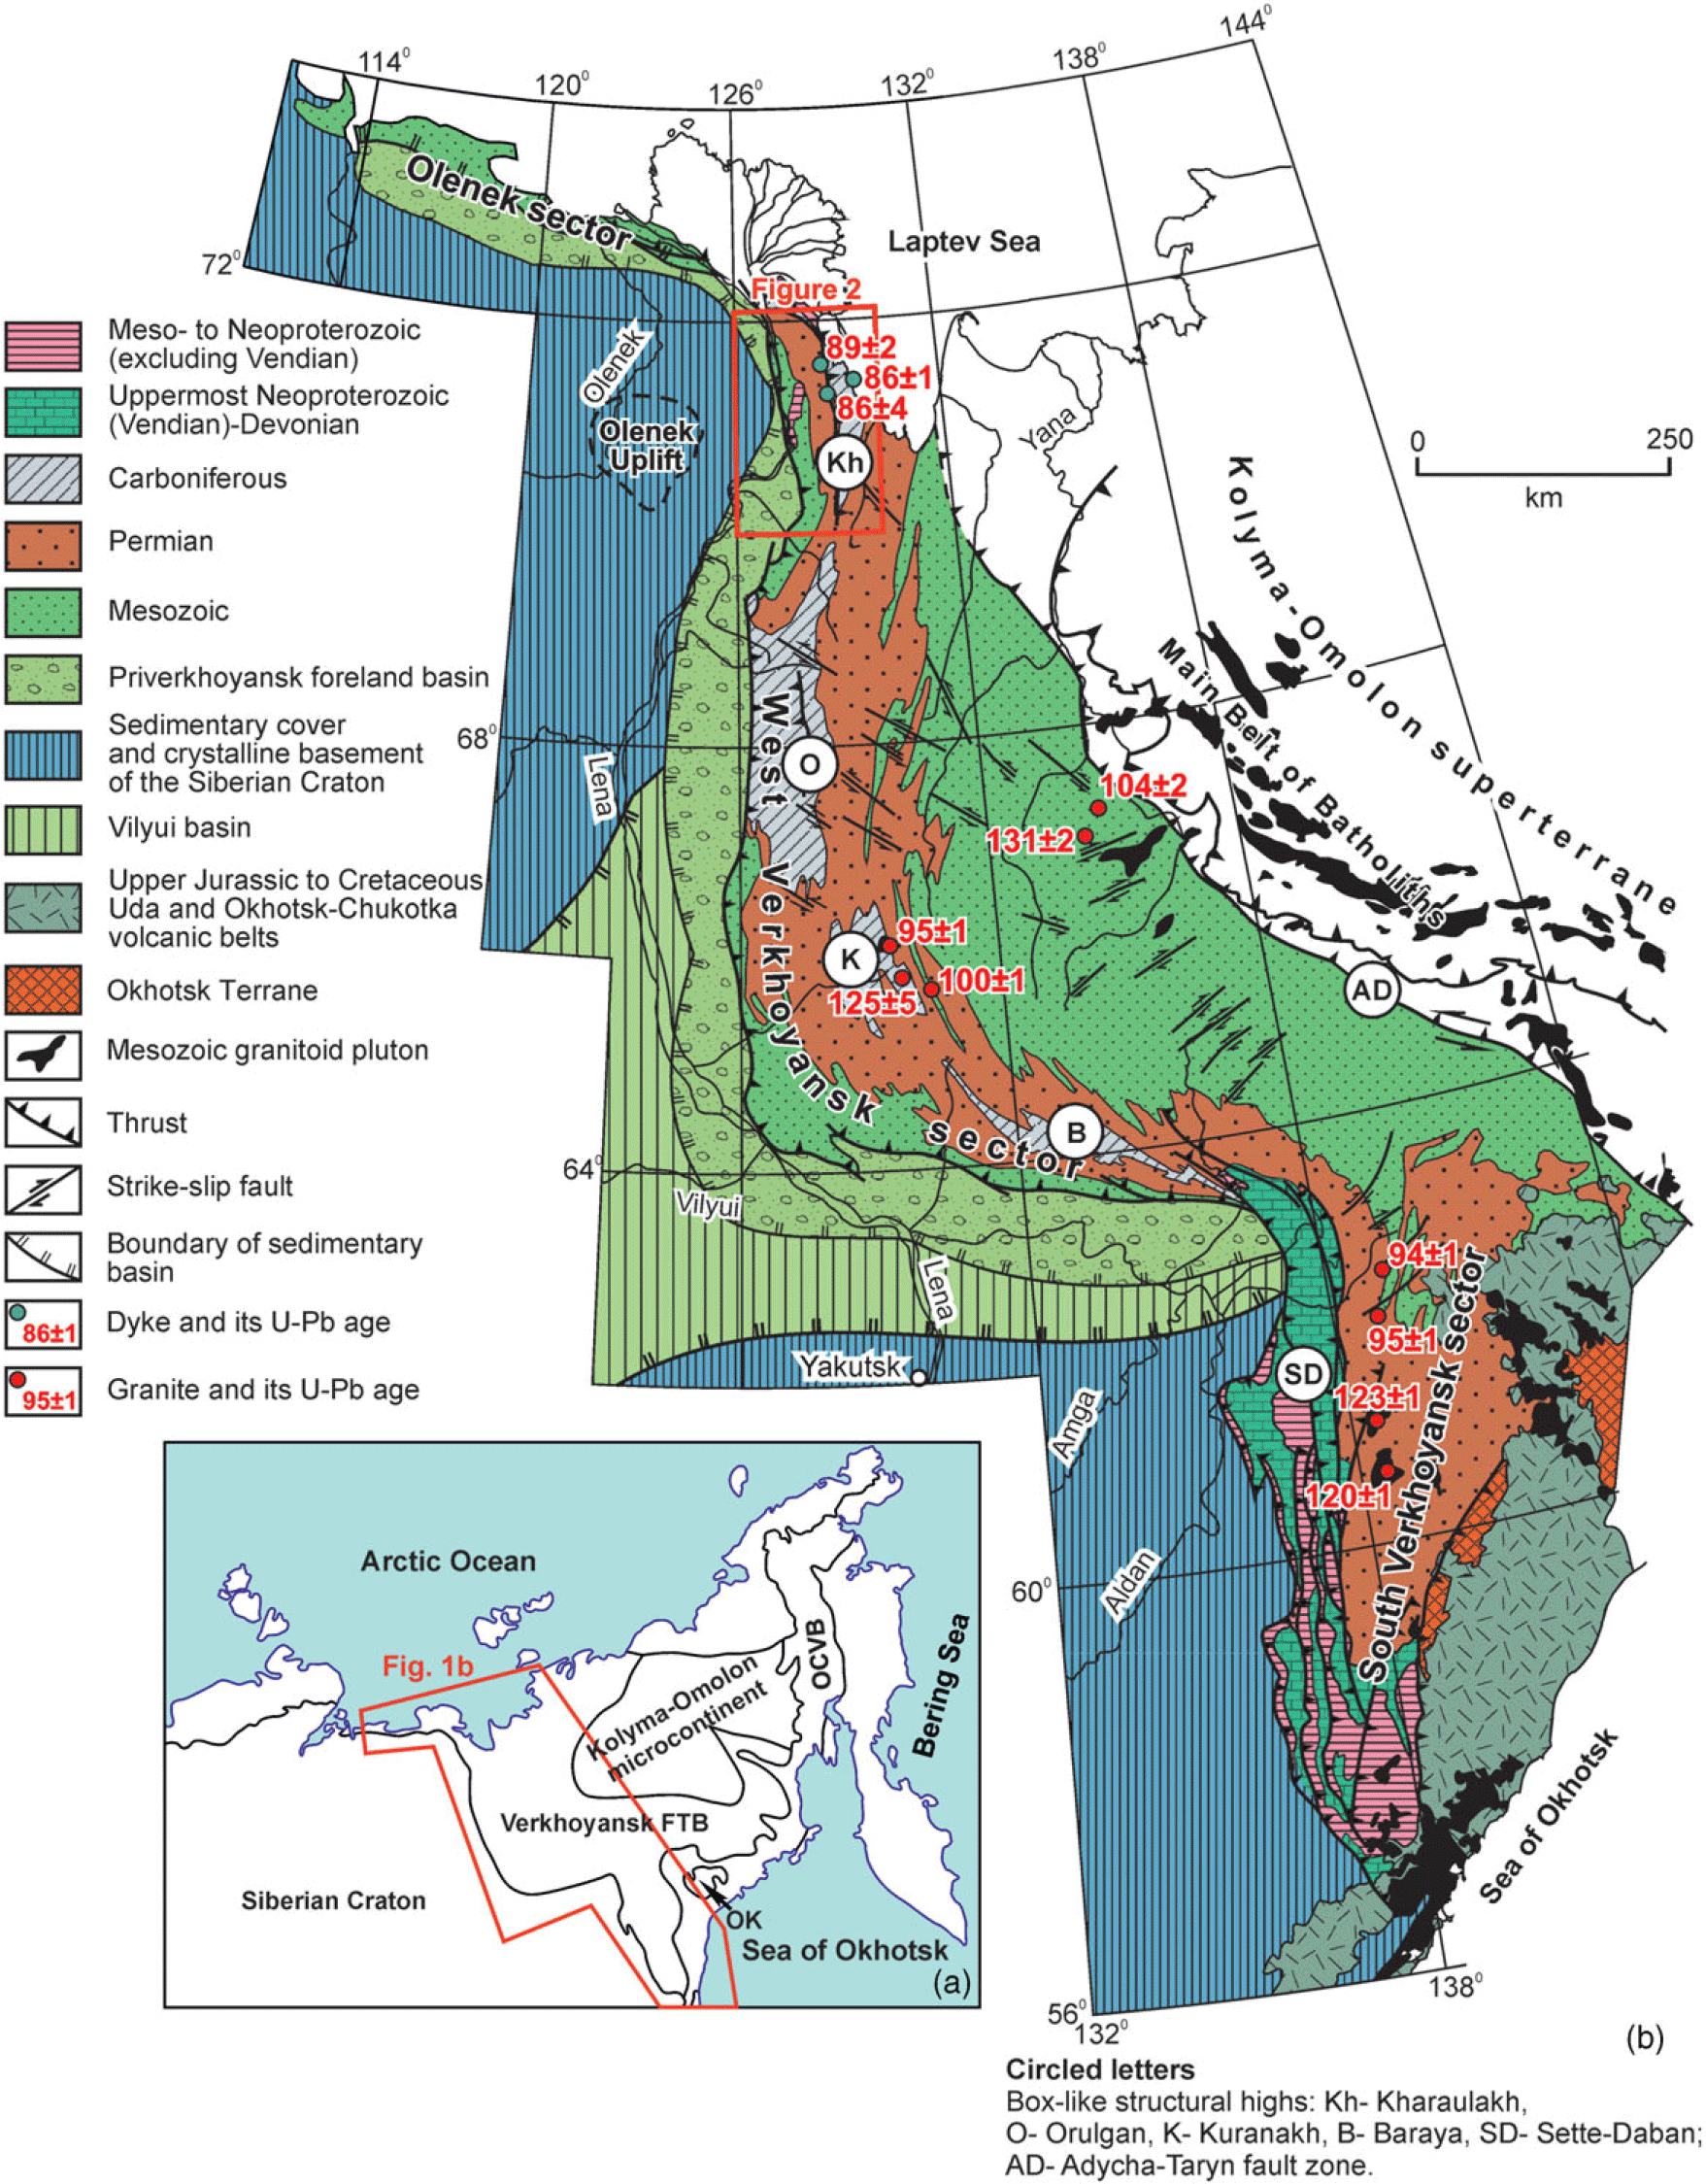
The Verkhoyansk FTB extends for c. 2000 km along-strike from the Lena River delta in the Laptev Sea in the north to the Sea of Okhotsk in the south (Fig. 1). The foreland of the Verkhoyansk FTB consists of the South Verkhoyansk, West Verkhoyansk and Olenek sectors, displaying variable stratigraphy and structural style (Fig. 1). The Olenek sector is commonly known as the Olenek fold zone (OFZ) (Parfenov et al. Reference Parfenov, Prokopiev and Gaiduk1995; Prokopiev & Deikunenko, Reference Prokopiev, Deikunenko, Parfenov and Kuzmin2001; Drachev & Shkarubo, Reference Drachev, Shkarubo, Pease and Coakley2018). The OFZ has an approximate E–W trend that is close to those of the adjacent Arctic fold-and-thrust belts (Drachev, Reference Drachev2011; Pease et al. Reference Pease, Drachev, Stephenson and Zhang2014; Toro et al. Reference Toro, Miller, Prokopiev, Zhang and Veselovskiy2016, and references therein). However, the N–S-trending West Verkhoyansk sector of the Verkhoyansk FTB is oriented almost perpendicularly to them, and the study area, located in the northernmost part of the West Verkhoyansk sector, reflects the complex tectonic history and interaction of the Arctic and Verkhoyansk orogens (Parfenov et al. Reference Parfenov, Natapov, Sokolov and Tsukanov1993, Reference Parfenov, Prokopiev and Gaiduk1995; Prokopiev & Deikuneko, Reference Prokopiev, Deikunenko, Parfenov and Kuzmin2001; Khudoley et al. Reference Khudoley, Verzhbitsky, Zastrozhnov, O’Sullivan, Ershova, Proskurnin, Tuchkova, Rogov, Kyser, Malyshev and Schneider2018).
(a) Northeast Asia. OK – Okhotsk terrane; OCVB – Okhotsk–Chukotka Volcanic Belt. (b) Geological map of the Verkhoyansk Fold-and-Thrust Belt (after Prokopiev & Deikunenko, Reference Prokopiev, Deikunenko, Parfenov and Kuzmin2001, modified). Age of intrusions after Prokopiev et al. (Reference Prokopiev, Toro, Hourigan, Bakharev and Miller2009, Reference Prokopiev, Khudoley, Egorov, Gertseva, Afanasieva, Sergeenko, Ershova and Vasiliev2013, Reference Prokopiev, Borisenko, Gamyanin, Pavlova, Fridovsky, Kondrat’eva, Anisimova, Trunilina, Ivanov, Travin, Koroleva, Vasiliev and Ponomarchuk2018a), Gertseva et al. (Reference Gertseva, Borisova, Chibisova, Emelyanova, Cherenkov, Ignateva, Kotov, Istoshina and Fedoseev2016) and Shishkin et al. (Reference Shishkin, Sinkova, Sergeev, Lokhov, Snezhko, Kovalenko, Baranov, Yakovlev, Ivanova, Lokhov, Goloudin, Buchnev and Maiskaya2017).
Previous studies of the West Verkhoyansk sector documented its thin-skinned tectonics with wide box-like folds in its frontal part, more complex structural style to the east, and the occurrence of several Cretaceous deformation events (Parfenov, Reference Parfenov1988; Parfenov et al. Reference Parfenov, Prokopiev and Gaiduk1995; Prokopiev & Deikunenko, Reference Prokopiev, Deikunenko, Parfenov and Kuzmin2001; Khudoley & Prokopiev, Reference Khudoley, Prokopiev, Sears, Harms and Evenchick2007). However, details of its structural evolution are still poorly understood. Stress field reconstruction identified strike-slip- and thrust faulting stress fields, but their temporal relationship and spatial distribution remain unclear (Gusev, Reference Gusev1979; Mikulenko et al. Reference Mikulenko, Sitnikov, Skrjabin and Timirshin1997; Gonchar, Reference Gonchar1998).
Here, we present the results of a detailed structural study along two transects across the northern West Verkhoyansk sector. Modern technologies such as separation of individual stress fields from heterogeneous fault-slip data were employed (Yamaji, Reference Yamaji2000; Otsubo & Yamaji, Reference Otsubo and Yamaji2006). Furthermore, U–Pb dating of calcite slickensides related to the individual stress fields was carried out, taking advantage of recent developments in this field (e.g. Beaudoin et al. Reference Beaudoin, Lacombe, Roberts and Koehn2018, Reference Beaudoin, Labeur, Lacombe, Koehn, Billi, Hoareau, Boyce, John, Marchegiano, Roberts, Millar, Claverie, Pecheyran and Callot2020; Hansman et al. Reference Hansman, Albert, Gerdes and Ring2018; Parrish et al. Reference Parrish, Parrish and Lasalle2018; Hoareau et al. Reference Hoareau, Crognier, Lacroix, Aubourg, Roberts, Niemi, Branellec, Beaudoin and Suárez Ruiz2021; Lacombe et al. Reference Lacombe, Beaudoin, Hoareau, Labeur, Pecheyran and Callot2021; Looser et al. Reference Looser, Madritsch, Guillong, Laurent, Wohlwend and Bernasconi2021; Smeraglia et al. Reference Smeraglia, Looser, Fabbri, Choulet, Guillong and Bernasconi2021). Combined with data from previous studies, our results provide insights on the timing of the deformation events, evolution of stress fields and interaction of the northern Verkhoyansk FTB with surrounding fold-and-thrust belts.
2. Geological setting of West Verkhoyansk sector
The West Verkhoyansk sector is the largest of the three sectors (West, South and Olenek) that constitute the Verkhoyansk FTB (Fig. 1). Towards the west it overthrusts the Priverkhoyansk foredeep basin. From north to south, the West Verkhoyansk sector is subdivided into the Kharaulakh, Orulgan, Kuranakh and Baraya segments (Fig. 1). The segments are box-like structural highs, being the culmination of the fold-and-thrust structures of the West Verkhoyansk sector, with Carboniferous rocks exposed at their cores. The elongated structural highs strike N–S, forming synclinal depressions covered with Permian rocks, which separate the structural highs from each other (Parfenov et al. Reference Parfenov, Prokopiev and Gaiduk1995; Prokopiev & Deikunenko, Reference Prokopiev, Deikunenko, Parfenov and Kuzmin2001; Khudoley & Prokopiev, Reference Khudoley, Prokopiev, Sears, Harms and Evenchick2007).
Three main sedimentary successions of the Verkhoyansk FTB are distinguished, corresponding to the main stages of tectonic evolution of the eastern margin of the Siberian Craton (Khudoley & Prokopiev, Reference Khudoley, Prokopiev, Sears, Harms and Evenchick2007): Meso- to Neoproterozoic, latest Neoproterozoic (Vendian) to Early Devonian, and Middle Devonian to Jurassic. The successions were deposited in separate sedimentary basins that partly overlapped each other and showed eastward migration of their depocentres (Khudoley & Prokopiev, Reference Khudoley, Prokopiev, Sears, Harms and Evenchick2007). The Meso- to Neoproterozoic siliciclastic–carbonate sedimentary succession, with widespread, c. 1 Ga mafic sills in its upper part, reaches a thickness of ∼12–14 km. Deposits were accumulated in an intracratonic basin with episodes of rifting and local compression in the latest Mesoproterozoic and Neoproterozoic (Khudoley et al. Reference Khudoley, Rainbird, Stern, Kropachev, Heaman, Zanin, Podkovyrov, Belova and Sukhorukov2001, Reference Khudoley, Chamberlain, Ershova, Sears, Prokopiev, Maclean, Kazakova, Malyshev, Molchanov, Kullerud, Toro, Miller, Veselovskiy, Li and Chipley2015). The uppermost Neoproterozoic (Vendian) to Lower Devonian predominantly carbonate succession with some shale units is ∼11 km thick and was mainly deposited in shallow-marine environments. However, after an early Cambrian rifting event in the South Verkhoyansk, depositional environments of the Cambrian and Ordovician rock units are similar to those on passive margins varying eastward from the Siberian Craton from shallow-marine to basinal facies (Khudoley & Prokopiev, Reference Khudoley, Prokopiev, Sears, Harms and Evenchick2007).
The beginning of the deposition of the Middle Devonian to Jurassic predominantly siliciclastic succession with basalt flows and some carbonate and evaporite units in its lower part was associated with widespread Middle to Late Devonian rifting. Locally, the rift-related deposits are latest Early Devonian in age (Alkhovik & Baranov, Reference Alkhovik and Baranov2001). Deposition of the Upper Devonian rocks occurred in continental, lagoonal, and shallow-marine environments. The lowermost Carboniferous (Lower Mississippian) deposits were accumulated in a carbonate platform and its margins, pointing to rift – passive-margin transition. At the end of the Early Carboniferous, carbonate deposition terminated and deposition of siliciclastic strata, commonly known as the Verkhoyansk Complex, began. The Lower Carboniferous to Jurassic siliciclastic unit (Verkhoyansk Complex) has a total composite thickness of ∼14–16 km and its accumulation was controlled by the giant sub-marine fan-delta systems typical for passive margins (Parfenov, Reference Parfenov1984; Prokopiev et al. Reference Prokopiev, Parfenov, Tomshin, Kolodeznikov, Parfenov and Kuzmin2001; Khudoley & Prokopiev, Reference Khudoley, Prokopiev, Sears, Harms and Evenchick2007; Ershova et al. Reference Ershova, Khudoley and Prokopiev2014).
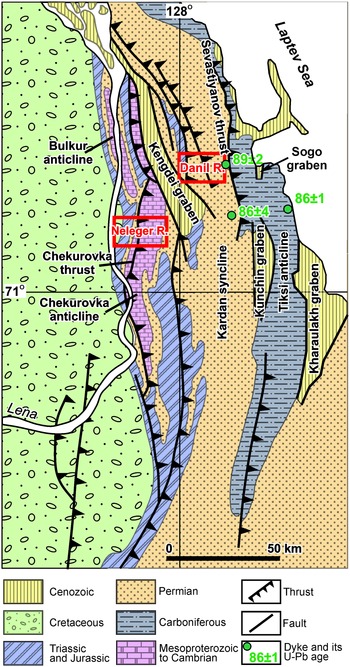
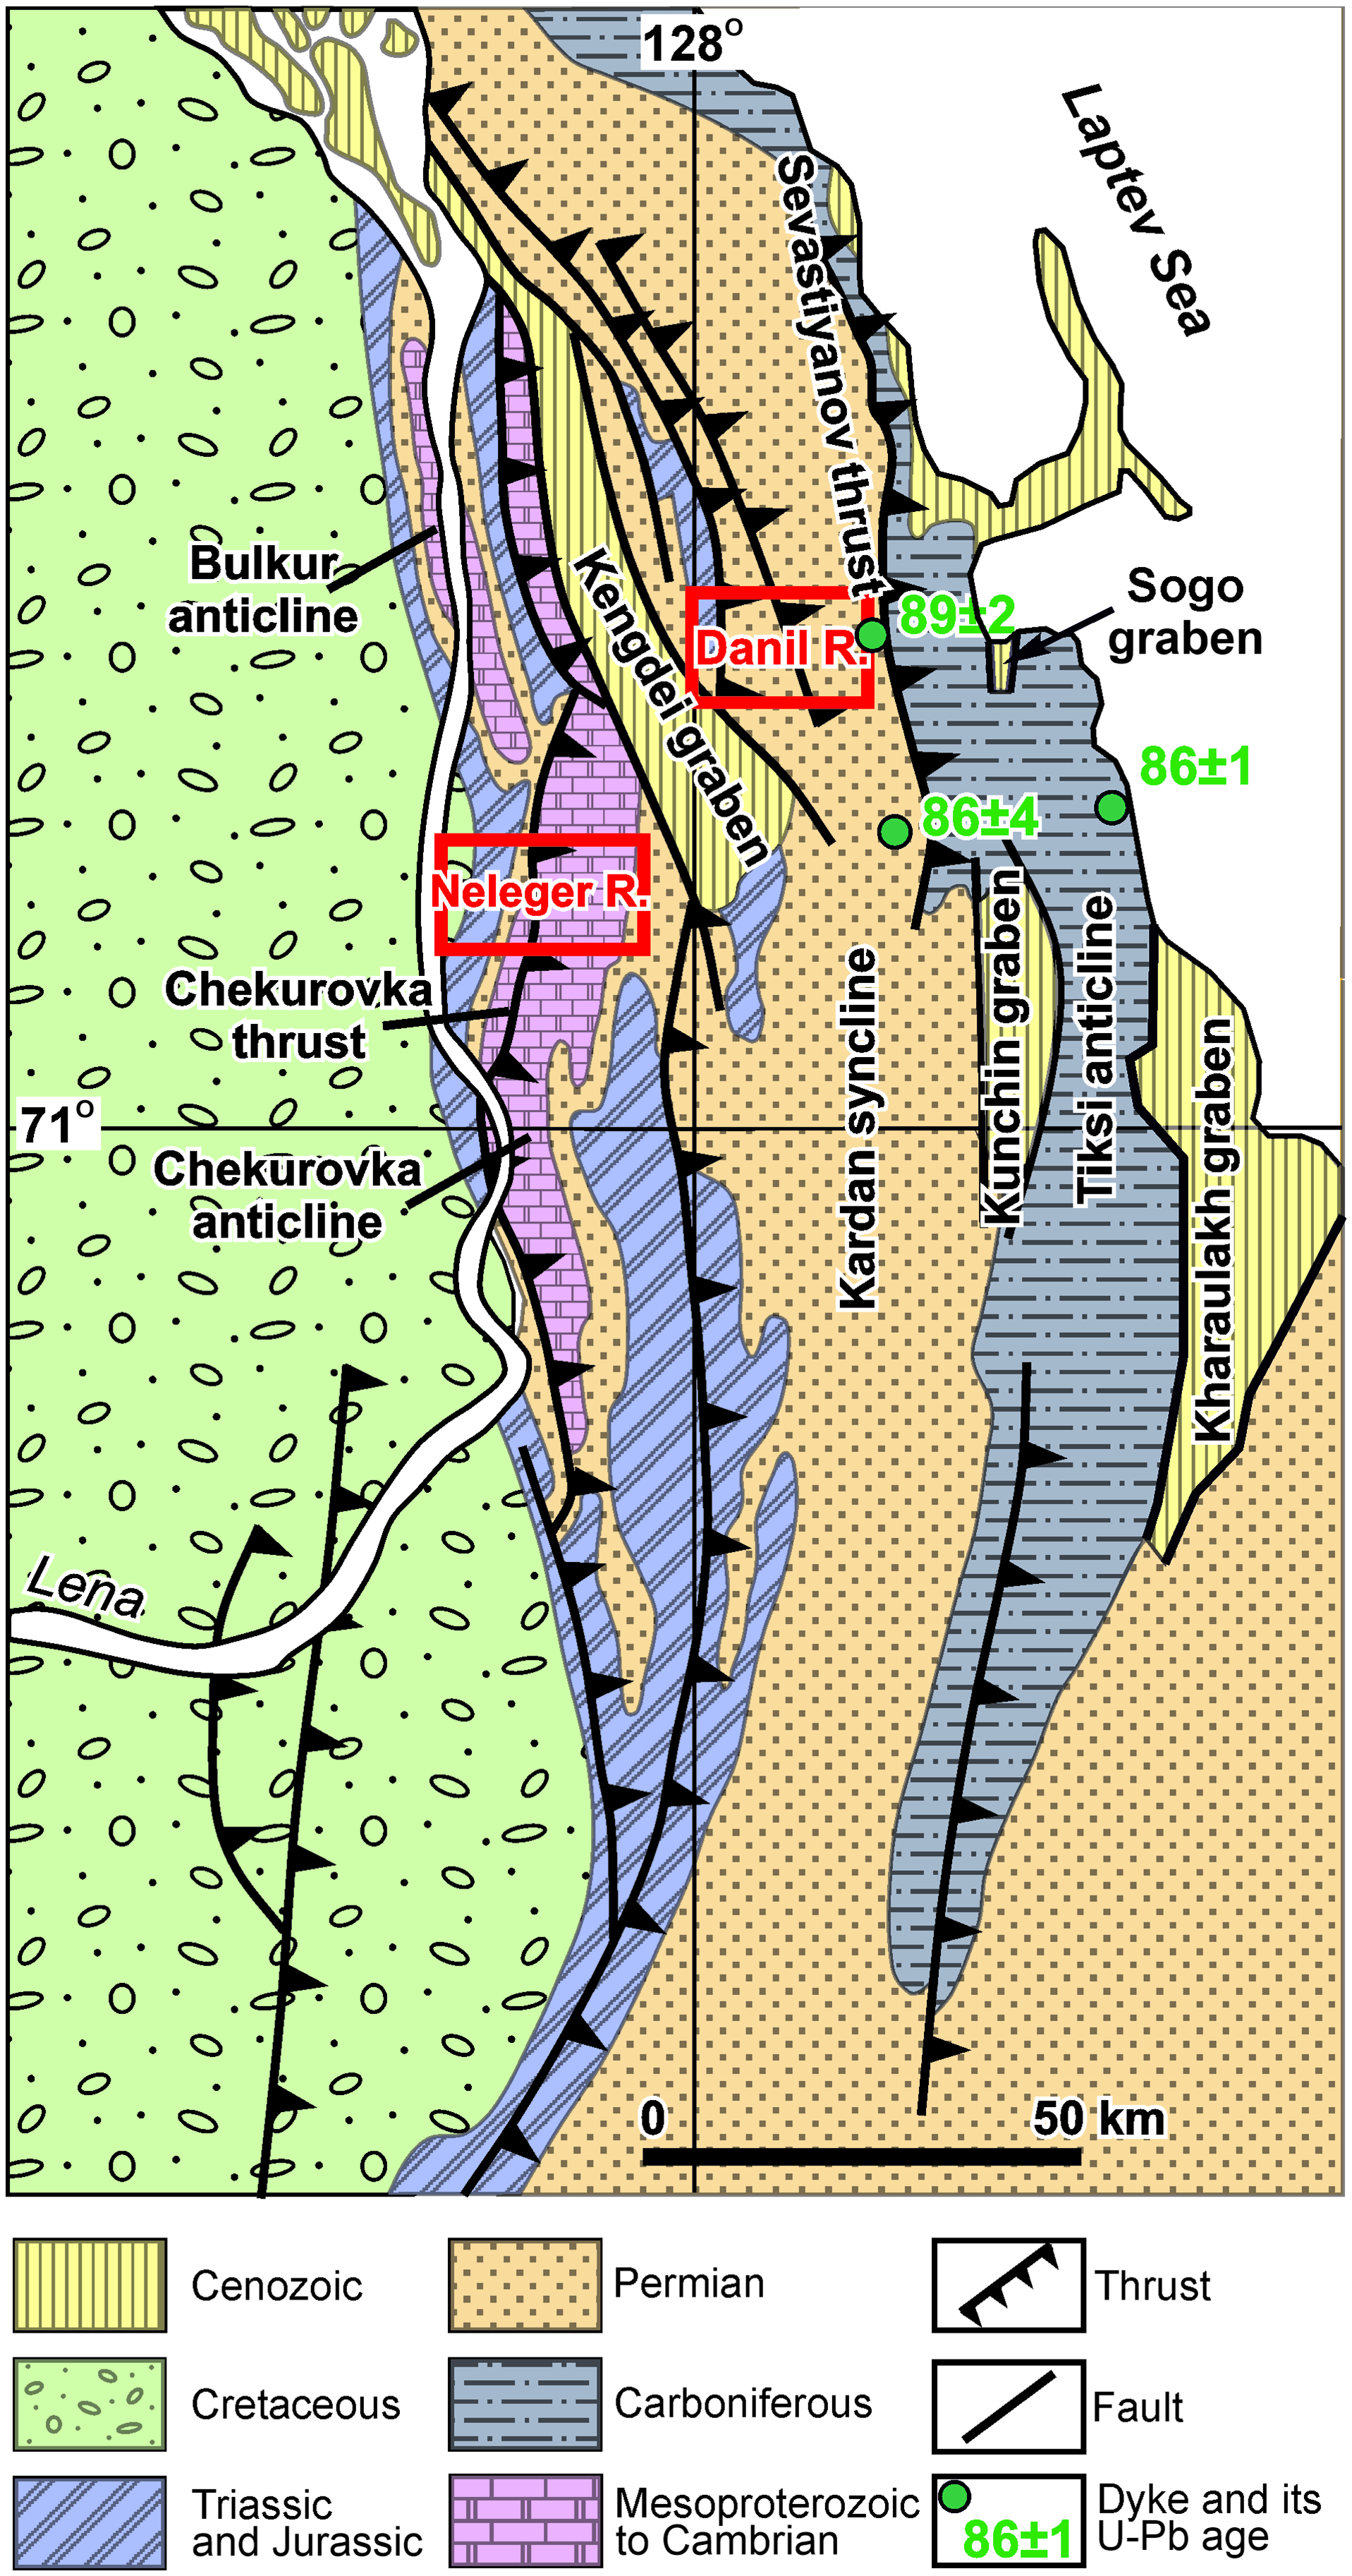
The study area is located in the northern part of the Kharaulakh segment (Fig. 2). Its stratigraphy and structural geology have been discussed by, among others, Gusev (Reference Gusev1979), Parfenov et al. (Reference Parfenov, Prokopiev and Gaiduk1995), Gonchar (Reference Gonchar1998), Prokopiev et al. (Reference Prokopiev, Parfenov, Tomshin, Kolodeznikov, Parfenov and Kuzmin2001), Prokopiev and Deikunenko (Reference Prokopiev, Deikunenko, Parfenov and Kuzmin2001) and Khudoley and Prokopiev (Reference Khudoley, Prokopiev, Sears, Harms and Evenchick2007). On the west, the frontal part of the segment contains the wide Bulkur and Chekurovka anticlines cored with Neoproterozoic and Cambrian carbonate rocks and interpreted as ramp anticlines (Parfenov et al. Reference Parfenov, Prokopiev and Gaiduk1995). On the eastern limb of these anticlines, Permian rocks unconformably overlay Cambrian strata. However, toward the east and north, Carboniferous rocks are also exposed in the core of the anticlines and in the hangingwall of the Sevastiyanov and other local thrusts (Fig. 2). Tight folds with complicated geometry are predominant in the area, covered with the fine-grained siliciclastic Carboniferous and Permian rocks. In the northernmost part of the Kharaulakh segment, Silurian, Devonian, and Lower Carboniferous carbonates were mapped in the fault-bounded blocks, but no rocks of these ages are known from other parts of the Kharaulakh segment. Upper Devonian rocks contain basalt flows. East and northernmost parts of the Kharaulakh segment are cross-cut by grabens filled in with Palaeocene, Eocene and younger sediments representing southward extension of the Laptev Sea rift (Parfenov et al. Reference Parfenov, Prokopiev, Spector, Parfenov and Kuzmin2001; Prokopiev et al. Reference Prokopiev, Parfenov, Tomshin, Kolodeznikov, Parfenov and Kuzmin2001; Ershova et al. Reference Ershova, Khudoley and Prokopiev2014; Gertseva et al. Reference Gertseva, Borisova, Chibisova, Emelyanova, Cherenkov, Ignateva, Kotov, Istoshina and Fedoseev2016; Drachev & Shkarubo, Reference Drachev, Shkarubo, Pease and Coakley2018).
Geological map of the Kharaulakh segment (after Gonchar, Reference Gonchar1998; Prokopiev et al. Reference Prokopiev, Urzov, Budeleeva, Slastenov and Yuganova1999; Prokopiev & Deikunenko, Reference Prokopiev, Deikunenko, Parfenov and Kuzmin2001; Imaev et al. Reference Imaev, Imaeva, Smekalin, Chipizubov, Ovsyuchenko and Kolodeznikov2018). See Figure 1b for location. Red rectangles are Neleger River area and Danil River area.
The structural style of the Kharaulakh segment shows significant lithological control. Our study is focused on two cross-sections, representative for its central and western parts, and their stratigraphy is discussed in more detail in the following sections.
2.a. Danil River area
The Danil River area is located within the central part of the Kharaulakh segment, corresponding to the Kardan syncline (Fig. 2). From the west it is bounded by the Palaeocene–Eocene Kengdei Graben. Permian to Middle Triassic rocks are exposed within the study area with lithologies typical for the Verkhoyansk Complex.
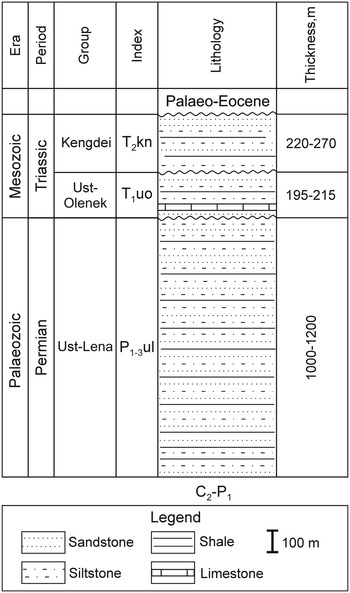
The stratigraphy of the Danil River area is shown in Fig. 3. The most ancient rocks in this area are siliciclastic rocks of the 1000–1200 m thick Lower–Upper Permian Ust-Lena Group (P1–3ul, Fig. 3), which comprises three units (Bidzhiev et al. Reference Bidzhiev, Gorshkova and Leonov1979; Gertseva et al. Reference Gertseva, Borisova, Chibisova, Emelyanova, Cherenkov, Ignateva, Kotov, Istoshina and Fedoseev2016). Shales and siltstones with rare sandstone interbeds predominate in its lower and upper parts, whereas the middle part contains an equal amount of sandstones and finer-grained siliciclastic counterparts. Permian rocks are unconformably overlain by sandstones with conglomerate interbeds of the Lower Triassic Ust-Olenek Group (T1uo). Interbedding of sandstones and fine-grained clastic rocks is typical for the Ust-Olenek Group; however, its lower part contains a ∼10 m thick marker limestone unit. The total thickness of the Ust-Olenek Group is 195–215 m. An erosional contact was also documented at the base of the Middle Triassic Kengdei Group (T2kn) that forms a coarsening-upward sequence consisting predominantly of shale and siltstone in its lower part and of sandstones in its upper part. The total thickness of the Kengdei Group is 220–270 m (Bidzhiev et al. Reference Bidzhiev, Gorshkova and Leonov1979; Gertseva et al. Reference Gertseva, Borisova, Chibisova, Emelyanova, Cherenkov, Ignateva, Kotov, Istoshina and Fedoseev2016).
Stratigraphic column for the Danil River area (after Bidzhiev et al. Reference Bidzhiev, Gorshkova and Leonov1979; Gertseva et al. Reference Gertseva, Borisova, Chibisova, Emelyanova, Cherenkov, Ignateva, Kotov, Istoshina and Fedoseev2016).

Palaeo-Eocene poorly lithified siliciclastic rocks with coal interbeds are widely distributed in the easternmost part of the Danil River area. They fill in the Kengdei Graben and unconformably overlie Permian rocks on its margins.
2.b. Neleger River area
The Neleger River area is located in the western part of the Kharaulakh segment and is separated from the Siberian Craton by the Chekurovka thrust (Fig. 2). To the east, it is bounded by the Eocene Kengdei Graben. The Neleger River area is mostly composed of the N–S-trending Chekurovka anticline with Neoproterozoic–Cambrian rocks exposed in the core and Permian–Mesozoic rocks on the limbs.
Neoproterozoic rocks of the Chekurovka anticline belong to the Ukta (NPRuk), Eselekh (NPRes), Neleger (NPRnl) and Sietachan (NPRst) formations with a total thickness at 1800 m representing the first sedimentary succession of the Verkhoyansk FTB (Fig. 4). Of these, the lowermost Ukta Formation consists of siliciclastic rocks, whereas the Eselekh, Neleger and Sietachan formations are predominantly formed by massive carbonates. A Neoproterozoic age of those formations is supported by stratigraphic correlations based on chemostratigraphy and Pb–Pb dating of carbonate rocks (Khabarov and Izokh, Reference Khabarov and Izokh2014; Kochnev et al. Reference Kochnev, Kuznetsov, Sitkina and Kramchaninov2021). Carbonate rocks of the Sietachan Formation are unconformably covered by the uppermost Neoproterozoic Kharayutekh (NPRhr) Formation and Cambrian carbonates and shale with a total thickness of 1075 m, representing the second sedimentary succession of the Verkhoyansk FTB (Fig. 4).
Stratigraphic column for the Neleger River area (after Bidzhiev et al. Reference Bidzhiev, Groshin, Gorshkova and Gogina1977; Khabarov & Isokh, Reference Khabarov and Izokh2014; Sukhov et al. Reference Sukhov, Shabanov, Pegel, Saraev, Filippov, Korovnikov, Sundukov, Fedorov, Varlamov, Efimov, Kontorovich and Kontorovich2016). Permian and Triassic rocks are from the west limb of the Chekurovka anticline.

Two mappable units are recognized in the Kharayutekh Formation: (1) the sandstone-dominated lower unit (NPRhr1) and (2) the carbonate-dominated upper unit (NPRhr2). An erosional contact was documented between the Kharayutekh Formation and Cambrian rocks. Most of the upper part (Vendian – Middle Devonian) of the second sedimentary succession of the Verkhoyansk FTB was truncated by erosion. On both limbs of the Chekurovka anticline, Cambrian rocks are unconformably overlain by Permian and Triassic strata similar to those observed in the Danil River area. However, on the west limb they exhibit erosional contacts and smaller thicknesses of 600 m and 570 m, respectively (Fig. 4). On the west limb of the Chekurovka anticline and in the footwall of the Chekurovka thrust, Triassic rocks are unconformably overlain by Jurassic siliciclastic rocks (Bidzhiev et al, Reference Bidzhiev, Groshin, Gorshkova and Gogina1977; Gertseva et al. Reference Gertseva, Borisova, Chibisova, Emelyanova, Cherenkov, Ignateva, Kotov, Istoshina and Fedoseev2016).
Neoproterozoic rocks are intruded by numerous mafic sills with thicknesses varying from a few metres to 100–120 m. The uppermost magmatic body is located just above the contact between Neoproterozoic and Cambrian rocks and is often interpreted as a volcanic surface flow that formed contemporaneously with sills (Prokopiev et al. Reference Prokopiev, Khudoley, Koroleva, Kazakova, Lokhov, Malyshev, Zaitsev, Roev, Sergeev, Berezhnaya and Vasiliev2016). U–Pb zircon dating yields a 540–530 Ma age for this mafic magmatic event (Bowring et al. Reference Bowring, Grotzinger, Isachsen, Knoll, Pelechaty and Kolosov1993; Prokopiev et al. Reference Prokopiev, Khudoley, Koroleva, Kazakova, Lokhov, Malyshev, Zaitsev, Roev, Sergeev, Berezhnaya and Vasiliev2016).
3. Data and methods
3.a. Structural data
Structural data were collected during two field seasons in 2018 and 2019 (online Supplementary Table S1 at https://doi.org/10.1017/S0016756822000528). The length of the cross–section along the Danil River measures 13 km compiled from 63 outcrops on both banks of the river, whereas the length of the cross-section along the Neleger River is 19 km and comprises 102 observation points. Major faults, folds, mafic sills, marker horizons and stratigraphic boundaries were traced using satellite imagery. Measurements of the spatial orientation of planar and linear structural elements were processed using the Stereonet Software (Allmendinger et al. Reference Allmendinger, Cardozo and Fisher2012) and the Orient Spherical Data Analysis Software (Vollmer, Reference Vollmer2015), and are presented on lower-hemisphere Schmidt stereographic nets.
3.b. Palaeostress analysis
Palaeostress analysis based on slickensides measurements on fault planes is used to determine principal stress orientations and the shape of the stress ellipsoid (e.g. Gushchenko, Reference Gushchenko, Grigoriev and Osokina1979; Angelier, Reference Angelier1984; Lacombe, Reference Lacombe2012; Simon, Reference Simon2019). Each set of slickensides with predominant orientation was measured where slickensides with several orientations were found. However, no relationship between slickensides with different orientations was documented in the field. Hence, the heterogeneous fault-slip data are presented (online Supplementary Table S1 at https://doi.org/10.1017/S0016756822000528).
There are many methods to separate heterogeneous fault-slip data (e.g. Yamaji, Reference Yamaji2000; Delvaux and Sperner, Reference Delvaux, Sperner and Nieuwland2003; Zalohar and Vrabec, Reference Zalohar and Vrabec2007; Sperner and Zweigel, Reference Sperner and Zweigel2010). In this study, we use the Multiple Inverse Method by Yamaji (Reference Yamaji2000), which is based on the classic inverse method by Angelier (Reference Angelier1984). This method allows dividing a heterogeneous fault-slip into subsets and calculating the orientation of the principal stresses for each subset with variable stress ratios because the slip direction depends on the shape of the stress ellipsoid (Guiraud et al. Reference Guiraud, Laborde and Philip1989). Significant solutions are identified as clusters in the parameter space and correspond to each homogeneous fault-slip dataset with minimal values of angular misfit between the theoretical and observed slip directions (Yamaji, Reference Yamaji2000). This method uses a 30° angular misfit filter as the threshold value for the estimation of stress fields. Although the Multiple Inverse Method allows the separation of heterogeneous fault-slip data, it has some limitations when the number of faults of the individual subgroups are quite different and also when both individual tensors are similar in the stress state configuration (Liesa and Lisle, Reference Liesa and Lisle2004). For more details on the Multiple Inverse Method, we refer to Yamaji (Reference Yamaji2000) and Otsubo & Yamaji (Reference Otsubo and Yamaji2006). The results of palaeostress analysis are essential to understand the main stages of deformation. However, each stage of deformation based on the palaeostress analysis should be confirmed. In this study, outcrop- and map-scale structures like folds and faults support the validity of the presented analysis.
3.c. U–Pb calcite dating
U–Pb dating of calcite fibres on slickensides was performed to obtain a first-order time constraint on fault activity. The study was performed by laser ablation – inductively coupled plasma – mass spectrometry (LA-ICP-MS) on polished thick-sections (100 um). The analyses were conducted at the Department of Earth Sciences, ETH Zürich, using an ASI RESOlution laser ablation system with a 193 nm excimer (ArF) laser source and a two-volume Laurin Technic S-155 ablation cell coupled to a Thermo Element XR sector-field ICP-MS. A laser repetition rate of 5 Hz and spot diameter of 110 μm were applied. The carrier gas consisted of high-purity He (c. 0.5 L min−1) and make-up Ar (c. 1 L min−1) and nitrogen (2 mL min−1) from the ICP-MS. Data acquisition time per spot was c. 1.2 min (30 s gas blank + 40 s ablation). If single-spot ablation signals showed variation in U–Pb ratios, different ratios were integrated independently to minimize uncertainties and maximize point variation for the calculation of the isochrones (see Guillong et al. Reference Guillong, Wotzlaw, Looser and Laurent2020). The primary reference material (RM) WC-1 (254.4 ± 4 Ma; Roberts et al. Reference Roberts, Rasbury, Parrish, Smith, Horstwood and Condon2017) was used to correct the U/Pb ratio. Data reduction was conducted applying the methods described in Roberts et al. (Reference Roberts, Rasbury, Parrish, Smith, Horstwood and Condon2017) and Guillong et al. (Reference Guillong, Wotzlaw, Looser and Laurent2020), including two validation reference materials JT (13.797 ± 0.031 Ma; Guillong et al. Reference Guillong, Wotzlaw, Looser and Laurent2020) and ASH-15D (2.965 ± 0.011; Nuriel et al. Reference Nuriel, Wotzlaw, Ovtcharova, Vaks, Stremtan, Šala, Roberts and Kylander-Clark2021). All data are provided in Supplementary Table S2 (online at https://doi.org/10.1017/S0016756822000528). U–Pb ages were calculated from Tera–Wasserburg concordia lower intercepts using the IsoplotR software package (Vermeesch, Reference Vermeesch2018). Guillong et al. (Reference Guillong, Wotzlaw, Looser and Laurent2020) estimated that the long-term excess variance is ∼2–2.5 % for calcite, which was quadratically propagated to the final intercept age.
4. Results
4.a. Structural analysis
4.a.1. Danil River area
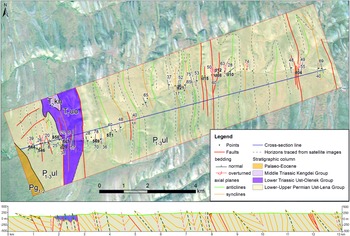
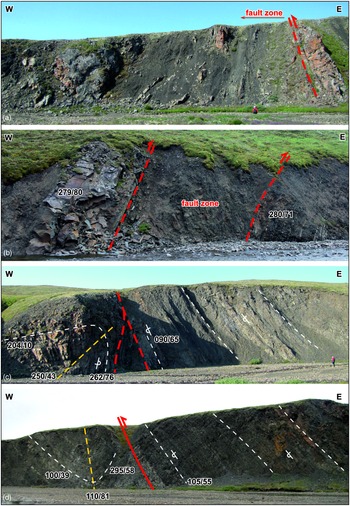
Figure 5 shows the geological map and the compiled cross-section of the Danil River area. Numerous fault structures were recognized at the outcrop scale, and major faults are traced well on the satellite images. Orientations of slickensides show that dip-slip displacement predominates, with only 11 out of 52 faults with slickensides exhibiting a significant strike-slip component (online Supplementary Table S1 at https://doi.org/10.1017/S0016756822000528). Faults show variable strikes, with predominance of N–S strike and dip predominantly to the east. Thrusts (33 out of 41 dip-slip faults) predominate, whereas normal faults (8 out of 41 dip-slip faults) are most widespread in the westernmost part of the Danil River area close to the Kengdei Graben. Fault zones are filled in with fault gouge and vary in width from a few metres to several tens of metres (Fig. 6). According to the geological maps and previous studies (Fig. 2; Vasiliev & Prokopiev, Reference Vasiliev and Prokopiev2012; Gertseva et al. Reference Gertseva, Borisova, Chibisova, Emelyanova, Cherenkov, Ignateva, Kotov, Istoshina and Fedoseev2016; Imaev et al. Reference Imaev, Imaeva, Smekalin, Chipizubov, Ovsyuchenko and Kolodeznikov2018), normal faults, associated with Palaeocene–Eocene grabens, cross-cut thrusts.
Geological map and cross-section of the Danil River area. Satellite image from www.google.com/maps (accessed 19 November 2021). The lines on the cross-section show the general structure. P1-3ul – clastic rocks of the Lower–Upper Permian Ust-Lena Group; T1uo – Lower Triassic Ust-Olenek Group, sandstone with conglomerate interbeds; T2kn – Middle Triassic Kengdei Group, shale and sandstone; Pg1-2 – Palaeocene–Eocene clastic rocks with coal interbeds.

Fault zones in the Danil River area. Major brittle fault zone in the Permian deposits, point d12 (a). Lower Triassic deposits, point 561 (the image is flipped about the vertical axis) (b). Fault zone separating an overturned anticline in the west and an overturned monocline in the east, Permian deposits, point d15 (c). Overthrust reverse fault with synclinal fold in the footwall, Permian deposits, point d04 (d). Black numbers indicate dip azimuth and dip angle of bedding and fold axial planes. White lines show bedding; red – faults; yellow – axial planes. See location of points in Figure 5.

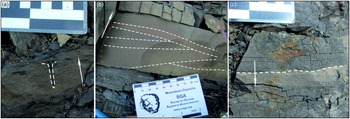
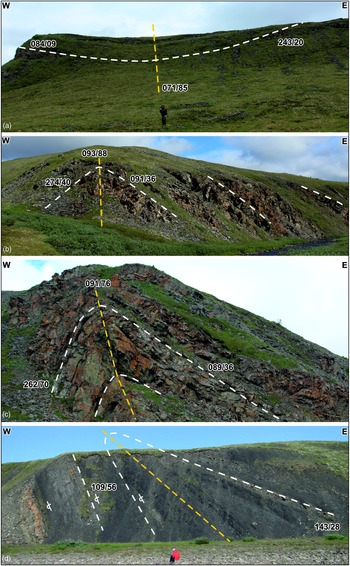
Folds of variable wavelength and morphology are widespread in the Danil River area (Fig. 5). In the most intensely deformed parts of the study area, fold structures are recognized by identification of normal and overturned bedding (Fig. 7). Overturned limbs related to tight and isoclinal folds are most typical in the hangingwalls of thrusts (Fig. 6d). Folds are sub-cylindrical, west-vergent and vary from parallel to similar (classes 1B and 2 by Ramsay and Huber, Reference Ramsay and Huber1987) and from gentle to almost isoclinal (Fig. 8). Some folds are documented in the field, while others have been identified based on satellite imagery.
Sedimentary structures indicating stratigraphic younging direction: (a) bioturbation (point 546); (b) cross-bedding (point d10); (c) gradational bedding (point 544). The arrows show the direction from the bottom to the top of the bed. See location of points in Figure 5.

Typical fold geometry in Permian deposits from the Danil River area. (a) Gentle syncline (point 558); (b) open anticline (point 571); (c) tight inclined anticline (point 569); (d) tight, close to isoclinal, overturned anticline (point d10). White lines show bedding; yellow – axial planes. See location of points in Figure 5.

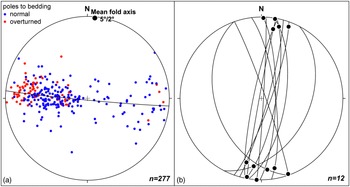
Of a total of 277 measured beddings, 199 are normal and 78 are overturned (Fig. 9a). The steepest east-dipping beds are typically overturned. West-dipping overturned beds are very rare. The mean fold axis exhibits a very gentle plunge toward the north (trend FA: 005-02). Hinges of non-cylindrical small folds display a very shallow plunge to the north and south (Fig. 9b). Typically, thrusts are sub-parallel to the fold axial planes (Fig. 5). However, thrusts cutting east-vergent folds are also detected (Fig. 6c). The development of a pervasive cleavage is very rare in the Danil River area and was only locally found near fault zones.
Pole-to-bedding (a) and minor folds axes and axial planes (b) plots, Danil River area. Schmidt stereographic net, lower-hemisphere projection, plotted in Orient Spherical Data Analysis Software and Stereonet Software. Blue dots are normal bedding (199 measurements), red are overturned (78 measurements). The solid line in (a) is the best-fit great circle; black point shows the fold hinge. Great circles in (b) are axial planes of 12 small folds; black points are fold hinges.

4.a.2. Neleger River area
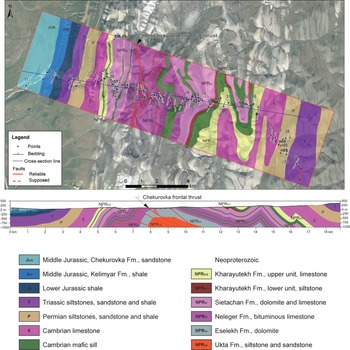
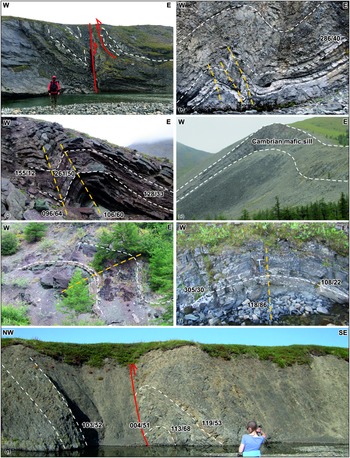
Figure 10 shows the geological map and cross-section of the Neleger River area. Faults with calcite slickensides were recognized on outcrops throughout the Neleger River area. Among faults with slickensides, dip-slip displacement predominates in 26 out of 50 faults, and strike-slip displacement predominates in 24 out of 50 faults (online Supplementary Table S1 at https://doi.org/10.1017/S0016756822000528). Strike-slip faults are especially numerous in the central part of the Neleger River area. Thrusts (19 out of 26 dip-slip faults) predominate over normal faults (7 out of 26 dip-slip faults). In the east part of the Neleger River area, a major fault zone corresponding to the Chekurovka thrust was encountered (Figs 2, 10). A reconstruction of the Chekurovka thrust from the geological map revealed a dip angle of ∼45° to the east, close to the dip angle of the Chekurovka thrust exposed along the Lena River (Gusev, Reference Gusev1979; Prokopiev & Deikunenko, Reference Prokopiev, Deikunenko, Parfenov and Kuzmin2001). The Chekurovka thrust fault zone contains folds of variable geometry, and related reverse faults always exhibit top-to-the-west sense of displacement (Fig. 11a). Dip-slip faults throughout the Neleger River area are often represented by bedding-parallel shear zones being controlled by thick mafic sills and alternation of massive carbonate units with shales (Fig. 11b). Some of the fault zones are filled in with gouge material and vary in width from several tens of centimetres to several tens of metres.
Geological map and cross-section of the Neleger River area. Satellite image from www.google.com/maps (accessed 19 November 2021).

Faults and folds of the Neleger River area. (a) Thrust in the Neleger Fm in the Chekurovka thrust zone (point n43). (b) Folds in the Neleger Fm (point n52). (c) Folds in the Vendian Kharauetekh Fm (point n17). (d) Cambrian sill, folded into anticline (point n57). (e) Folds in the Sietachan Fm (point n54). (f) Gentle anticline in the Permian deposits (point n09). (g) Fault-propagation-fold structure in the Permian deposits (point n08). White lines show bedding; red – faults; yellow – axial planes. Images (a), (c) and (f) are flipped about the vertical axis. See location of points in Figure 10.

Most of the Neleger River area is occupied by the west-vergent Chekurovka anticline, a hangingwall anticline of the Chekurovka thrust (Figs. 2, 10). The relatively smooth shape of the fold is controlled by the wide distribution of massive carbonate units and thick mafic sills.
Folds vary in wavelength from several metres to several kilometres (Figs 10, 11), from open to tight geometry, and are often disharmonic due to alternation of stiff (massive carbonates) and weak (shale) units (Fig. 11c–f). West-vergent folds predominate, but east-vergent folds occur as well. However, east-vergent folds, at least partly, are disharmonic parasitic folds within larger west-vergent folds. Axial planes of the west-vergent folds are approximately parallel to the thrust planes, indicating formation during the same deformational event. This is also confirmed by the presence of fault-propagation folds (Fig. 11g). No faults associated with east-vergent folds were observed.
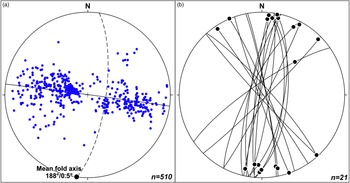
No overturned bedding was detected in the Neleger River area. The poles-to-bedding diagram is characteristic for a sub-cylindrical fold with an almost horizontal mean axis very gently plunging towards an azimuth of 188° (Fig. 12a). The calculated axial plane of the average fold geometry strikes toward 8° and dips to the east with a dip angle of 72°. Plunges of small fold hinges vary significantly but are generally close to the mean fold axis (Fig. 12b).
Pole-to-bedding (a) and minor fold axes and axial planes (b) plots, Neleger River area. Schmidt stereographic net, lower-hemisphere projection, plotted in Orient Spherical Data Analysis Software and Stereonet Software. Solid line in (a) is the best-fit great circle, dashed line is calculated axial plane, and black point shows the fold hinge. Great circles in (b) are axial planes of 21 small folds; black points are fold hinges.

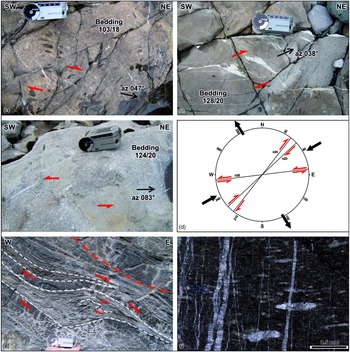
Cleavage can locally be observed in the Neleger River area. Low-strain brittle shear zones with en échelon calcite veins were documented mostly within the Neoproterozoic carbonates in the central and eastern parts of the Chekurovka anticline close to the Chekurovka thrust, but were also noted related to other fault zones. Shear senses based on en échelon arrangements of veins measured in points n23, n24 and n25 indicate ENE–WSW compression. (Fig. 13a–d). Ductile shear zones with variable senses of shearing were only found close to the hinge zone of the Chekurovka anticline (Fig. 13e, f).
Low-strain brittle (a-d) and ductile (e, f) shear zones, Neleger River area. (a) En échelon veins, indicating dextral sense of shear, Sietachan Fm (point n23). (b) En échelon veins, indicating dextral sense of shear, Sietachan Fm (point n24). (c) En échelon veins, indicating sinistral sense of shear, Sietachan Fm (point n25). (d) Stereoplot for en échelon veins in Sietachan Fm (points n23, n24 and n25). Red arrows show left and right shear displacements, black arrows show directions of compression and extension. (e) σ-type structure, indicating dextral sense of shear, Neleger Fm (point n38). (f) Thin section of sample EP-N28, Neleger Fm (point n28), in polarized light: clayey limestone with calcite veins. The clay matrix contains recrystallized elongated calcite grains, possibly deformed oolites. See location of points in Figure 10.

4.b. Stress fields
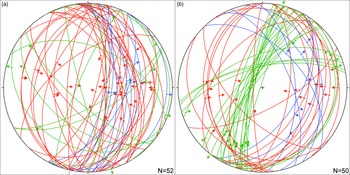
Slickensides on fault planes were found throughout both the Danil and Neleger river areas, with 52 measurements at 27 sites in the Danil River area and 50 measurements at 17 sites in the Neleger River area (Fig. 14; online Supplementary Fig. S3 at https://doi.org/10.1017/S0016756822000528). Slickensides may exhibit variable orientations representing overprinting of several local stress fields, forming heterogeneous fault-slip data (online Supplementary Table S1 at https://doi.org/10.1017/S0016756822000528). However, no cross-cut relationship between faults with variably oriented slickensides was documented in the field, which makes the separation of the homogeneous fault-slip data sets impossible based on the direct outcrop observations. To separate homogeneous fault-slip data sets and related stresses from the heterogeneous fault-slip data, the inverse technique by Yamaji (Reference Yamaji2000) was applied.
Composite fault-slip data on equal-angle lower-hemisphere projection from the Danil (a) and Neleger (b) rivers areas. Slip data are related to faults with predominant thrust (red), normal (blue) and strike-slip (green) displacements.

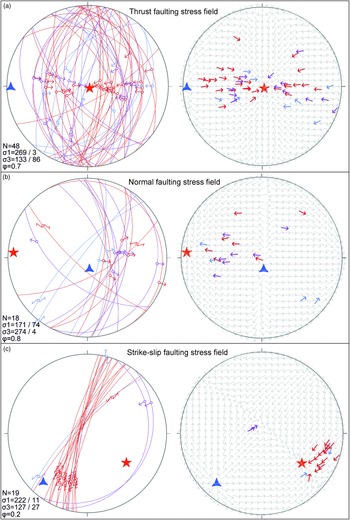
Three different stress fields, including 82 out of 102 slickenside measurements, were identified in the Danil River and Neleger River areas (Fig. 15). Other measurements did not pass through the 30° angular misfit filter. Calculations of stress fields show that orientations of three slickensides fit two different stress fields, therefore corresponding slickenside measurements were included in both data sets.
Thrust (a), normal (b) and strike-slip (c) faulting stress field data from the Danil and Neleger rivers. Results are shown on equal-angle lower-hemisphere stereonets. Stereonets on the left show homogeneous fault-slip data; stereonets on the right show tangent lineation diagrams with theoretical slip directions (grey arrows) (Twiss & Moores, Reference Twiss and Moores1992). Red, purple and blue arrows (corresponding to measurements with a misfit of 10°, 20° and 30° respectively) show movements of the hangingwall blocks. Blue triangle is axis of maximum compression (σ1), red star is axis of minimum compression (σ3) and ϕ is the stress ratio.
The largest set of slickensides, containing 48 measurements, corresponds to a thrust faulting stress field (Fig. 15a). This field is characterized by a sub-horizontal compression axis with a very gentle plunge toward 269° and a sub-vertical extension axis. The normal faulting stress field, which includes 18 measurements, has a sub-horizontal extension axis with a very gentle plunge toward 274° (Fig. 15b). The strike-slip faulting stress field was identified based on 19 measurements with a compression axis of 222-11 and an extension axis plunging 127-27 (Fig. 15c).
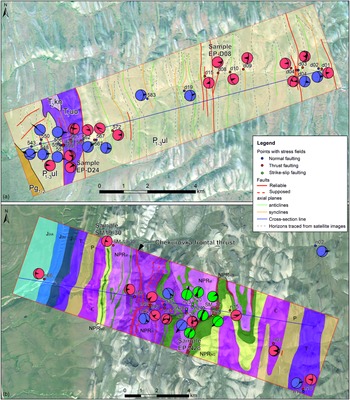
The strike-slip faulting stress field is only recognized in the Neleger River area. All faults related to the strike-slip faulting stress field are located in the western limb of the Chekurovka anticline close to its hinge zone and most of them cut massive carbonates of the Sietachan Formation (Figs 15c, 16b). In contrast, thrust and normal faulting stress fields include faults from both the Danil River and Neleger River areas (Fig. 16). Although 11 slickensides with predominant strike-slip displacement were documented in the Danil River area, they were not separated in a unique stress field; seven do not fit any data set and four formed a homogeneous fault-slip data set with normal faults. Three out of four strike-slip faults show dextral displacement.
Stress fields for the Danil (a) and Neleger (b) river areas. Black triangles indicate the hangingwall movement directions. Fault slip data correspond to the thrust faulting stress field (red), normal faulting stress field (blue) and strike-slip faulting stress field (green).

4.c. U–Pb calcite dating
A total of 11 samples with calcite slickensides were selected for U–Pb dating. Most of the fault planes in the Danil River area have no or only very thin calcite slickensides, and only two samples (EP-D08 and EP-D24) were selected for dating, both constraining reliable ages. In the Neleger River area with wide distribution of massive carbonate units in the succession, slickensides with thick calcite fibres are typical, and nine samples were selected for U–Pb dating. However, only two samples resulted in reliable formation ages (EP-N28 and SM19-30).
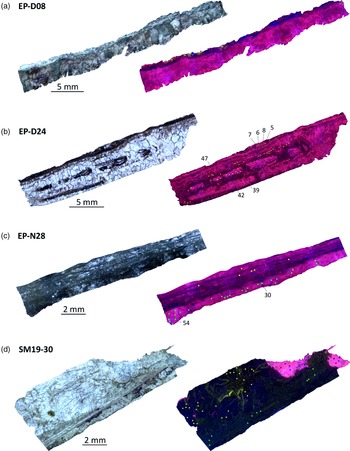
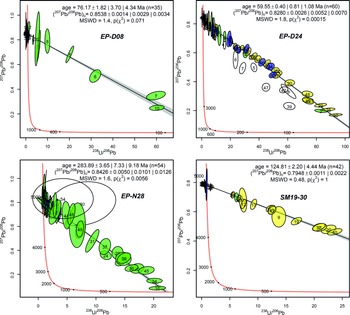
Sample EP-D08 is located in the central part of the Danil River area within alternating sandstones and shales of the Permian Ust-Lena Group (Fig. 16a). The sampled calcite slickenside corresponds to a mode II shear vein (Bons et al. Reference Bons, Elburg and Gomez-Rivas2012) and is related to a fault that developed as a result of the thrust faulting stress field (Fig. 15a). However, a rake of 50° indicates a significant strike-slip component of displacement (online Supplementary Table S1 at https://doi.org/10.1017/S0016756822000528). The slickenside is ∼3–5 mm thick and filled by blocky, granular calcite with a homogeneous cathodoluminescence (CL) pattern (see Fig. 18a). A secondary shear-related calcite shear with similar luminescence, but some dull area, can be observed along the upper contact. Thirty-five U–Pb age point measurements (green dots in Fig. 17a) yield a lower intercept age at 76.17 ± 4.34 Ma (Fig. 18; online Supplementary Table S2 at https://doi.org/10.1017/S0016756822000528).
Optical and CL photomicrographs of calcite slickensides used for U–Pb dating. (a) Sample EP-D08. (b) Sample EP-D24. (c) Sample EP-N28. (d) Sample SM19-30. Blue, green and yellow dots in CL images indicate laser ablation points for U–Pb dating in different domains.

Tera–Wasserburg concordia diagrams for the studied samples. Colours of ellipses refer to the equally coloured domains in the CL images (Fig. 17). White ellipses show measurements not involved in the age calculation and are marked with pink in online Supplementary Table S2 (at https://doi.org/10.1017/S0016756822000528). Ages are given with 1σ and 2σ uncertainties. Additionally, uncertainty with overdispersion is given in case of overdispersion.
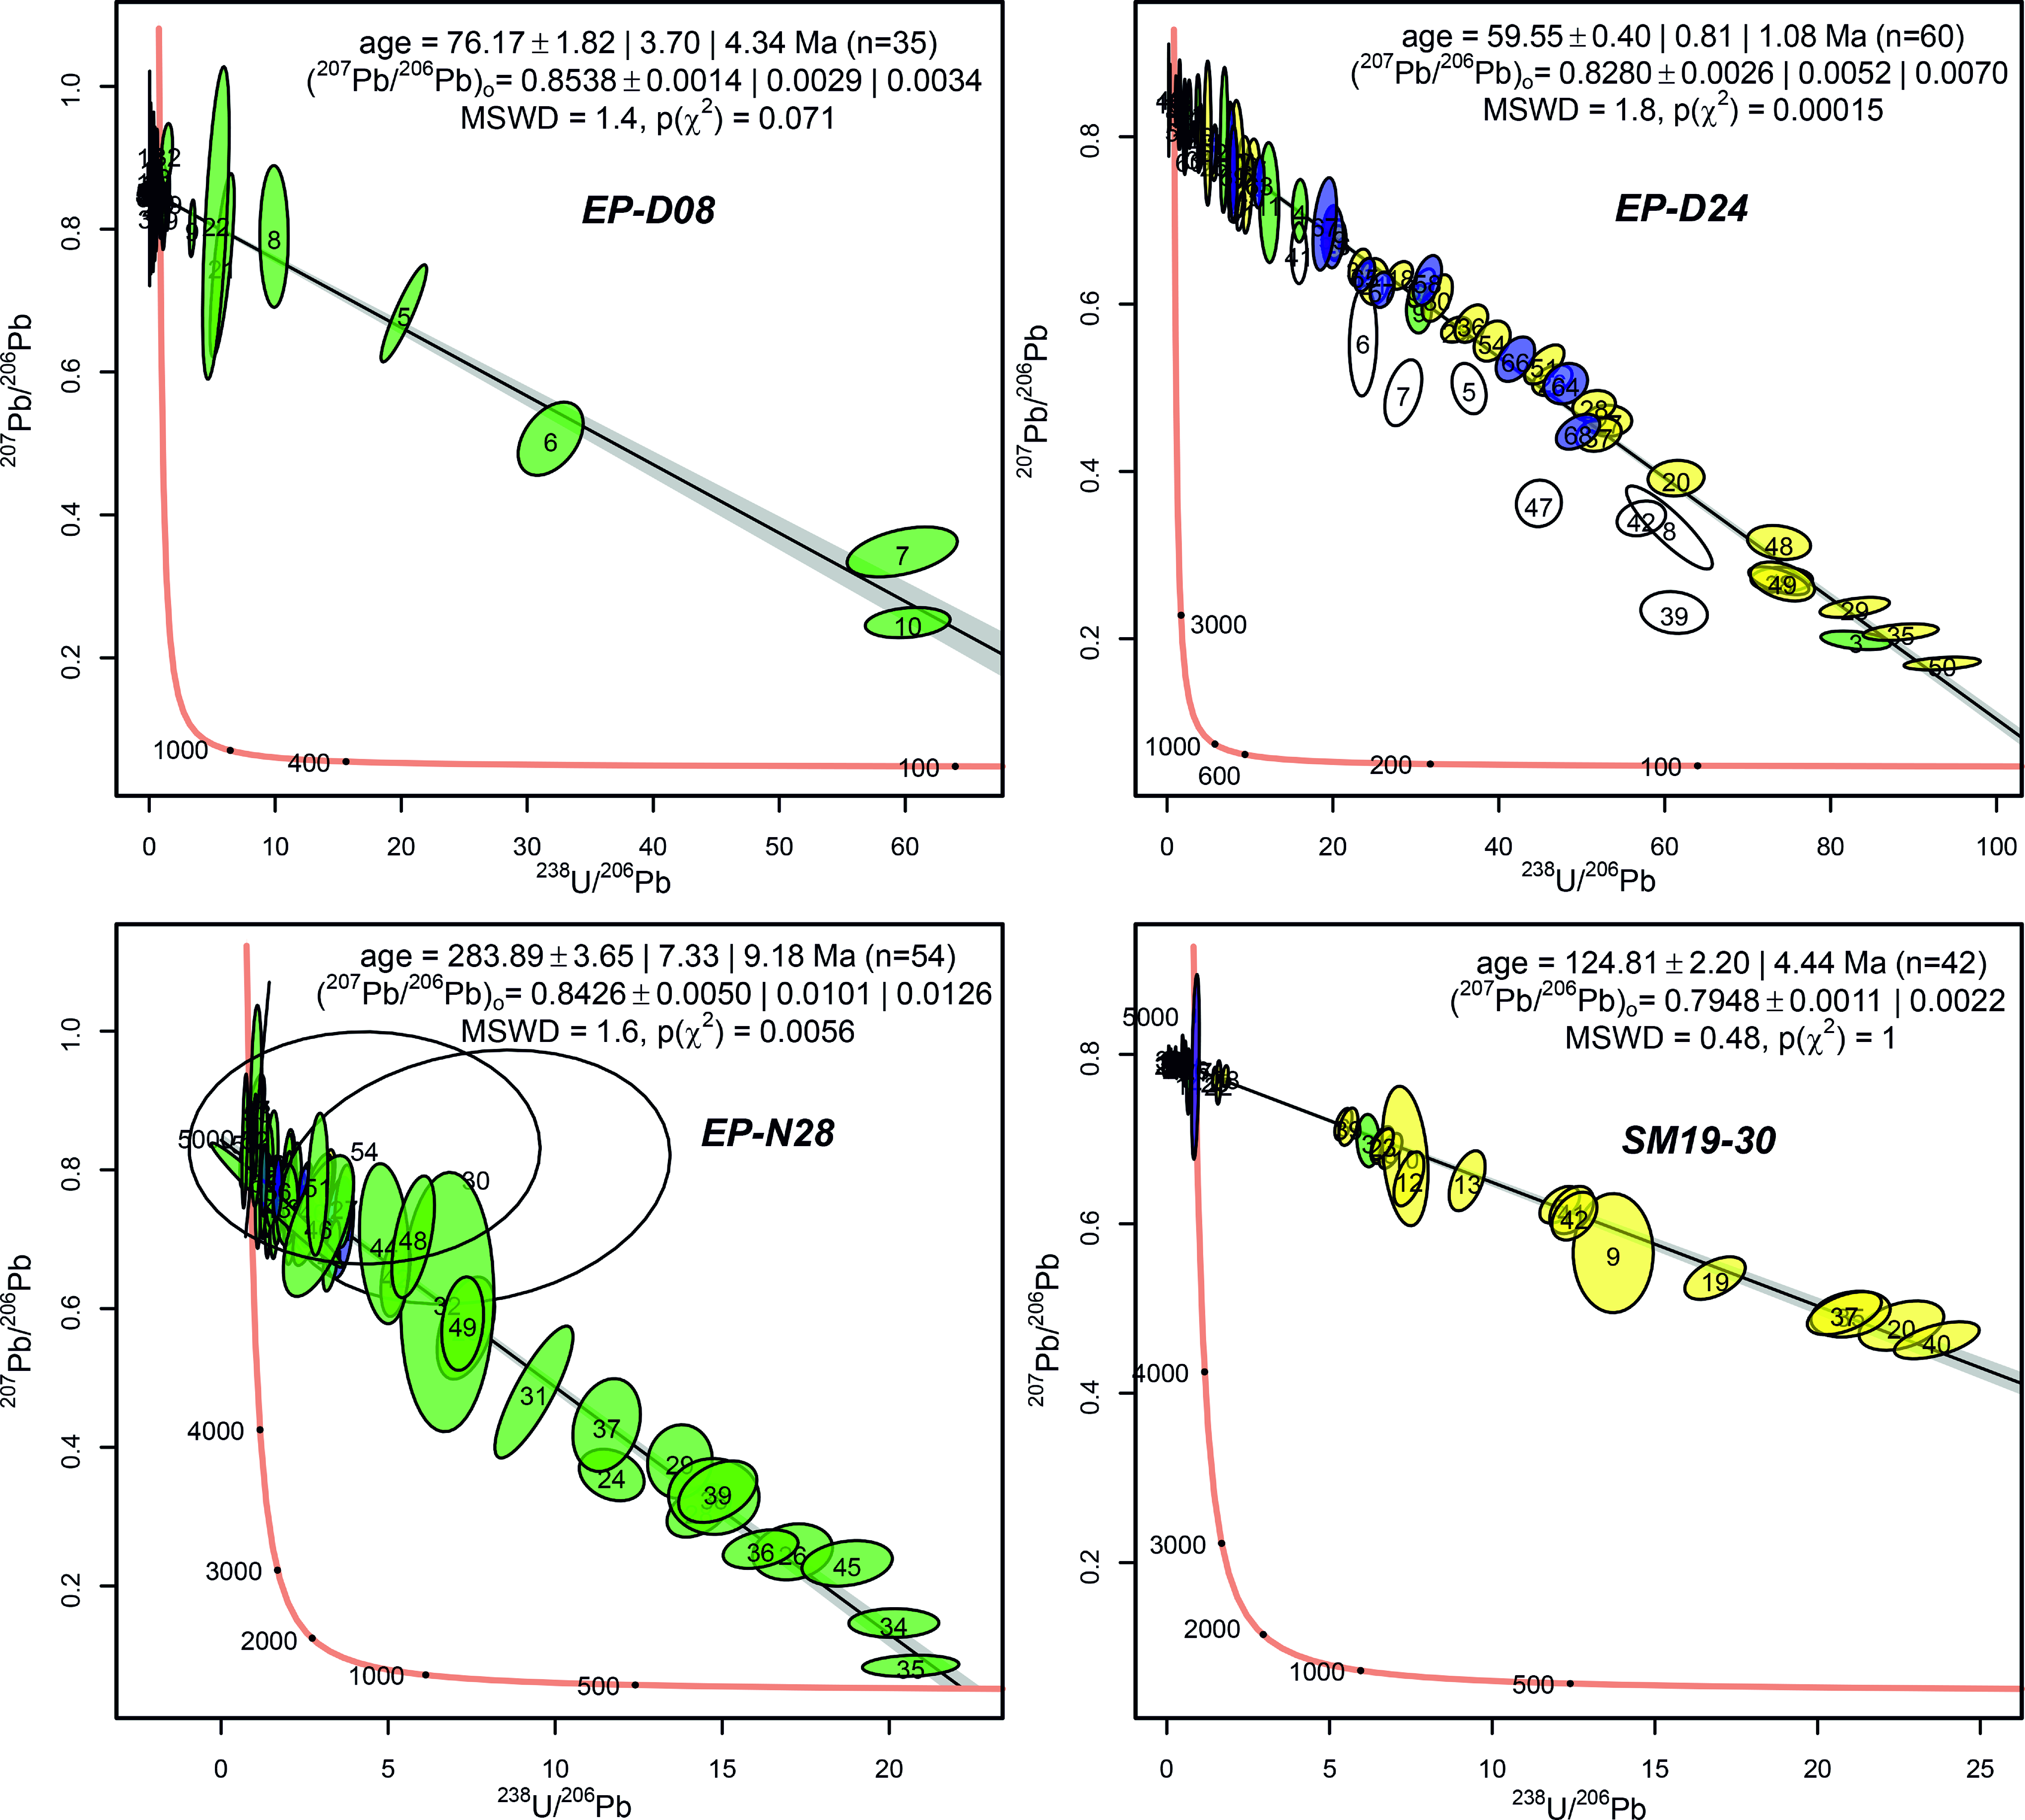
Sample EP-D24 is located in the western part of the Danil River area within sandstones of the Lower Triassic Ust-Olenek Group (Fig. 16a). Two slickensides, including the sampled one, were measured at this site and both are related to the thrust faulting stress field (Fig. 15a; online Supplementary Table S1 at https://doi.org/10.1017/S0016756822000528). The sampled slickenside represents a mode II shear vein of ∼5 mm thickness and consists mainly of granular, blocky calcite crystals (Fig. 17b). CL imagery shows zoning sub-parallel to the vein orientation, indicating variation in fluid geochemistry or precipitation kinematics (Pagel et al. Reference Pagel, Barbin, Blanc and Ohnenstetter2000). Sixty-nine U–Pb point measurements were conducted. However, nine measurements do not intercept with the discordia line and were excluded from the resulting age constraint. Hence, 60 out of 69 isotopic measurements yield a lower intercept age of 59.55 ± 1.08 Ma (Fig. 18; online Supplementary Table S2 at https://doi.org/10.1017/S0016756822000528). The point measurements that do not intercept with the concordia line are not restricted to a particular area in the sample, which indicates local lead loss rather than variable calcite ages (Fig. 17b).
Sample EP-N28 is located in the hinge zone of the Chekurovka anticline, Neleger River area, within carbonates of the Neoproterozoic Neleger Formation (Fig. 16b). Slickensides related to thrust, normal, and strike-slip faulting stress fields were identified at this location (online Supplementary Table S1 at https://doi.org/10.1017/S0016756822000528). The sampled slickenside is related to the strike-slip faulting stress field and is located within a larger ductile shear zone. The ∼3 mm thick mode II shear vein comprises stacked sheets of veinlets parallel to the macroscopic fracture (Fig. 17c). The CL image shows that the luminescence of the different veinlets is identical, separated by dull contact zones. Fifty-six isotopic point measurements were done and two measurements with large errors were excluded from the following interpretation (see Fig. 17c). After deleting these measurements, 54 out of 56 isotopic point measurements yield a lower intercept age of 283.89 ± 9.18 Ma (Fig. 18; online Supplementary Table S2 at https://doi.org/10.1017/S0016756822000528).
Sample SM19-30 is located on the west limb of the Chekurovka anticline, Neleger River area, in the massive carbonates of the Sietachan Formation of the footwall of the Chekurovka thrust (Fig. 16b). The sampled slickenside is a ∼5 mm thick mode II shear vein (Fig. 17d) related to the thrust faulting stress field (online Supplementary Table S1 at https://doi.org/10.1017/S0016756822000528). The CL image illustrates that most of the vein shows no or dull luminescence with zoning, and two smaller crystal clusters of intense luminescence. Very fine luminous calcite-filled cracks are oriented sub-parallel to the macroscopic vein (Fig. 17d). Forty-two isotopic measurements yield a lower intercept age of 124.81 ± 4.44 Ma (Fig. 18; online Supplementary Table S2 at https://doi.org/10.1017/S0016756822000528).
5. Discussion
5.a. Timing of northern Verkhoyansk FTB deformation
Traditionally, the age of compressional deformation events in the frontal ranges of the Verkhoyansk FTB is based on the stratigraphic record of the Priverkhoyansk foreland basin to its west (Galabala, Reference Galabala and Shilo1971; Parfenov et al. Reference Parfenov, Prokopiev and Gaiduk1995; Malyshev et al. Reference Malyshev, Khudoley, Prokopiev, Ershova, Kazakova and Terentyeva2016; Vereshchagin et al. Reference Vereshchagin, Khudoley, Ershova, Prokopiev and Schneider2018). Deposition of the coarse-grained Cretaceous clastic rocks, interpreted as erosion product of the Verkhoyansk FTB, started in the Barremian and lasted up to the Danian, occupying the timespan approximately from 130 to 60 Ma and pointing to the occurrence of two major deformation events in the Early and Late Cretaceous (Galabala, Reference Galabala and Shilo1971; Parfenov et al. Reference Parfenov, Prokopiev and Gaiduk1995). The Early Cretaceous event led to significant changes in the provenance of sandstones from the Priverkhoyansk foreland basin documented by heavy mineral analysis, whole-rock isotopic Sm–Nd ratios and U–Pb detrital zircon studies (Kossovskaya, Reference Kossovskaya1962; Malyshev et al. Reference Malyshev, Khudoley, Prokopiev, Ershova, Kazakova and Terentyeva2016; Vereshchagin et al. Reference Vereshchagin, Khudoley, Ershova, Prokopiev and Schneider2018). Two deformation events were also supported by direct observations of folds with NW–SE and N–S trends and the recognition of two thrust faulting stress fields with NE–SW and E–W compression axes. However, the NW–SE trending folds and their corresponding stress field were interpreted to be younger and related to the formation of the OFZ (Parfenov, Reference Parfenov1988; Mikulenko et al. Reference Mikulenko, Sitnikov, Skrjabin and Timirshin1997; Prokopiev & Deikunenko, Reference Prokopiev, Deikunenko, Parfenov and Kuzmin2001; Gonchar, Reference Gonchar2016). More recently, important age constraints resulted from U–Pb dating of mafic dykes and apatite fission track (AFT) studies: three mafic dykes of variable orientation but always cutting N–S-trending folds were mapped to the east from the Danil River area and yielded 86 ± 1, 86 ± 4 and 89 ± 2 Ma U–Pb zircon ages (Fig. 2; Prokopiev et al. Reference Prokopiev, Khudoley, Egorov, Gertseva, Afanasieva, Sergeenko, Ershova and Vasiliev2013; Gertseva et al. Reference Gertseva, Borisova, Chibisova, Emelyanova, Cherenkov, Ignateva, Kotov, Istoshina and Fedoseev2016). Such a relationship clearly shows that in the eastern part of the Kharaulakh segment, folding occurred before the Coniacian stage (c. 90–86 Ma). However, a preliminary AFT study of detrital apatite from seven samples of Jurassic and Lower Cretaceous siliciclastic rocks in the Priverkhoyansk foreland basin near the Chekurovka anticline points to a main cooling event at c. 75–60 Ma, likely related to the final displacement and uplift along the Chekurovka thrust (Vasiliev et al. Reference Vasiliev, Prokopiev, Khudoley, Ershova, Kazakova and Fridovsky2019).
Our data help to improve the interpretation of the tectonic evolution of the northern Verkhoyansk FTB. Almost all outcrop- and map-scale folds and thrusts documented in the Danil and Neleger river areas exhibit approximately N–S trends (Figs 5, 9, 10, 12). This trend is roughly perpendicular to the main compressional axis of the thrust faulting stress field (Fig. 15a), indicating that fold-and-thrust structures of the study areas were both formed in a similar or the same stress field. However, although AFT data from the Priverkhoyansk foreland basin support a cooling and uplift event at 75–60 Ma, the U–Pb calcite age from the adjacent footwall of the Chekurovka thrust (sample SM19-30) is older, yielding an age of ∼125 Ma of thrust displacement (Fig. 18). This event is also older than the c. 90–86 Ma intrusion of dykes cutting regional-scale folds and fits with the significant modification of the source area of the clastic sediments in the Priverkhoyansk foreland basin (Kossovskaya, Reference Kossovskaya1962; Galabala, Reference Galabala and Shilo1971; Prokopiev et al. Reference Prokopiev, Khudoley, Egorov, Gertseva, Afanasieva, Sergeenko, Ershova and Vasiliev2013; Gertseva et al. Reference Gertseva, Borisova, Chibisova, Emelyanova, Cherenkov, Ignateva, Kotov, Istoshina and Fedoseev2016; Malyshev et al. Reference Malyshev, Khudoley, Prokopiev, Ershova, Kazakova and Terentyeva2016; Vereshchagin et al. Reference Vereshchagin, Khudoley, Ershova, Prokopiev and Schneider2018). The slickensides along fault planes cross-cutting the Permian rocks of the Danil River area (samples EP-D08, EP-D24) revealed U–Pb calcite ages of ∼76–60 Ma (Fig. 18), comparable to AFT ages from the Priverkhoyansk foreland basin (Vasiliev et al. Reference Vasiliev, Prokopiev, Khudoley, Ershova, Kazakova and Fridovsky2019), but are younger than 90–86 Ma dykes that cut the N–S-trending regional folds (Prokopiev et al. Reference Prokopiev, Khudoley, Egorov, Gertseva, Afanasieva, Sergeenko, Ershova and Vasiliev2013; Gertseva et al. Reference Gertseva, Borisova, Chibisova, Emelyanova, Cherenkov, Ignateva, Kotov, Istoshina and Fedoseev2016). Based on the composite data from the sedimentary record, AFT and U–Pb zircon and calcite U–Pb studies, we interpret a main compressional event forming the fold-and-thrust structure of the northern Verkhoyansk FTB at c. 125 Ma (Barremian). A second event occurred at c. 76–60 Ma (Maastrichtian–Danian) and also affected the entire northern Verkhoyansk FTB area. However, this event was less intense and mainly resulted in the reactivation of pre-existing thrusts. The general E–W trend of compression corresponds to the deformation of the Verkhoyansk FTB and not of the OFZ, which exhibits differently oriented folds and faults (Parfenov et al. Reference Parfenov, Prokopiev and Gaiduk1995; Prokopiev & Deikunenko, Reference Prokopiev, Deikunenko, Parfenov and Kuzmin2001; Gonchar, Reference Gonchar2016).
The only map-scale extensional structure in the study area is the Kengdei Graben, filled in with Palaeocene–Eocene sediments (Fig. 2). The outcrop-scale normal faults of the investigated area are typically associated with the Kengdei Graben (Fig. 16a). The trend of the Kengdei Graben varies from approximately N–S to NNW–SSE. The approximate W–E trend of the extension axis of the normal faulting stress field is roughly perpendicular to the Kengrei Graben’s trend, although some variations in its trend may point to the occurrence of a dextral displacement component along the normal faults (Fig. 16b). The strike-slip faults included in the normal faulting stress field show predominantly dextral displacement. Based on the age of the oldest sedimentary rocks of the Kengdei Graben, the age of the normal faulting stress field is inferred to be Palaeocene–Eocene, immediately following the youngest thrusting event (∼76–60 Ma).
Slickensides with a predominance of strike-slip displacement were recorded throughout the Neleger and Danil river areas (Figs. 14, 15c; online Supplementary Table S1 at https://doi.org/10.1017/S0016756822000528), but no strike-slip faulting stress field could be constrained for the Danil River area (Fig. 16a). In the Neleger River area, a strike-slip faulting stress field is recognized in the area with wide distribution of shear zones (Figs 13, 16b). There is a similarity in the spatial distribution and the orientation of reconstructed stress fields of shear zones and strike-slip faults (Figs. 13, 15c), although the number of measurements of shear zones is quite small. Thus, the shear zones and the strike-slip faulting stress field are most likely related to the same tectonic event. With this interpretation, the age of strike-slip faulting stress field and related shear zones is identified by U–Pb calcite dating of sample EP-N28 at ∼284 Ma (Early Permian), which represents the most ancient tectonic event in the Kharaulakh segment, not recognized in previous studies of the Verkhoyansk FTB (Fig. 18).
5.b. Correlation of deformation events in northern Verkhoyansk and adjacent fold-and-thrust belts
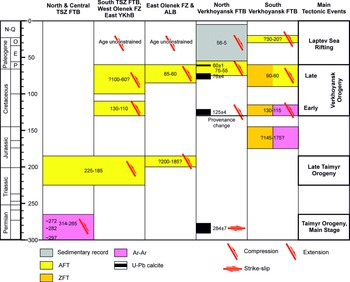
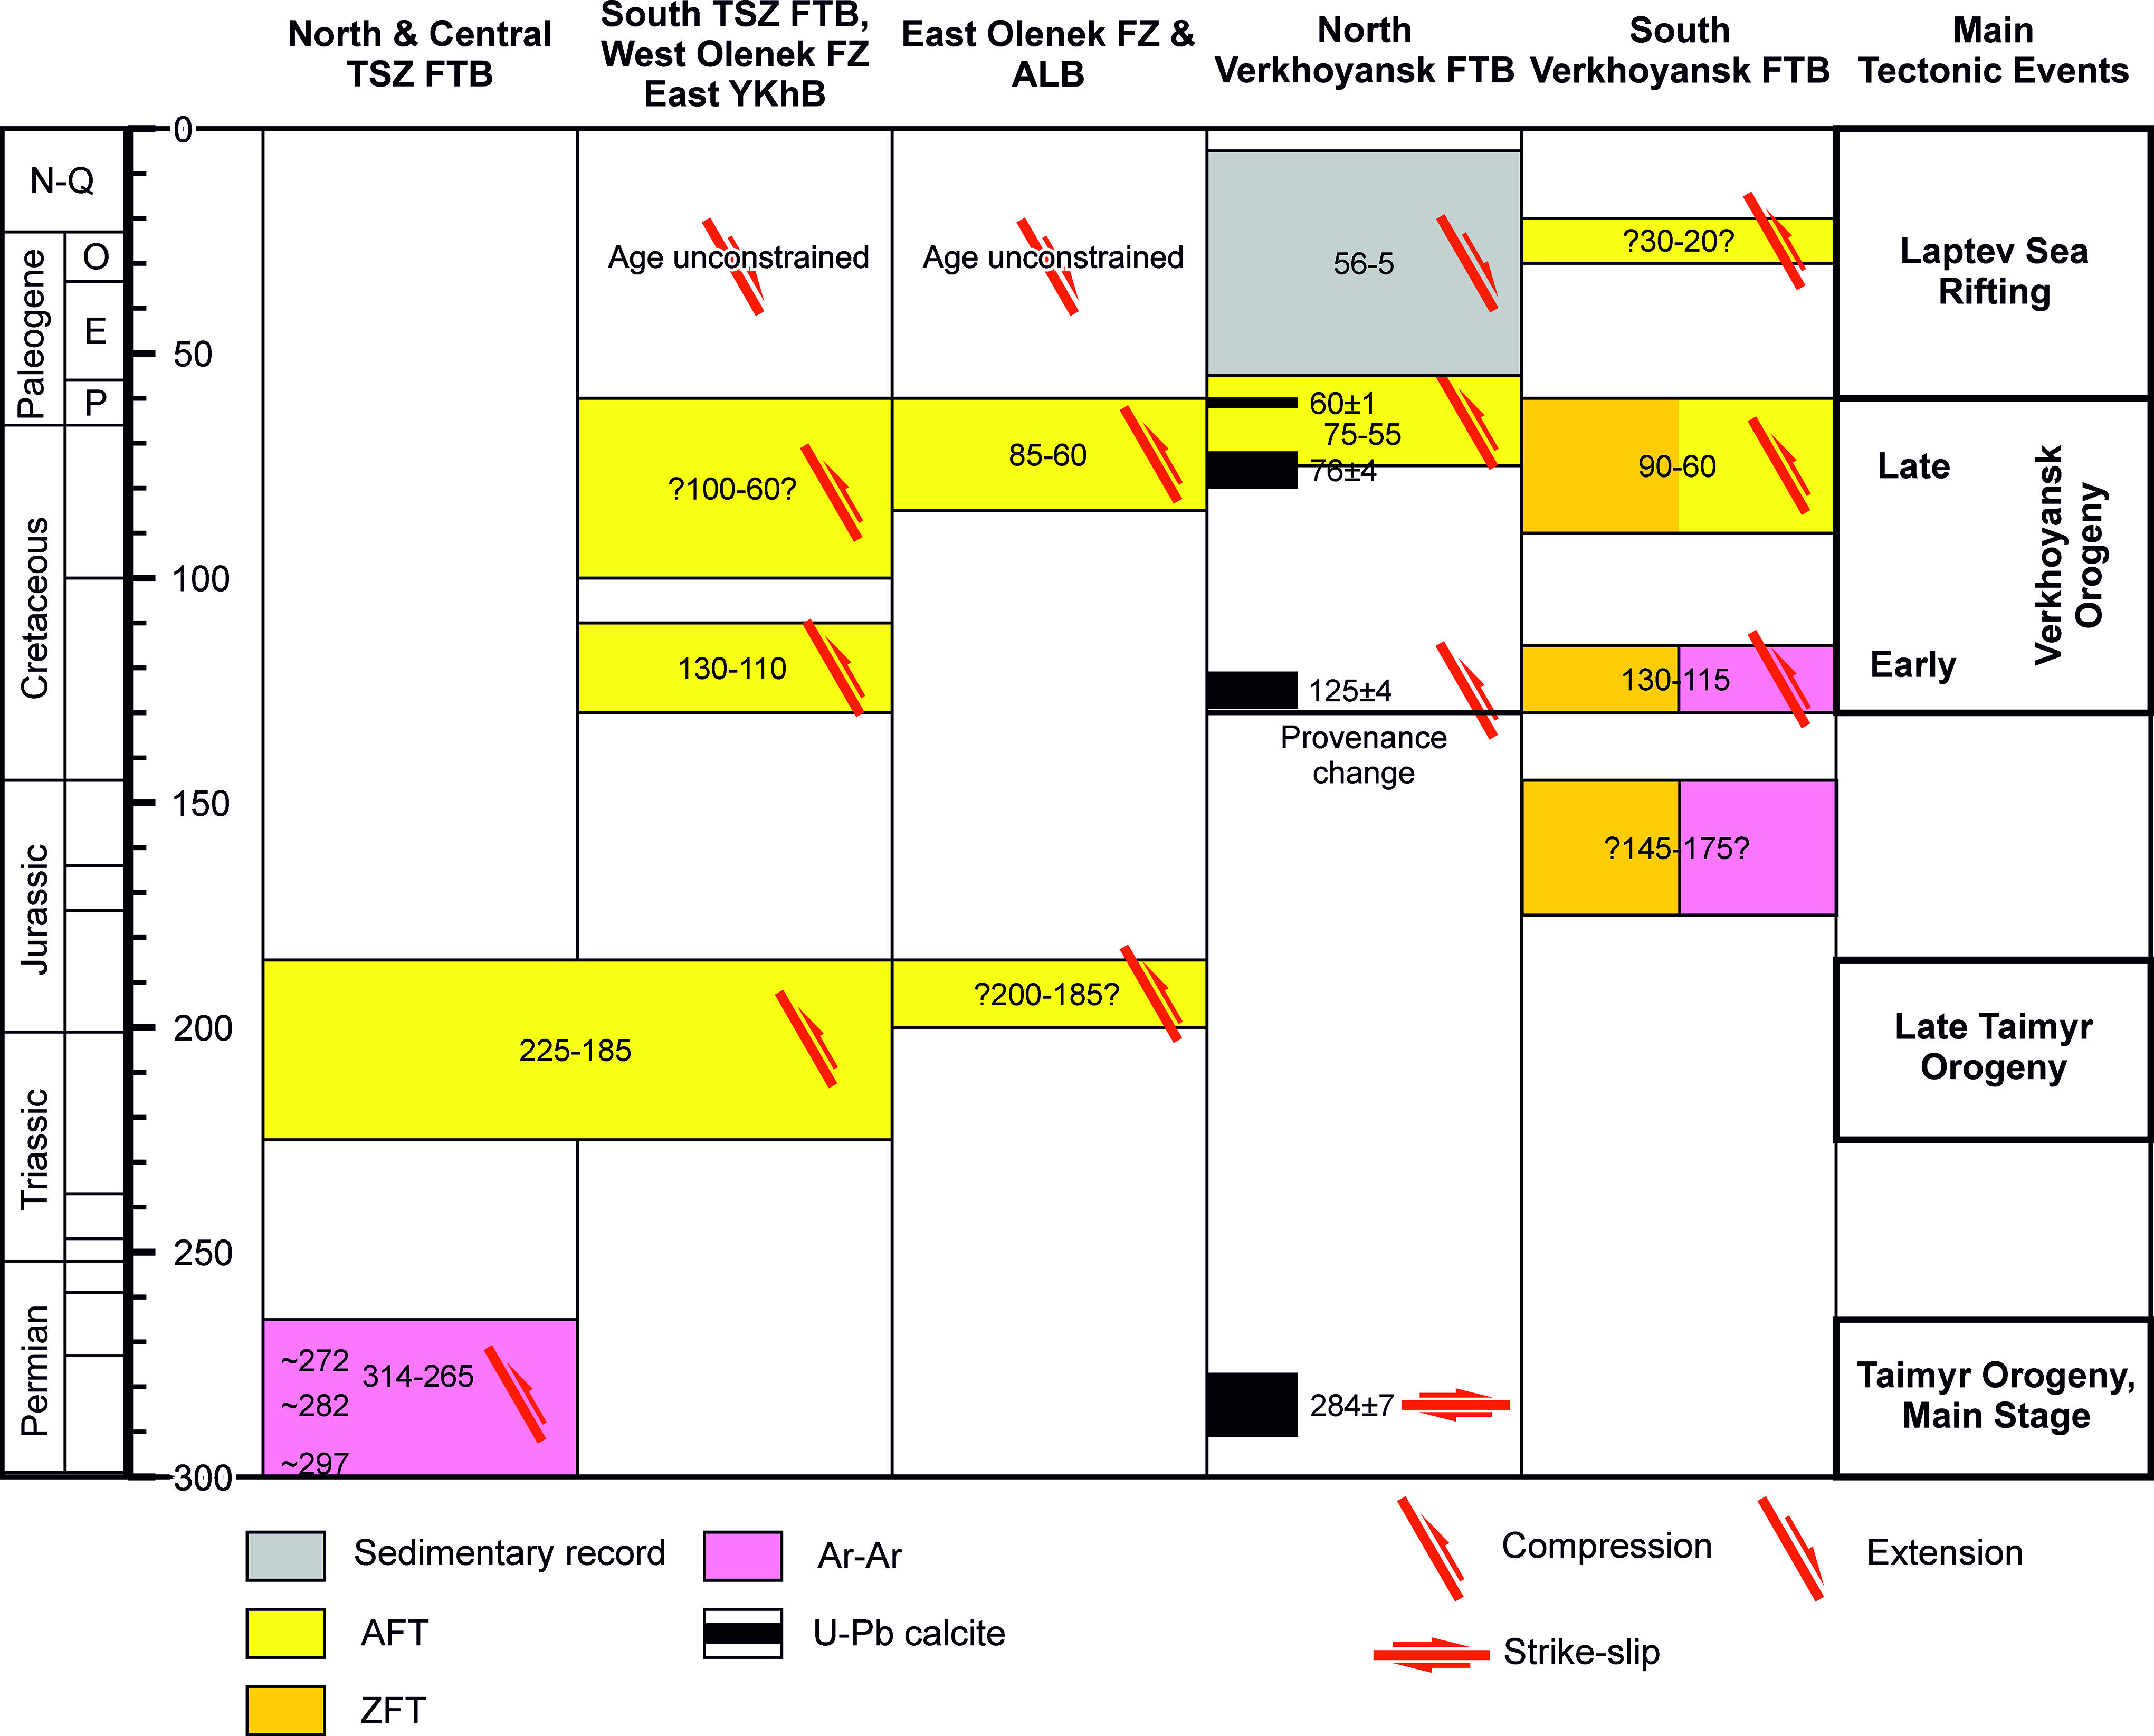
The Kharaulakh segment is located at the junction of fold-and-thrust belts that frame the Siberian Craton from the north and east (Figs. 1, 2). New constraints on the age and the style of deformation give way to correlate tectonic events along the margins of the Siberian Craton. A summary of available data is presented in Figs. 19, 20.
Correlation diagram for pre-Quaternary deformation events on the north and east margins of the Siberian Craton. Data from Vasiliev & Prokopiev (Reference Vasiliev and Prokopiev2012), Khudoley et al. (Reference Khudoley, Verzhbitsky, Zastrozhnov, O’Sullivan, Ershova, Proskurnin, Tuchkova, Rogov, Kyser, Malyshev and Schneider2018), Kurapov et al. (Reference Kurapov, Ershova, Khudoley, Luchitskaya, Makariev, Makarieva and Vishnevskaya2021), Malyshev et al. (Reference Malyshev, Khudoley, Glasmacher, Kazakova and Kalinin2018), Vernikovsky et al. (Reference Vernikovsky, Shemin, Deev, Metelkin, Matushkin and Pervukhina2018), Vasiliev et al. (Reference Vasiliev, Prokopiev, Khudoley, Ershova, Kazakova and Fridovsky2019) and this study. TSZ FTB – Taimyr – Severnaya Zemlya FTB; YKhB –Yenisey–Khatanga Basin; ALB – Aldan–Lena basin. See text for discussion.
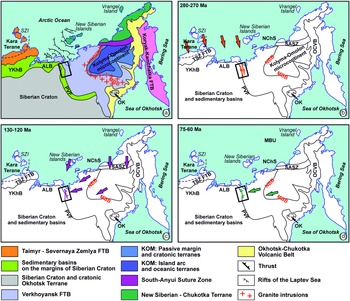
Tectonic evolution of the northern and eastern margin of Siberian Craton and adjacent areas. (a) Tectonic map. (b) 280–270 Ma: Kara Terrane – Siberian Craton collision. (c) 130–120 Ma: closure of the South Anyui Suture zone and late stages of the Kolyma–Omolon microcontinent and Siberian Craton collision. (d) 75–60 Ma: Kolyma–Omolon microcontinent and Siberian Craton post-collision interaction. TSZ FTB – Taimyr – Severnaya Zemlya FTB; NChS – New Siberian – Chukotka superterrane; SASZ – South-Anyui Suture Zone; KOM – Kolyma–Omolon microcontinent (superterrane); OK – Okhotsk cratonic terrane; OCVB – Okhotsk–Chukotka Volcanic Belt; YKhB – Yenisey–Khatanga Basin; ALB – Aldan–Lena basin; NBB – Northern Belt of batholiths; MBB – Main Belt of batholiths; MBU – Mid-Brookian Unconformity; SZI – Severnaya Zemlya Islands; PVF – Priverkhoyansk foredeep. Arrows show approximate tectonic transport direction. The rectangle shows location of Figure 2.
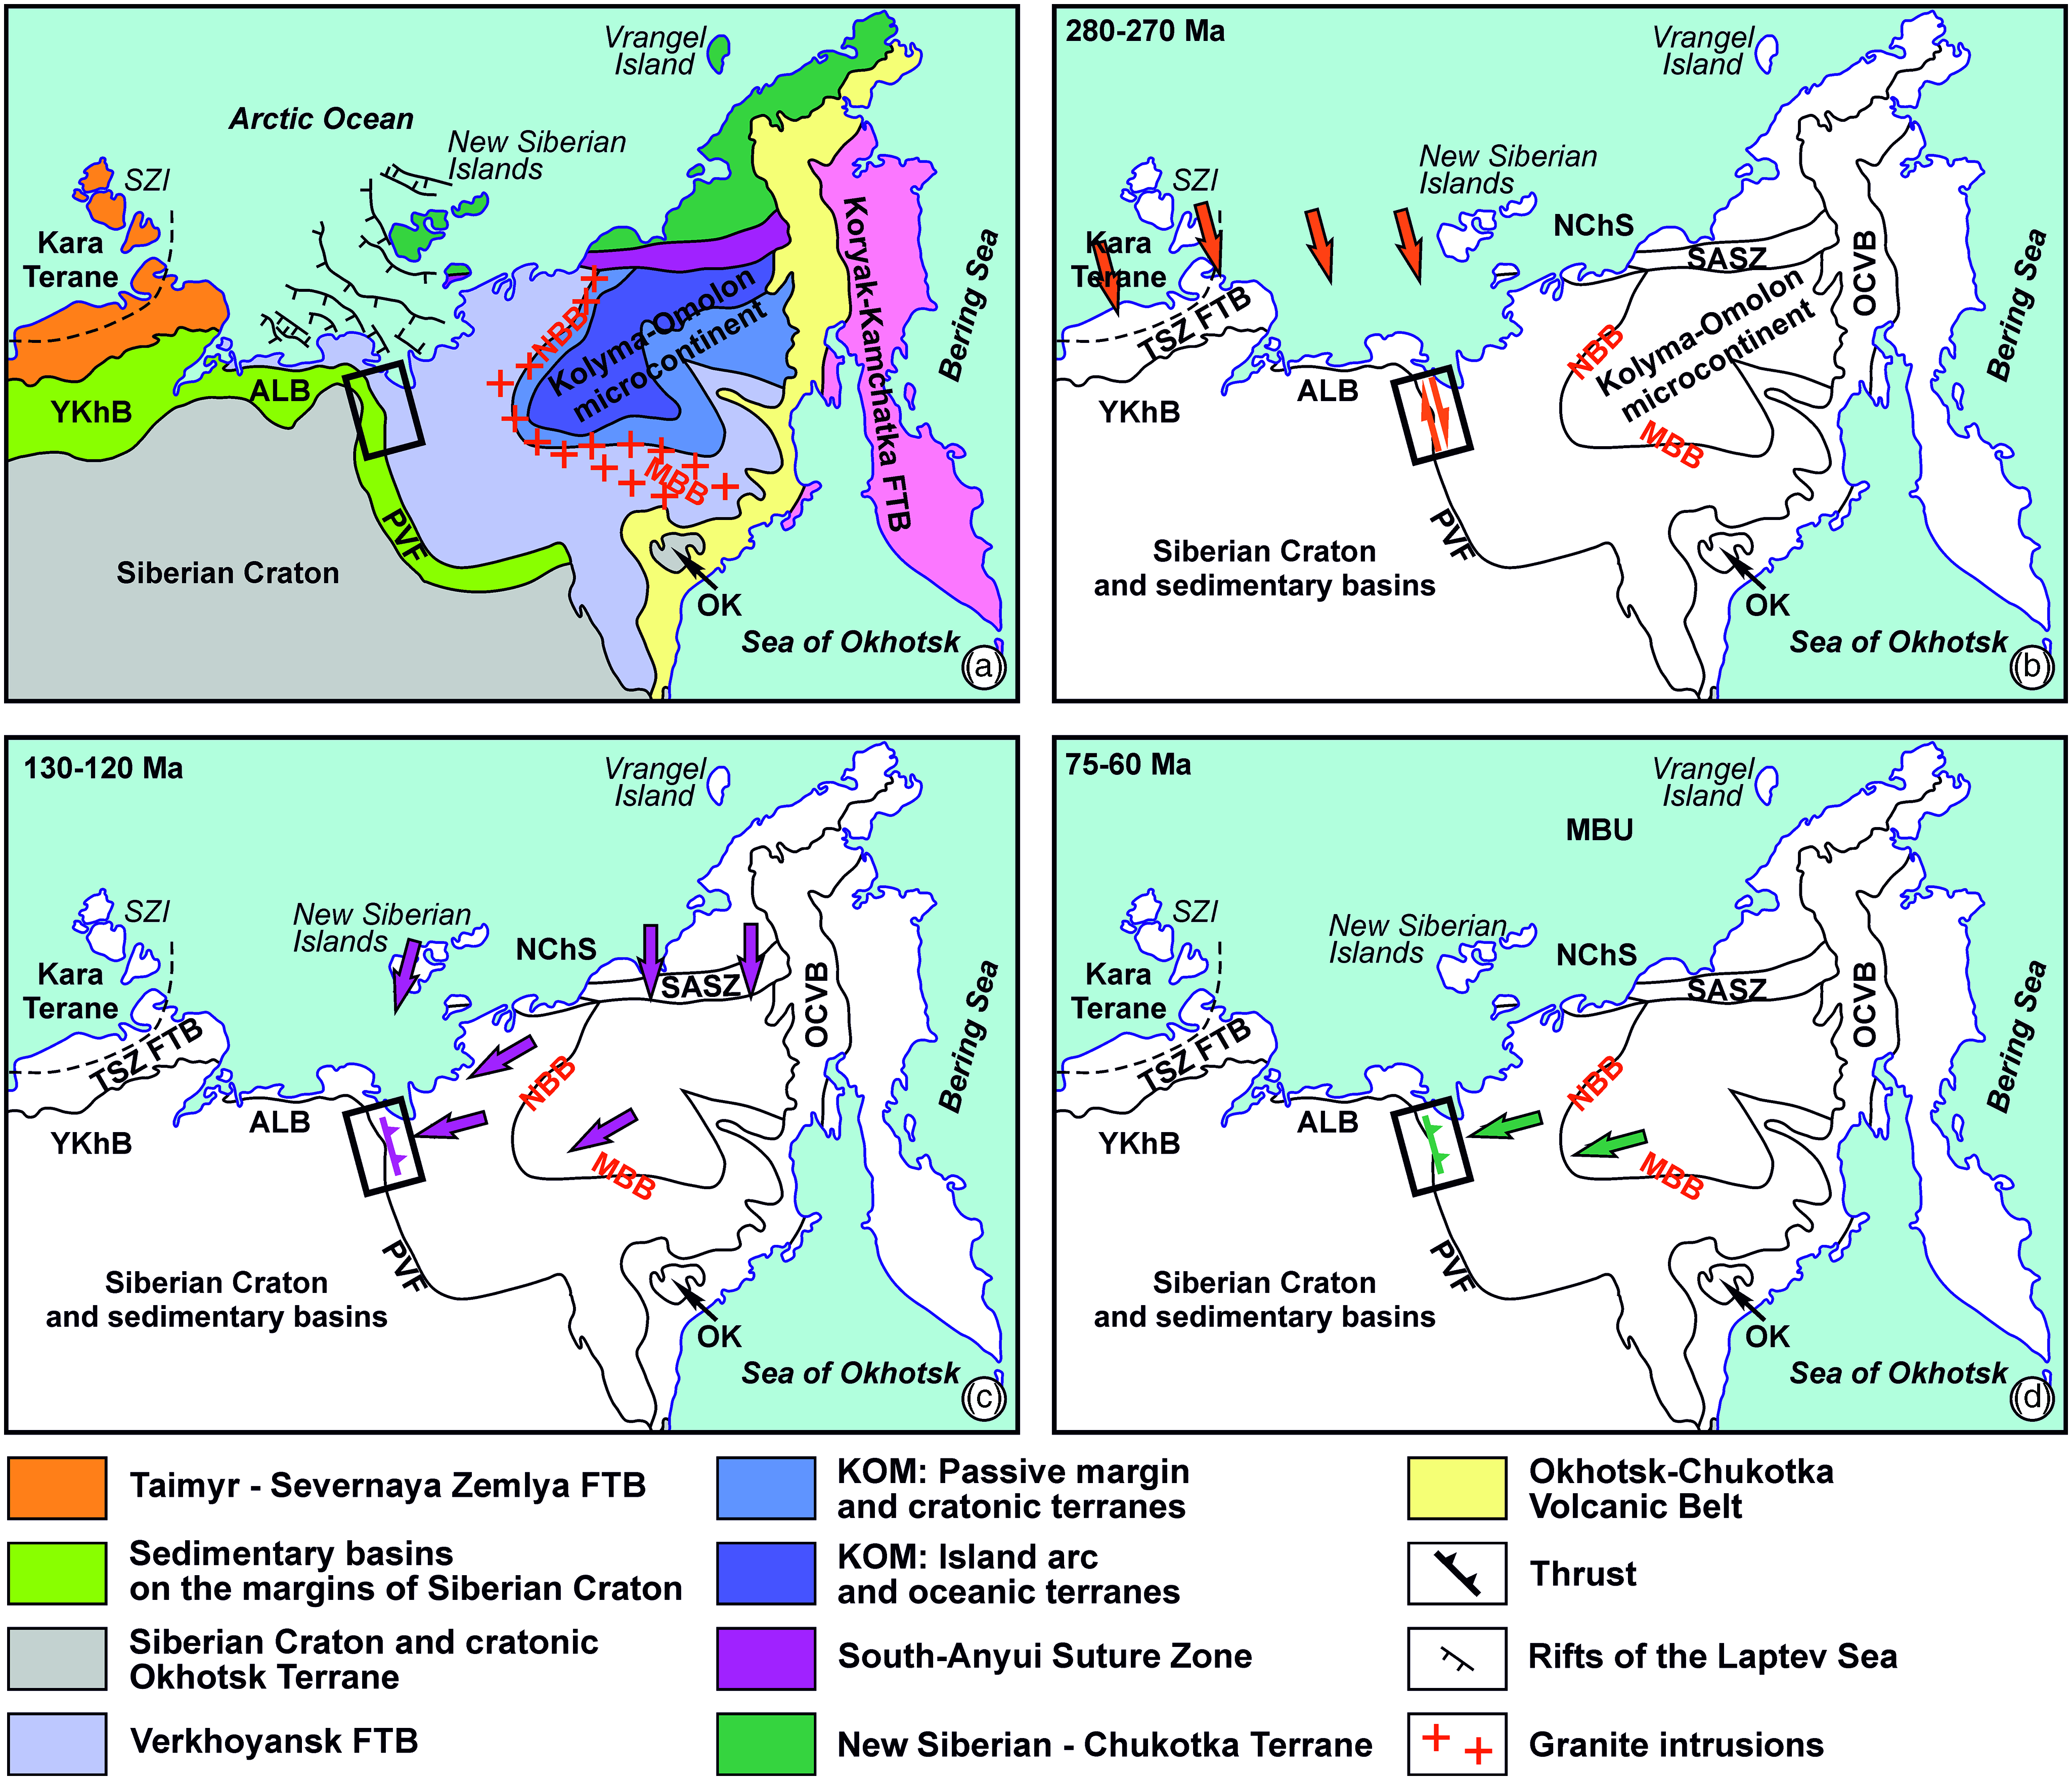
Recent geochronological studies of granite intrusions in the Taimyr – Severnaya Zemlya FTB based on Ar–Ar mica measurements reveal younger ages (288 ± 2 to 265 ± 3 Ma) than reported U–Pb zircon crystallization ages (345–285 Ma) of the intrusions (Kurapov et al. Reference Kurapov, Ershova, Khudoley, Luchitskaya, Makariev, Makarieva and Vishnevskaya2021). The Ar–Ar mica ages document a post-intrusion metamorphism and deformation of the Carboniferous granite intrusions and provide an estimation for the timing of the late Palaeozoic collision of the Kara terrane with the northern margin of the Siberian Craton (Kurapov et al. Reference Kurapov, Ershova, Khudoley, Luchitskaya, Makariev, Makarieva and Vishnevskaya2021, and references therein). This estimation nicely fits with data of geochemistry of these granites, which suggest that syn-collisional granite intrusions are older than 282 Ma, whereas post-collisional intrusions are younger than 264 Ma (Vernikovskiy et al. Reference Vernikovsky, Vernikovskaya, Proskurnin, Matushkin, Proskurnina, Kadilnikov, Larionov and Travin2020). Our Early Permian U–Pb calcite age of 284 ± 7 Ma correlates with the late Palaeozoic collision along the northern margin of the Siberian Craton and suggests that formation of the ductile shear zones in the central part of the Chekurovka anticline is a far-field response to that tectonic event (Figs 19, 20b).
Most of the outer part of the Verkhoyansk FTB and adjacent parts of the Siberian Craton are hidden below Permian and Mesozoic rocks, restricting the evaluation of the spatial distribution of corresponding structures to the south of the Chekurovka anticline. However, in the Verkhoyansk FTB, Permian rock units conformably overlay Carboniferous siliciclastic rocks (Parfenov et al. Reference Parfenov, Prokopiev and Gaiduk1995; Prokopiev et al. Reference Prokopiev, Parfenov, Tomshin, Kolodeznikov, Parfenov and Kuzmin2001; Khudoley & Prokopiev, Reference Khudoley, Prokopiev, Sears, Harms and Evenchick2007). Furthermore, recent seismic studies support the occurrence of a single Upper Carboniferous (Pennsylvanian) – Permian rock unit in the Yenisey–Khatanga and Anabar–Lena basins on the northern margin of the Siberian Craton (Afanasenkov et al. Reference Afanasenkov, Nikishin, Unger, Bordunov, Lugovaya, Chikishev and Yakovishina2016; Vernikovsky et al. Reference Vernikovsky, Shemin, Deev, Metelkin, Matushkin and Pervukhina2018), although the stratigraphy of this unit needs verification. In contrast, on the Olenek uplift of the northeast Siberian Craton (Fig. 1) and along the northeastern and eastern margins of the Siberian Craton, Permian rocks locally unconformably overlay older rock units similarly to the Chekurovka anticline (Prokopiev et al. Reference Prokopiev, Parfenov, Tomshin, Kolodeznikov, Parfenov and Kuzmin2001; Grinenko et al. Reference Grinenko, Yuganova, Trushchelev, Malanin, Smetannikova, Knyazev, Prokopiev, Kazakova and Protopopov2013; Kontorovich et al. Reference Kontorovich, Kontorovich, Gubin, Zoteev, Lapkovsky, Malyshev, Soloviev and Fradkin2013). Thus, we hypothesize that the origin of pre- or Early Permian uplifts and the erosion of older rocks in the northeastern and eastern Siberian Craton are related to faulting, with corresponding changes in the basement topography, induced by the late Palaeozoic compression in the Taimyr – Novaya Zemlya FTB. Correlation of late Palaeozoic tectonic events in the Taimyr – Severnaya Zemlya FTB and Kharaulakh segment also implies that the suture zone between the Kara terrane and the Siberian Craton extended far to the east of its modern termination (Fig. 20b), but was likely overprinted during Cenozoic rifting and opening of the Laptev Sea sedimentary basin. However, a more detailed study is necessary to verify these interpretations.
No evidence for tectonic events from Permian to Cretaceous were identified in the Kharaulakh segment. Thus, neither 225–185 Ma (Late Triassic – Early Jurassic) deformation widespread in the Taimyr – Novaya Zemlya FTB and locally in the OFZ and adjoining basins on the northern margin of the Siberian Craton (Khudoley et al. Reference Khudoley, Verzhbitsky, Zastrozhnov, O’Sullivan, Ershova, Proskurnin, Tuchkova, Rogov, Kyser, Malyshev and Schneider2018; Zhang et al. Reference Zhang, Pease, Carter, Kostuychenko, Suleymanov, Scott, Pease and Coakley2018; Vasiliev et al. Reference Vasiliev, Prokopiev, Khudoley, Ershova, Kazakova and Fridovsky2019), nor the c. 160 Ma (Late Jurassic) metamorphic event recorded in the South Verkhoyansk sector (Prokopiev et al. Reference Prokopiev, Toro, Hourigan, Bakharev and Miller2009; Malyshev et al. Reference Malyshev, Khudoley, Glasmacher, Kazakova and Kalinin2018) was recognized in the Danil and Neleger river areas.
The Early Cretaceous (130–120 Ma) deformation is well documented in the outer part of the Verkhoyansk FTB in the South Verkhoyansk sector (Malyshev et al. Reference Malyshev, Khudoley, Glasmacher, Kazakova and Kalinin2018 and references therein) and in the West Verkhoyansk sector (Galabala, Reference Galabala and Shilo1971; Parfenov et al. Reference Parfenov, Prokopiev and Gaiduk1995) (Fig. 20c). In the South Verkhoyansk, this event marks the second stage of thrusting, whereas the most intense deformation occurred later. Within the northern Verkhoyansk FTB (Kharaulakh segment), the Early Cretaceous event (c. 130–120 Ma) is supposed to have resulted in the most intense regional deformation. Similar uplift ages are reported from the southern part of the Taimyr – Novaya Zemlya FTB and the western part of the OFZ, but they are interpreted to be associated with local deformations (Khudoley et al. Reference Khudoley, Verzhbitsky, Zastrozhnov, O’Sullivan, Ershova, Proskurnin, Tuchkova, Rogov, Kyser, Malyshev and Schneider2018).
The Early Cretaceous deformation is close in age to several tectonic events documented to the east from the Verkhoyansk FTB. Although U–Pb zircon ages of crystallization of most granite intrusions in the Main Belt of batholiths average c. 150 Ma (Akinin et al. Reference Akinin, Miller, Toro, Prokopiev, Gottlieb, Pearcey, Polzunenkov and Trunilina2020), Ar–Ar ages of the same intrusions are younger (143–138 Ma) and nicely fit to c. 140–135 Ma (U–Th)/He zircon cooling ages likely representing the age of the main stage of the Kolyma–Omolon microcontinent – Siberian Craton collision (Layer et al. Reference Layer, Newberry, Fujita, Parfenov, Trunilina and Bakharev2001; Prokopiev et al. Reference Prokopiev, Ershova and Stockli2019). The Early Cretaceous deformation of the Kharaulakh segment (130–120 Ma) may reflect the latest stages of the Kolyma–Omolon microcontinent – Siberian Craton collision. Further temporal coincidences include (i) granitic intrusions throughout the Verkhoyansk FTB (Fig. 1) and in the Northern Belt of granitoid batholiths, located to the east of the Kharaulakh segment (Fig. 20; Layer et al. Reference Layer, Newberry, Fujita, Parfenov, Trunilina and Bakharev2001; Prokopiev et al. Reference Prokopiev, Toro, Hourigan, Bakharev and Miller2009, Reference Prokopiev, Borisenko, Gamyanin, Pavlova, Fridovsky, Kondrat’eva, Anisimova, Trunilina, Ivanov, Travin, Koroleva, Vasiliev and Ponomarchuk2018 a; Shishkin et al. Reference Shishkin, Sinkova, Sergeev, Lokhov, Snezhko, Kovalenko, Baranov, Yakovlev, Ivanova, Lokhov, Goloudin, Buchnev and Maiskaya2017; Akinin et al. Reference Akinin, Miller, Toro, Prokopiev, Gottlieb, Pearcey, Polzunenkov and Trunilina2020), (ii) the closure of an oceanic basin and formation of the South Anyui Suture zone (Fig. 20; Sokolov et al. Reference Sokolov, Tuchkova, Ledneva, Luchitskaya, Ganelin, Vatrushkina and Moiseev2021), and (iii) compressional deformation in the New Siberian Islands (Prokopiev et al. Reference Prokopiev, Ershova, Anfinson, Stockli, Powell, Khudoley, Vasiliev, Sobolev and Petrov2018 b). However, compressional axes inferred in the New Siberian Islands and thrust sheet displacements in the South Anyui Suture zone show approximately N–S to NE–SW directions, which is roughly perpendicular to that in the northern Verkhoyansk FTB (Figs 15, 20c; Amato et al. Reference Amato, Toro, Akinin, Hampton, Salnikov and Tuchkova2015; Brandes et al. Reference Brandes, Piepjohn, Dieter, Sobolev and Gaedicke2015; Prokopiev et al. Reference Prokopiev, Ershova, Anfinson, Stockli, Powell, Khudoley, Vasiliev, Sobolev and Petrov2018 b; Sokolov et al. Reference Sokolov, Tuchkova, Ledneva, Luchitskaya, Ganelin, Vatrushkina and Moiseev2021). The closure of the South Anyui Suture zone potentially triggered westward displacement of the northern Verkhoyansk FTB which corresponds to the c. 130–120 Ma deformation documented by our study (Fig. 20). This interpretation explains the decrease in intensity of deformation from the Kharaulakh segment towards the south (South Verkhoyansk sector) and the west (OFZ), away from the Northern Belt of batholiths and the South Anyui Suture zone (Fig. 20c).
The tectonic interpretation of the 100–90 Ma (Cenomanian–Turonian) event varies for different parts of the Verkhoyansk FTB. Layer et al. (Reference Layer, Newberry, Fujita, Parfenov, Trunilina and Bakharev2001) suggested a predominance of extensional environments, which is supported by the occurrence of 90–85 Ma old mafic dykes in the eastern part of the Kharaulakh segment (Prokopiev et al. Reference Prokopiev, Khudoley, Egorov, Gertseva, Afanasieva, Sergeenko, Ershova and Vasiliev2013; Gertseva et al. Reference Gertseva, Borisova, Chibisova, Emelyanova, Cherenkov, Ignateva, Kotov, Istoshina and Fedoseev2016). No structural evidence was found for corresponding tectonic events in the Danil and Neleger river areas and, if existing, they were probably overprinted by the reactivation of inherited faults. However, granite intrusions close in age were locally documented in various parts of the Verkhoyansk FTB (Fig. 1). In the South Verkhoyansk sector the third deformational stage started c. 90 Ma and is associated with the most intense thrusting events (Malyshev et al. Reference Malyshev, Khudoley, Glasmacher, Kazakova and Kalinin2018).
The final compressional stage occupied a timespan from c. 75 to 60 Ma (Campanian–Selandian; Figs 19, 20d). This stage is recognized throughout the northern and eastern margins of the Siberian Craton, but its intensity varies. In the South Verkhoyansk sector, it corresponds to the final stages and termination of the main deformation event (Malyshev et al. Reference Malyshev, Khudoley, Glasmacher, Kazakova and Kalinin2018; Prokopiev et al. Reference Prokopiev, Borisenko, Gamyanin, Pavlova, Fridovsky, Kondrat’eva, Anisimova, Trunilina, Ivanov, Travin, Koroleva, Vasiliev and Ponomarchuk2018 a). According to our study, major reactivation of thrusting occurred during this stage in the Kharaulakh segment. U–Pb calcite ages of slickensides presented here (76.17 ± 4.34 and 59.55 ± 1.08 Ma; Fig. 18) most probably correspond to an early and a late event within this long-term compressional stage. A preliminary AFT study of detrital apatites from 14 samples shows that this stage was the main deformation event in the eastern OFZ (Vasiliev et al. Reference Vasiliev, Prokopiev, Khudoley, Ershova, Kazakova and Fridovsky2019). However, in the western part of the OFZ, this event is poorly recognized (Khudoley et al. Reference Khudoley, Verzhbitsky, Zastrozhnov, O’Sullivan, Ershova, Proskurnin, Tuchkova, Rogov, Kyser, Malyshev and Schneider2018).
The Campanian–Selandian tectonic event does not have clear correlatives to the east from the outer part of the Verkhoyansk FTB. Recent study of the southern part of the Kolyma–Omolon microcontinent shows that highly deformed rocks previously mapped as Upper Carboniferous – Lower Permian contain numerous detrital zircons as young as 86–87 Ma and are actually Upper Cretaceous (Prokopiev et al. Reference Prokopiev, Ershova and Stockli2021). Their deformation may be related to the same tectonic event as that in the Kharaulakh segment. Conjugate strike-slip faults in the West Verkhoyansk sector of the Verkhoyansk FTB, which cut regional-scale west-vergent folds and thrusts and are associated with approximately E–W compression similar to that in the northern Verkhoyansk FTB (Figs. 1, 15), are other possible correlatives (Gusev, Reference Gusev1979; Parfenov et al. Reference Parfenov, Prokopiev and Gaiduk1995; Khudoley & Prokopiev, Reference Khudoley, Prokopiev, Sears, Harms and Evenchick2007). These deformations are related to continuing post-collision interaction between the Kolyma–Omolon microcontinent and Siberian Craton and likely triggered thrust reactivation in the northern Verkhoyansk FTB (Fig. 20). Alternatively, c. 75–60 Ma deformation is close in age to the Mid-Brookian Unconformity (MBU), widely recognized in the east Russian Arctic and Alaska shelf (Nikishin et al. Reference Nikishin, Petrov, Cloetingh, Malyshev, Morozov, Posamentier, Verzhbitsky, Freiman, Rodina, Startseva and Zhukov2021 and references therein), but the validity of this connection needs more testing.
Compressional deformation terminated in the Palaeocene, immediately followed by extension related to the formation of the Laptev Sea rift structures (Parfenov et al. Reference Parfenov, Prokopiev, Spector, Parfenov and Kuzmin2001; Drachev & Shkarubo, Reference Drachev, Shkarubo, Pease and Coakley2018 and references therein). Within the Kharaulakh segment, extensional environments are responsible for the formation of the Kengdei, Kunchin and other graben structures (Parfenov et al. Reference Parfenov, Prokopiev, Spector, Parfenov and Kuzmin2001; Prokopiev et al. Reference Prokopiev, Khudoley, Egorov, Gertseva, Afanasieva, Sergeenko, Ershova and Vasiliev2013; Imaev et al. Reference Imaev, Imaeva, Smekalin, Chipizubov, Ovsyuchenko and Kolodeznikov2018; Figs 2, 15b). Similar rift-related grabens are recognized in a wide area to the southeast of the Kharaulakh segment, but no structural evidence of the synchronous extension was recognized in the outer Verkhoyansk FTB, to the south of the Kharaulakh segment.
The post-Palaeocene tectonic evolution of the outer parts of fold-and-thrust belts framing the Siberian Craton is best recognized in the northern and eastern parts of the Kharaulakh segment, where most grabens filled with Cenozoic sedimentary rocks are located. Faults bounding Cenozoic rift-related grabens from the east were often reactivated as reverse faults (Imaev et al. Reference Imaev, Imaeva, Smekalin, Chipizubov, Ovsyuchenko and Kolodeznikov2018). A few reverse faults and gentle anticlines were reported from all Cenozoic grabens of the Kharaulakh segment. The age of the corresponding compression event is estimated to have occurred during the middle Pleistocene (Imaev et al. Reference Imaev, Imaeva, Smekalin, Chipizubov, Ovsyuchenko and Kolodeznikov2018). However, faults cross-cutting Cenozoic rocks are commonly related to normal faulting.
The modern stress field of the Kharaulakh segment, based on seismicity, contains both normal and thrust faulting stress fields, but always with a significant strike-slip component, which often predominates (Franke et al. Reference Franke, Krüger and Klinge2000; Imaev et al. Reference Imaev, Imaeva, Smekalin, Chipizubov, Ovsyuchenko and Kolodeznikov2018; Imaeva et al. Reference Imaeva, Gusev and Imaev2019). The absence of a strike-slip faulting stress field in the Danil River area shows that Cenozoic tectonics did not significantly affect the central part of the Kharaulakh segment. Data on post-Palaeocene tectonic events from adjacent fold-and-thrust belts are patchy as most of them contain only a few Cenozoic sedimentary rocks (Fig. 19). A normal faulting stress field was interpreted to have acted along the SE part of the Taimyr–Novaya Zemlya FTB, whose formation was likely related to the formation of the Laptev Sea rifts (Khudoley et al. Reference Khudoley, Verzhbitsky, Zastrozhnov, O’Sullivan, Ershova, Proskurnin, Tuchkova, Rogov, Kyser, Malyshev and Schneider2018). AFT data modelling gives evidence for an uplift phase of the outer part of the South Verkhoyansk sector at c. 30–20 Ma (Malyshev et al. Reference Malyshev, Khudoley, Glasmacher, Kazakova and Kalinin2018). Oligocene–Neogene conglomerate units of similar age are known from the southern part of the Priverkhoyansk foreland basin (Prokopiev et al. Reference Prokopiev, Parfenov, Tomshin, Kolodeznikov, Parfenov and Kuzmin2001). However, a more detailed study is necessary for a reliable interpretation of corresponding tectonic events.
6. Conclusions
The structural evolution of the Kharaulakh segment reflects regional tectonic processes that affected Arctic and NE Asia (Fig. 20). Our structural study and U–Pb calcite dating combined with a previous preliminary AFT and provenance study of Jurassic and Cretaceous clastic rocks (e.g. Malyshev et al. Reference Malyshev, Khudoley, Glasmacher, Kazakova and Kalinin2018; Vasiliev et al. Reference Vasiliev, Prokopiev, Khudoley, Ershova, Kazakova and Fridovsky2019) reveal the following succession of major deformation events across the northern Verkhoyansk FTB:
-
1) The oldest tectonic event is represented by brittle–ductile shear zones found in the hinge zone of the Chekurovka anticline. The estimated age of deformation is Early Permian (284 ± 7 Ma) and we correlate it with the main stage of the late Palaeozoic collision of the Kara terrane and northern margin Siberian Craton. The strike-slip faulting stress field corresponds to this tectonic event.
-
2) The most widespread and intense compression event that formed the modern fold-and-thrust structure of the Kharaulakh segment occurred in the Early Cretaceous, at c. 130–120 Ma. The U–Pb calcite age from the footwall of the Chekurovka thrust yielding 125 ± 4 Ma is attributed to this event. This tectonic event likely reflects closure of the South Anyui Suture zone and the final stages of the Kolyma–Omolon microcontinent – Siberian Craton collision.
-
3) During the tectonic event that occurred in the Late Cretaceous – Palaeocene, thrusts were reactivated, but did not significantly modify the already established fold-and-thrust structure of the Kharaulakh segment. The U–Pb calcite ages from thrust fault planes of the Danil River area yielding 76–60 Ma correspond to this event. Post-collisional interaction between the Kolyma–Omolon microcontinent and the Siberian Craton triggered the fault reactivation. Slickensides related to compressional tectonic events occurring at 130–120 Ma and 75–60 Ma were formed by similar stress fields with an approximately W–E compression axis trend. Most of the structures determining the structural style of the study area were formed in this stress field.
-
4) From the Palaeocene onwards, extensional environments predominated. Within the Kharaulakh segment, extension settings are supported by the formation of a set of grabens and a clearly recognized normal faulting stress field.
Supplementary material
To view supplementary material for this article, please visit https://doi.org/10.1017/S0016756822000528
Acknowledgements
This work was supported by the Ministry of Science and Higher Education of the Russian Federation (AK and SM, grant number 075-15-2019-1883), and the Leading House for Swiss Science and Technology Cooperation with Russia and the CIS Region (JR, AK and SM). Microscopic studies were done in the Research Centre for X-ray Diffraction Studies of St Petersburg State University. U–Pb calcite dating was conducted at ETH Zürich. Thanks to Alexander Pasenko, Alexander Saveliev and Elizaveta Shatrova for their participation in the field work. Thanks to Zoe Braden for contributing to calcite dating. We thank S. Zanchetta and an anonymous reviewer, the handling Associate Guest Editor F. Balsamo and the Editor O. Lacombe for providing helpful and constructive comments.