I. INTRODUCTION
The historical approach to physicochemical analyses of stones embraced the assumption that individual calcium kidney stones can be routinely segregated into meaningful categories based on the identification of two predominant minerals, namely, calcium oxalates (CaOx) or calcium phosphates. Unfortunately, traditional methods of clinical stone analytics have been unable to provide reliable parameters that can predict or direct prophylactic treatment to help reduce recurrent nephrolithiasis. Stone recurrence rates for calcium stone formers remain high (>50% at 10 years), despite a variety of preventive efforts. Reference Caudarella, Tonello, Rizzoli and Vescini1
Based on similarities in stone appearance on patient-care X-ray computed tomographic (CT) imaging, calculi are often thought of as homogenous, monolithic structures. For decades, urologists and radiologists have used stone density, as estimated by Hounsfield units (HU) on clinical CT scans, to help predict stone type, stone hardness, and how stones will respond to lithotripsy. Reference Zhong, Chuong, Goolsby and Preminger2–Reference Motley, Dalrymple, Keesling, Fischer and Harmon5 This approach is based on the assumption that stone mineral density is related to hardness, but this overlooks the underlying effects of marked heterogeneity in the structure, mineral density, and elemental composition of nephroliths. When stones are fractured and examined in detail, the stone interior reveals more complex compositions, growth patterns, and architecture than those previously understood. Reference Khan and Kok6–Reference Witzmann, Evan, Coe, Worcester, Lingeman and Williams8 While the predominant components responsible for the bulk of stone volume have been thoroughly investigated, the role of other components (organic and inorganic) has been poorly defined, mainly due to their existence in smaller quantities scattered throughout the stone. Stone analysis using X-ray diffraction, infrared spectrometry, and polarized microscopy started to provide detailed information as related to the structure and associated chemical compounds. Reference Cloutier, Villa, Traxer and Daudon9 However, individually, these analytic modalities are still not comprehensive or quantitative for all important stone components.
In recent years, micro-CT has become a reliable, nondestructive imaging modality for stone analyses, allowing for a truly microscopic, high resolution depiction of architecture and mineral density with voxel sizes less than 5 µm. Micro-CT data allow for the visualization and evaluation of internal structural features in any plane with high spatial resolution. Reference Ruegsegger, Koller and Muller10 It provides an opportunity to perform correlative microscopy using other imaging modalities such as light and electron microscopy techniques for in-depth analyses on physical and chemical intrinsic characteristics of materials in general.
Advances in spectroscopy have allowed the detection of numerous metals, metabolites, and proteins within stones on powdered mass and/or sectioned planes of interest. At microscale and nanoscale levels, individual stone components, with varying ratios of disordered (amorphous) to ordered (crystalline) structures, can be accurately identified based on isotropic/anisotropic shielding parameters, protonation, and degree of crystallinity. Reference Penescu, Purcarea, Sisu and Sisu11,Reference Bak, Thomsen, Jakobsen, Petersen, Petersen and Nielsen12 The aforementioned modalities have allowed for a comprehensive and accurate description of the complexity of renal calculi in humans. In addition to their predominant components, calcium-based stones contain hundreds Reference Ramaswamy, Killilea, Kapahi, Kahn, Chi and Stoller7,Reference Penescu, Purcarea, Sisu and Sisu11 of inorganic and organic components in variable quantities, many of which may have important contributions to initiation and progression of stone physicochemical characteristics. For example, routine stone analysis of calcium stones only reports predominant crystalline components, but up to 30% of stone volume in CaOx stones is thought to be noncrystalline. Reference Sohnel, Grases, Garcia-Ferragut and March13 Calcium-based stones have demonstrated remarkable compositional heterogeneity involving matrix proteins, organic acids, polysaccharides, and a variety of noncalcium metals. Reference Khan and Kok6–Reference Witzmann, Evan, Coe, Worcester, Lingeman and Williams8,Reference Fleisch14
While the aforementioned methods of detailed stone analysis were performed on individual stones to describe specific stone characteristics within stone types, there remains a need for a systematic comparison of data sets derived from analytic methods all performed on the same specimens. In this study, detailed sequential analyses on CaOx and apatite microstructure, mineral density, hardness, and stone composition was conducted by the direct correlation of information from various analytical techniques. We hypothesized that, when compared to apatite stones, CaOx stones would demonstrate distinct, reproducible patterns of ultrastructure, density, hardness, and mineralization. By better understanding the structural, mechanical, and compositional nature of the most common calcium stone types, we hope to gain clearer insights into the mechanistic processes influencing stone formation and growth, and subsequent response to therapy.
II. MATERIALS AND METHODS
A. Stone characteristics and acquisition
A local institutional review board approval (#14-4533) was obtained to collect clinical information and stone specimens from patients with known nephrolithiasis. Ten human urinary stone specimens (n = 5 CaOx and n = 5 calcium phosphate) were obtained endoscopically from consenting patients undergoing ureteroscopy or percutaneous nephrolithotomy. Routine clinical stone analysis on small select fragments from the same procedure was performed by Fourier transform infrared spectroscopy (FTIR) to determine predominant stone components. Preoperative stone size, location, and attenuation (in HU) were determined by an average of three attenuation measurements on noncontrast helical clinical CT scans, when available. Baseline stone characteristics (size, location, HU, and composition based on routine stone analysis) and patient characteristics (age, gender, body mass index, comorbidities, and procedure type) were recorded for each specimen. Prior to analyses, stones were sterilized using 0.26 Mrad of gamma radiation via an established protocol. Reference Brauer, Saeki, Hilton, Marshall and Marshall15
B. Micro-X-ray computed tomography: stone architecture and mineral density
All specimens were scanned under wet conditions using a micro-X-ray computed tomography scanner (Micro-XCT-200, Carl Zeiss Microscopy, Pleasanton, California), with a #2 source filter of the X-ray generated at a peak voltage of 40 kVp with a beam hardening constant at 2. Scans at magnifications of 4× and 10× were used for mineral density and structural analyses. The mineral densities of respective stones were determined following a detailed calibration protocol of micro-CT. Reference Djomehri, Candell, Case, Browning, Marshall, Yun, Lau, Webb and Ho16 An average distribution of lower and higher mineral densities over five specimens of each stone type was obtained. Average mineral densities were evaluated using two different approaches: (i) segmentation as provided by the postprocessing AVIZO® software (9.0.1, FEI, Hillsboro, Oregon) using water-shed algorithm and (ii) extracting the variation in mineral density via a histogram based on intensity differences within any given stone and then estimating the peak value through a Gaussian fit (see Supplementary Material Fig. 1). Reference Djomehri, Candell, Case, Browning, Marshall, Yun, Lau, Webb and Ho16
C. Indentation and light microscopy: stone hardness and structure
Prior to indentation, all stones were embedded in epoxy (Buehler, Lake Bluff, Illinois) and polished using carbide grit sizes 1200 and 2400 (Buehler Ltd.) followed by fine polishing using diamond suspension slurries in descending order from 6, 3, 1, to 0.25 µm (Buehler, Ltd.). Light microscopy (BX51, Olympus America, Inc., San Diego, California) of polished surfaces was performed by using Image-Pro Plus v6.0 data acquisition software (Media Cybernetics, Inc., Bethesda, Maryland) and images were collected at 4× magnification. Microindentation was performed under dry conditions with a Knoop diamond tip (Buehler, Ltd.) using a load of 10 gf, and the long diagonal of each Knoop indent was immediately measured with Image-Pro data acquisition software (Media Cybernetics, Inc.) using a light microscope. Microhardness (HK) was calculated with the following equation: HK = 0.0142P/D 2, where P is the normal load in Newtons (N) and D (mm) the length of the long diagonal. Multiple rows of radially oriented indents were performed on each stone. The distance between any two indents was chosen as per ASTM standards. 17 The resulting average value was used as a representative hardness value for each stone within the CaOx and calcium phosphate groups, respectively.
D. Energy dispersive X-ray analysis and inductively coupled plasma optical emission spectroscopy (ICP-OES): elemental composition of stones
The elemental content in stone specimens was analyzed using two complementary spectrometry tools: (i) energy dispersive X-ray and (ii) inductively coupled plasma optical emission spectroscopy. The polished surface of the stones was characterized for site-specific element tracing using an energy dispersive X-ray spectroscopy (EDS) detector (Bruker AXS, Madison, Wisconsin). The other half of the stone was used to determine the total elemental content using ICP-OES. Reference Killilea, Westropp, Shiraki, Mellema, Larsen, Kahn, Kapahi, Chi and Stoller18 In brief, stone specimens were digested in 0.5 mL 70% HNO3 and incubated overnight at 60°C with 150–200 rpm orbital shaking. The acid lysates were then diluted to 5% HNO3 with water, clarified by centrifugation, and introduced via a pneumatic concentric nebulizer using argon carrier gas into a Agilent 5100 SVDV ICP-OES (Agilent Technologies, Santa Clara, California). ICP-OES was calibrated using the National Institute of Standards and Technology-traceable elemental standards and reference material. The utilized method measured 34 elements with a minimum detection between 0.031 and 3.125 parts per million. Instrument precision for each element was typically between 5 and 10%. Cesium (50 ppm) was used for ionization suppression and yttrium (5 ppm) was used as an internal standard for all specimens. All reagents and plastic wares were certified or routinely tested for trace metal work. Elemental content data were summarized using native software (ICP Expert; Agilent Technologies) and normalized to the mass of the stone specimens.
III. RESULTS
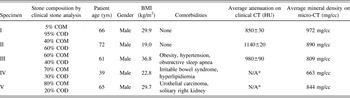
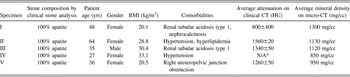
Quantitative component analysis of all five stones in the apatite group revealed 100% apatite. Stone specimens also included in the CaOx group were 100% CaOx, with different quantities of calcium oxalate monohydrate (COM) (5–80%) versus calcium oxalate dihydrate (COD) (20–95%) as is typically seen in clinical practice. A breakdown of baseline stone characteristics for CaOx and apatite stones is included in Tables I and II.
Baseline characteristics of calcium oxalate stone formers. COM = calcium oxalate monohydrate. COD = calcium oxalate dihydrate. BMI = body mass index. HU = Hounsfield units. *Clinical X-ray CT scans were not performed on these patients prior to stone removal.

Baseline characteristics of apatite stone formers. BMI = body mass index. HU = Hounsfield units. *Clinical CT scan was not performed on this patient.

A. Structure and mineral density of calcium oxalate stones
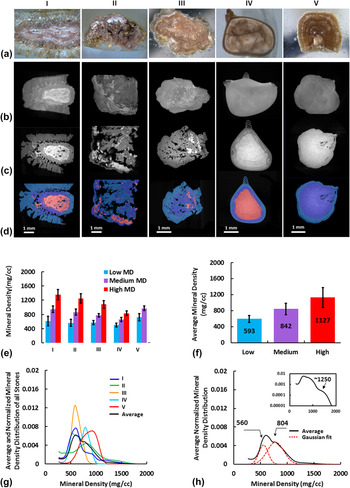
Under light microscopy, CaOx stones showed a variation in the orientation of lamellar structures and voids [Fig. 1(a)]. Representative 3D volumes of scanned stones [Fig. 1(b)] showed a morphology similar to that observed under light microscopy and also allowed for the determination of regional mineral density within lamellar regions [Figs. 1(c)–1(d)]. All CaOx stones showed heterogeneity in mineral density. As the monohydrate component of CaOx stones decreased, the structure and mineral density varied from a discrete to a more systematic and structure-less growth with decreasing mineral density as observed using X-ray microscopy [Figs. 1(a), 1(c)–1(e)]. Evaluation by light microscopy illustrated radial and lamellar growth patterns within CaOx stones [stones IV and V in Fig. 1(a)]. In general, mineral densities for all regions of CaOx stones revealed high density regions, but no detectable higher mineral density with increased monohydrate percentage was observed. On average, mineral density distributions of the five CaOx specimens using postprocessing segmentation indicated values of low (590±80 mg/cc), medium (840±140 mg/cc), and high (1100±200 mg/cc) density regions [Figs. 1(e) and 1(f)]. Mineral density variation was confirmed via a separate analytic method. Gaussian curves were calculated for each stone, with the area under the curve illustrating mineral density variation within each stone [Fig. 1(g)]. The combined analysis of the Gaussian fit revealed three significant peaks at 560, 800, and 1300 mg/cc; the third peak in a logarithmic plot of average mineral density distributions had a shoulder that corresponds to the higher mineral density of 1300 mg/cc [Figs. 1(g) and 1(h)].
Mineral density analyses of calcium oxalate stones. (a) Light microscopy at 1× to 1.5× magnifications illustrates the cross section of calcium oxalate stones with increasing and decreasing concentrations of monohydrate and dihydrate. (b) 3D digital volumes of stones reconstructed from micro-CT data. (c) A representative cross section illustrating mineral density variation where whiter to darker regions correspond to higher to lower mineral densities within stones. (d) Micro-CT segmentation of mineral densities based on significant differences in intensities highlights distinct regions of low, medium, and high mineral densities on representative CT-slices that are also represented in panel (e) (color figure available online, with blue, purple, and red corresponding to regions of low, medium, and high mineral densities, respectively). (e) Respective average mineral density volumes of low (light gray), medium (medium gray), and high (dark gray) mineral densities within each stone as determined by micro-CT segmentation analysis are illustrated (color figure available online with blue, purple, and red corresponding to regions of low, medium, and high mineral densities, respectively). (f) Respective average post-segmentation analysis values of low, medium, and high mineral densities for all specimens are shown in the form of a bar graph. (g) A separate mineral density analysis utilizing Gaussian curves (see Supplementary Material Fig. 1 for methodology) which revealed normalized mineral density distribution for each specimen illustrates dominant peak, with the darkest line depicting average distribution for all stones. (h) Average mineral density distributions of the 5 CaOx specimens (solid curve) and Gaussian fit to the corresponding peaks illustrate three distinct mineral density values similar to those determined by micro-CT segmentation [identified in (f)]. Inset illustrates a logarithmic plot of average mineral density distribution and a small shoulder around 1250 mg/cc.

B. Structure and mineral density of calcium phosphate stones
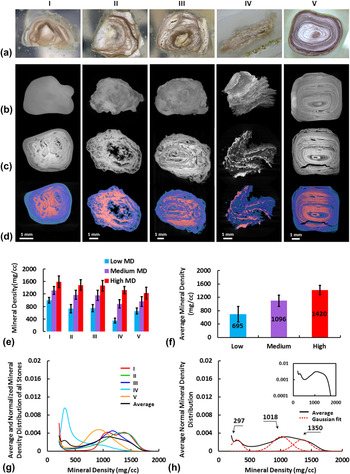
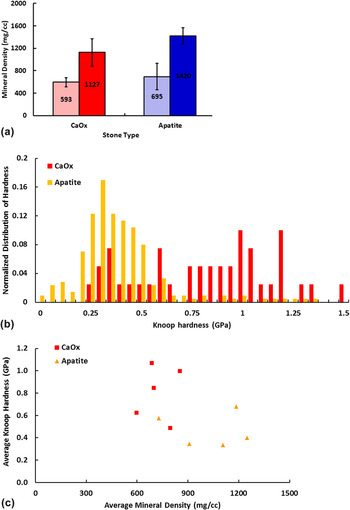
All calcium phosphate stones were clinically classified as 100% apatite in composition (Table I). Variability in lamellar patterns with apparent growth from various nucleation sites was observed [Fig. 2(a)]. In any given stone, micro-CT segmentation analysis revealed three significantly different density volumes, with averages of 700±200 mg/cc, 1100±200 mg/cc, and 1400±140 mg/cc in low, medium, and high density regions, respectively [Figs. 2(e) and 2(f)]. Utilizing the Gaussian fit, peak values of the normal mineral density distribution curves were centered at low (300 mg/cc), medium (1010 mg/cc), and high (1350 mg/cc) density regions [Figs. 2(g) and 2(h)]. In comparison to CaOx stones (average mineral density 840 mg/cc), apatite stones demonstrated higher average mineral density (1070 mg/cc).
Mineral density analyses of apatite stones. (a) Light microscopy at 1× to 1.5× magnifications illustrates the cross section of apatite stones. (b) Illustrations of 3D digital volumes of stones reconstructed from micro-CT data (note that stones IV and V were not intact and as a result reveal the cross section). (c) A representative cross section illustrating stratification by virtue of mineral density variation where whiter to darker regions correspond to higher to lower mineral densities within stones. (d) Micro-CT segmentation of mineral densities based on significant differences in intensities highlights distinct regions of low, medium, and high mineral densities on representative CT-slices that are also represented in panel (e) (color figure available online with blue, purple, and red corresponding to regions of low, medium, and high mineral densities, respectively). (e) Respective average mineral density volumes of low (light gray), medium (medium gray) and high (dark gray) mineral density within each stone as determined by micro-CT segmentation analysis are illustrated (color figure available online with blue, purple, and red corresponding to regions of low, medium, and high mineral densities, respectively). (f) Respective average post-segmentation analysis values of low, medium, and high mineral densities for all specimens are shown in the form of a bar graph. (g) A separate mineral density analysis utilizing Gaussian curves (see Supplementary Material Fig. 1 for methodology) which revealed normalized mineral density distribution for each specimen illustrates dominant peak, with the darkest line depicting average distribution for all stones. (h) Average mineral density distributions of the 5 CaOx specimens (solid curve) and Gaussian fit to the corresponding peaks illustrate three distinct mineral density values similar to those determined by micro-CT segmentation [identified in (f)]. Inset illustrates a logarithmic plot of average mineral density distribution and a small shoulder around 1018 mg/cc.

C. Hardness of calcium oxalate and calcium phosphate stones
A normalized distribution of the Knoop hardness of CaOx versus apatite stones revealed that CaOx specimens routinely demonstrated higher hardness than apatite stones. Average hardness plotted against average mineral density for each stone type revealed clustering of data sets. Despite having lower density, CaOx stones demonstrated higher hardness compared to apatite stones (Fig. 3). Thus, stone density and stone hardness were inversely correlated.
Knoop hardness of calcium oxalate versus apatite stones. (a) Normalized distribution of hardness. (b) Cluster plot of average Knoop hardness versus average mineral density illustrates constant mineral density for varying hardness in the case of calcium oxalate and constant hardness for varying mineral densities for apatite stones. (c) Averages of low and high density regions in CaOx versus apatite stones.

D. Elemental composition of stones
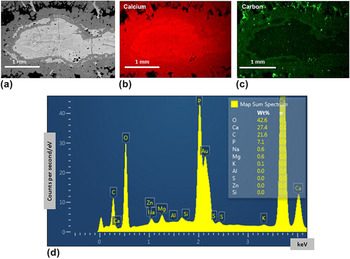
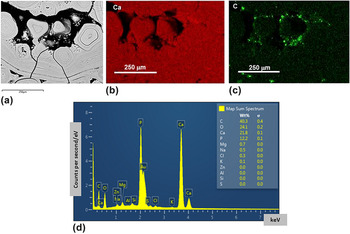
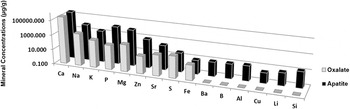
The presence of carbon/organic matter between morphologically distinct layers of CaOx stones was detected by EDS (Fig. 4). EDS also indicated organic matter within stratified layers of apatite stones (Fig. 5). Calcium was observed to be the dominant element in all stones based on data extracted from the EDS and ICP-OES techniques. Stones in both groups also contained various other elements, including sodium, potassium, magnesium, zinc, strontium, sulfur, and iron (Fig. 6). Levels of potassium, phosphorus, magnesium, zinc, and strontium were significantly higher in apatite stones (Fig. 6). Levels of sulfur and iron were slightly higher in CaOx stones (Fig. 6). Apatite stones also contained detectable levels of barium, boron, aluminum, copper, lithium, and silicon; these minerals were below detection levels in the CaOx specimens (Fig. 6).
Back scattered image (a) of a calcium oxalate stone with 5% monohydrate and 95% dihydrate illustrates the ubiquitous spread of calcium (Ca) (b) and discrete localization of carbon (c). Spectrum indicates distribution of various elements regardless of point, line, or area scans and respective weight percents (d).

Back scattered image (a) of a calcium apatite stone illustrates the ubiquitous spread of calcium (Ca) (b) and discrete localization of carbon (c). Spectrum indicates distribution of various elements regardless of point, line, or area scans and respective weight percents (d).

Concentration of elements in calcium oxalate and apatite stones (logarithmic scale).

IV. DISCUSSION
A. Structural and chemical heterogeneity in calcium-based nephroliths
For decades, the workup of a recurrent calcium kidney stone former has included routine serum tests, 24 h urine collections, and routine laboratory assessment of stones for “stone compositional analysis.” The determination of a calcium-based stone beyond anything more than simply being composed of primarily calcium does little to change the medical and surgical management of kidney stone formers. The toolbox has remained the same over the last 3 decades: serum and urine tests to screen for renal dysfunction and metabolic causes such as renal tubular acidosis and primary hyperparathyroidism, 24 h urine collections to identify urinary abnormalities, and chemical stone composition. Using these approaches, the ability to understand stone development and prevent stone recurrence continues to remain limited. To best understand the processes responsible for nephrolithiasis and other forms of pathologic biomineralization in human tissues, more detailed and systematic approaches must be undertaken. In this study, we evaluated the structure, elemental composition, mineral density, and hardness of common calcium stones by streamlining analytical approaches (micro-CT, indentation, and elemental X-ray and mass spectroscopy) that are not routinely used in a clinical setting. This revealed complex heterogeneity in stone specimens that has not been appreciated with contemporary clinical techniques.
Calcium-predominant stones are implicated in approximately ∼85% of nephrolithiasis cases. CaOx, complexed as COM or COD, is present as a predominant component in greater than 60% of stones. Calcium phosphate, most frequently categorized as an apatite, is the second most common stone type and is a predominant component in approximately 20% of renal stones. Reference Pearle, Lotan, Wein, Kavoussi, Novick, Partin and Peters19,Reference Denstedt, Fuller, Talati, Tiselius, Albala and Ye20
Many CaOx stones contain both COD (weddellite) and COM (whewellite) components, and structural variability may be attributed to variable quantities of each component and patterns of COD versus COM arrangement. The crystal structures of COD and COM have previously been studied by thermal, X-ray diffraction, and infrared spectroscopy analyses. Differences in orientation are also thought to be dependent on the water content complexed to CaOx. As seen in Figs. 1 and 2, COM crystallizes in a monoclinic lattice, with a flat sheet-like structure. In contrast, in its dihydrate form (COD), CaOx has a tetragonal structure with each calcium polyhedron linked to two adjacent polyhedra, generating a chain-like formation. This repetitive formation of calcium chains and oxalate-water ribbons generates channels in which water or other molecules may reside with partial site occupancy. Reference Echigo, Kimata, Kyono and Shimizu21,Reference Conti, Casati, Colombo, Realini, Brambilla and Zerbi22 These patterns may explain important differences in the structure, density, hardness, and fragmentation properties among CaOx stones.
In the current study, apatite stones demonstrated thinly layered lamellae surrounding a central core, whereas CaOx stones had less consistent patterns of layering and were more likely to demonstrate significant agglomerated volumes, especially in specimens with COM predominance (specimens IV and V; Fig. 1). These findings are consistent with previous reports. Reference Zarse, McAteer, Sommer, Kim, Hatt, Lingeman, Evan and Williams23 Although stone types seem to have a visible signature as indicated by growth patterns, further analysis of calcium stone composition, density, and hardness revealed significant heterogeneity among specimens, even those within the same stone type. Most notably, all stones which were analyzed demonstrated regions with significant variability in mineral density detected by micro-CT.
Previous work using micro-CT to evaluate renal calculi has shown that individual calcium stones, even those thought to be “pure” in composition, often have greater than five distinct regions of appearance on micro-CT. Reference Zhong, Chuong, Goolsby and Preminger2,Reference Williams, McAteer, Evan and Lingeman24 Our analyses corroborate with these reports. In addition to showing variability in the structure, the current study also highlights heterogeneity in density and elemental composition within calcium stones that would otherwise be considered “simple” or “pure” by routine stone analysis.
Interestingly, in the current investigation, stones composed of 100% apatite revealed an even wider range of heterogeneity in arrangement and density compared to CaOx stones. Increased structural heterogeneity in apatite stones seems to be associated with high variability of density within the stone, as detected by micro-CT. Previous study of apatite in Randall’s plaques has confirmed evenly distributed calcium phosphate deposits (without layering) in interstitial plaques near the tip of renal papilla. However, in growing apatite stones, minerals are sequentially added in visible layers with distinct differences in mineral density. Reference Williams, Lingeman, Coe, Worcester and Evan25 It has been postulated that this may occur due to the deposition of organic components in intervals within mineral forming layers much like the organic paste with salts that is deposited between layers in bone formation. Reference Clarke26
Often referred to as the “matrix,” the variety of organic/proteinaceous matter within stones has recently been shown to be more significant than previously imagined. Early investigations of stone growth found that inhibitors and ligands (such as glycosaminoglycans) were capable of binding to CaOx crystals and play a key role in stone growth and inhibition, which may be a function of protein charge density and the ability to enhance or disrupt the ionic strength of individual bonds of CaOx crystals. Reference Fellstrom, Lindsjo, Danielson, Karlsson and Ljunghall27 To date, nephrocalcin, Tamm–Horsfall protein, osteopontin, and bikunin all have been identified as important inhibitory proteins while chondroitin sulfate, heparan sulfate, and hyaluronic acid are the best studied glycosaminoglycans. Reference Khan and Kok6 More recently, the proteomic analysis of matrix material within two renal calculi using a chaotropic reducing solution for extraction/solubilization, combined with quantitative mass spectrometry, identified 1059 unique proteins, of which 606 were common to both stones. Reference Williams, Saw, Paterson, Hatt, McAteer and Lingeman4 The diverse origin (intracellular, extracellular, cell membrane, and serum) and functional properties of these proteins further details the complex nature of stone formation.
The quantity and orientation of organic components within stones may play a key role in determining the variability in density and hardness in different locations within calculi and between separate specimens of the same type, as demonstrated from our analyses. In the current analysis using EDS, organic material was identified in both CaOx and apatite stones. In CaOx stones, organic material appeared to be scattered as deposits within peripheral regions of the stone. Previous studies also have shown that, within CaOx stones, COM growth faces demonstrate a vast array of molecular arrangements, whereas COD stones have an even distribution of charge allowing for a contiguous orientation of protein deposition on growth faces. Reference Walton, Kavanagh and Heywood28 Apatite stones also appear to have an organized, circumferential distribution of organic material, likely between layers of apatite. Stones with growth faces allowing for the deposition of organic material (and thereby changing subsequent orientation) have less directional dependence and may demonstrate decreased fractional resistance which, clinically, may result in more susceptibility to lithotripsy. Future studies will aim to better identify key proteins and metabolites that directly influence stone formation and composition. It remains of investigative interest that noncollagenous proteins with known roles in biomineralization, including osteopontin, have been detected within the core and outer layers of COM stones. Reference McKee, Nanci and Khan29
B. Elementome
Further highlighting calcium stone heterogeneity, mass spectrometry data in the current analysis revealed detectable levels of additional elements within stones, including sodium, potassium, magnesium, zinc, strontium, sulfur, and iron. In addition, apatite stones were also found to contain barium, boron, aluminum, copper, lithium, and silicon. This adds to a body of literature that previously has detected over 40 different elements in urinary stones, including sulfur, magnesium, sodium, potassium, zinc, aluminum, strontium, iron, boron, lead, copper, nickel, lithium, chromium, vanadium, cobalt, selenium, molybdenum, arsenic, cadmium, tin, and even elements from the lanthanide series. Reference Ramaswamy, Killilea, Kapahi, Kahn, Chi and Stoller7 Along with proteins and organic metabolites, the presence of these elements speaks of the vast heterogeneity of individual stones, and they may play a key role in accelerating and/or inhibiting stone growth rates. Previous studies have detected that concentrations of individual elements vary from the nucleus to crust. Elements which are more heavily concentrated near the nucleus or stem of the stone may be indicative of a direct role in the initiation of stone formation and may be directly related to heavy elemental concentrations in the tubules and interstitium of the papilla where stones begin to form. Reference Perk, Serel, Kosar, Deniz and Sayin30 Further characterization of the individual roles of proteins and minerals in the formation of Randall’s plaques, stone stems, and attached stones may allow for the development of personalized, targeted therapies in recurrent stone formers. For example, in vitro models have indicated that genetic, dietary, and pharmacologic intervention to lower zinc may prove beneficial in the inhibition of heterogeneous nucleation and genesis of stones. Reference Chi, Kim, Lang, Bose, Kahn, Flechner, Blaschko, Zee, Muteliefu, Bond, Kolipinski, Fakra, Mandel, Miller, Ramanathan, Killilea, Bruckner, Kapahi and Stoller31 Others have shown that structural variation within COM stones may be related to the presence of trace elements. Stones with higher concentrations of zinc, manganese, and magnesium have demonstrated enhanced strength and poorer response to lithotripsy. Reference Turgut, Unal, Berber, Demir, Mutlu and Aydar32 The use of ICP in the current analysis and the use of EDS to an extent specific to locations within stones elements within stones, it is not specific to locations within stones. Due to specimen processing, most organic material within stones is likely to be eliminated prior to the ICP analysis; therefore, it is likely that the elements are present within the crystalline lattice of the stone rather than matrix components. However, the overall implications of rare elements in stones’ formation and growth warrant further investigation.
C. Stone mineral density and hardness
In clinical practice, stone density, measured by attenuation (in HU) on helical CT has been thoroughly investigated as a means of predicting stone composition and a specific stone’s susceptibility to fragmentation via lithotripsy, especially extracorporeal shock wave lithotripsy. In the urologic community, stone attenuation <900–1000 HU on a clinical CT scan is often used as a predictor of extracorporeal shock wave lithotripsy success. Reference Wiesenthal, Ghiculete, D’A Honey and Pace33,Reference Ouzaid, Al-gahtani, Dominique, Hupertan, Fernandez, Hermieu, Delmas and Ravery34 During endoscopic laser lithotripsy, stones with very low (<600 HU) and very high (>1200 HU) density on a preoperative clinical CT scan are associated with poorer treatment success and longer operative times. This is because high density stones tend to take longer to fracture, while very low density stones often break easily but their debris and fragments are difficult to retrieve. Reference Anastasiadis, Onal, Modi, TUrna, Duvdevani, Timoney, Wolf and De La Rosette35
However, the use of HU to predict the stone type and behavior has significant limitations, mainly because there is a significant overlap in the potential attenuation values for many different stone types. Reference Motley, Dalrymple, Keesling, Fischer and Harmon5,Reference Bellin, Renard-Penna, Conort, Bissery, Meric, Daudon, Mallet, Richard and Grenier36,Reference Bulakci, Tefik, Akbulut, Ormeci, Bese, Sanli, Oktar and Salmaslioglu37 HU measurements can also vary based on CT scan parameters and patient body habitus. Furthermore, radiodensity (as measured by HU) is a function of both stone composition and size. Stone attenuation on clinical CT is influenced (typically lowered) by volume averaging effects from surrounding tissues of lower density. The determination of HU without accounting for the stone size relative to the sampling volume can lead to inaccurate estimates of stone density, and many studies have questionable reporting of HUs. Reference Williams, Zarse, Jackson, Lingeman and McAteer3,Reference Motley, Dalrymple, Keesling, Fischer and Harmon5 Clinicians appreciate this when they place the small cursor over a stone on a clinical CT scan and move it to various locations within the stone and obtain at times markedly different values. In practice, one takes an eye-balled average to determine clinical HUs.
The diversity in the stone structure and mineral density demonstrated in the current analysis provides a potential explanation for variability in stone attenuation and fragmentation energies required as appreciated during laser lithotripsy or percutaneous ultrasonic stone fragmentation. In 2007, Zarse and colleagues performed shock wave lithotripsy on previously extracted stones and, not surprisingly, found that stones with more structural heterogeneity visualized on micro-CT required less shocks for comminution (910±680 shock waves/g) compared to homogenous stones (1900±800 shock waves/g). Reference Zarse, Hameed, Jackson, Pishchalnikov, Lingeman, McAteer and Williams38
Estimating stone density via attenuation on clinical CT imaging may not actually be providing an accurate representation of stone hardness. While density measurements simply reflect the mass of mineral per volume, mineral hardness accounts for the intrinsic structural and mechanical properties of the stone. Mechanically, hardness is a better gauge of how a stone will respond to an applied force. Better estimates of stone hardness and fragility are likely to be determined by an interaction of mineral content with organic material, porosity, and packing density leading to the compactness and concretion of the stone.
In our analyses, average stone densities measured by both clinical CT and micro-CT were correlated specifically at the lower end of mineral densities. However, this trend did not hold true at higher mineral densities plausibly because of the heterogeneity revealed by micro-CT compared to clinical CT systems. Regardless, between CaOx and apatite stones an inverse correlation between mineral density and hardness was observed. Higher mineral density was proportional to lower hardness and vice versa. The strong correlation of constant hardness over varied mineral density could indicate the structure as the main contributor for stone hardness in calcium phosphate stones, while varied hardness in the setting of a constant mineral density could be due to the variation in elemental composition and thereby structure in CaOx stones (i.e., differences between monohydrate and dihydrate compositions). However, previous studies have found that CaOx stones have less regional and directional differences in microhardness when compared to apatite stones. Central regions of apatite stones tend to be hardest, while directional differences in hardness are seen in outer layers within the thin lamellar structure. Much like density, structural (Knoop) hardness can be variable within different regions of the same stone and is a function of the placement of the indenter relative to the orientation of crystal growth. Reference Zhong, Chuong, Goolsby and Preminger2
Heterogeneity in stone composition and differences in hardness may ultimately help us to explain why there is such clinical variability in stone fragility. Stone susceptibility to shock wave lithotripsy and dusting with laser lithotripsy can be highly variable, even among stones that are composed of the same major mineral type. Reference Williams, Saw, Paterson, Hatt, McAteer and Lingeman4 Based on the current analysis, this may be due to regional differences in architecture, density, organic deposition, and elemental composition. Ongoing studies will seek to better define the relationships between stone attenuation on clinical CT, mineral density on micro-CT, stone indentation properties, and stone fragility. In the future, markers of stone heterogeneity (based on imaging studies and stone analytics) will guide effective stone treatment with lithotripsy modalities. More routine use of comprehensive stone protocols using analytical tools may also help us to provide essential information for better understanding the stone development and behavior and hopefully direct more effective prophylactic measures.
D. Limitations
Although the current study is limited to CaOx and apatite stones, it provides reproducible data from a multi-modality analytical protocol performed in a head-to-head fashion on the two most common forms of human nephroliths. Future studies will aim to delineate the structural, mechanical, and compositional characteristics of other common stone types such as brushite, uric acid, cystine, and mixed stones. The analysis of additional stone types will provide a more comprehensive outlook on similarities and differences in mineral density, elemental composition, and mechanical properties. While all stones were individually exposed to various imaging modalities and indentation testing, mass spectroscopy was performed on powder derived pulverized stones of each general stone type (powder derived from the five CaOx stones and five apatite stones). It is therefore difficult to ascertain if the elemental composition reported was truly a representative of each individual stone. An additional limitation is that average hardness was compared to average overall stone density for each stone. Given that hardness testing was performed on a polished stone surface and mineral density was determined from 3-dimensional micro-CT reconstructions, a direct comparison of site-specific hardness to mineral density of the stone surface was not performed (Supplementary Material Fig. S1). Furthermore, correlating with urine from the stone formers whose stones were included in this analysis would allow the comparison of elemental composition and quantity in urine and stone to better delineate active stone forming constituents. Future improvements in specimen collection and mass spectroscopy protocols will allow us to perform metabolomic and elemental analyses of a larger cohort of patients from whom both urine and stones will be collected as specimens.
V. CONCLUSIONS
Using advanced analytic techniques, calcium-based calculi were found to have significant heterogeneity in the structure, mineral density, and elemental composition that is not elucidated by routine clinical testing. Compared to apatite stones, CaOx calculi demonstrate a less lamellar structural arrangement, but with distinct interfaces, and contain a disorganized deposition of organic material. Apatite stones have a more lamellar arrangement with highly variable density, possibly due to the circumferential layering of organic material. Despite being 100% apatite by routine stone analysis, apatite stones were found to contain numerous other minerals in small quantities. This heterogeneity appears to be highly complex and individualized, likely a reflection of the ever-changing environment to which stones are exposed during formation and aggregation.
Underlying stone heterogeneity also can help explain why historical approaches have failed in accurately predicting stone types and response to lithotripsy. Despite the widespread assumption in the urologic community that stone density is equal to hardness (and thus susceptibility to lithotripsy), calcium stone density estimates (as measured by clinical CT and micro-CT) do not directly correlate with actual stone hardness. While apatite stones demonstrated higher average mineral density than CaOx stones, CaOx stones (especially those with increased COM component) have higher hardness. Conceptually, hardness measurements are limited to 500–1000 µm deep albeit a well-defined plastic zone at and beneath the indentation site within the region of interest. As a result, average mineral density of the entire specimen should be correlated with the crushing strength (resistance to fracture) of the stone. Future studies will aim to better define compositional factors, including elemental and organic material, and how they contribute to the stone formation and structure, and thereby their resistance to fracture. Spanning the realm of personalized medicine, comprehensive stone analytic protocols may one day help in leading to more effective individualized treatments and stone prevention strategies for recurrent stone formers.
Supplementary Material
To view supplementary material for this article, please visit https://doi.org/10.1557/jmr.2017.153.
ACKNOWLEDGMENTS
Experimental assistance from Ms. Grace Nonomura, Ms. Sabra Djomehri, M.S. is greatly appreciated. The authors thank the Biomaterials and Bioengineering Micro-CT Imaging Facility (http://bbct.ucsf.edu), UCSF for the use of MicroXCT-200. This work is supported by funds from NIH: NIDDK/P20DK100863 (MLS), R21 DK109912 (SPH, MLS), and NIDCR/R01DE022032 (SPH).